
 Open Access Article
 This Open Access Article is licensed under a Creative Commons Attribution-Non Commercial 3.0 Unported Licence
Colloid-assisted growth of metal–organic framework nanoparticles†
Asep Bayu Dani
Nandiyanto‡
ab,
Xiang
He‡
 a and
Wei-Ning
Wang
*a
a and
Wei-Ning
Wang
*a
aDepartment of Mechanical and Nuclear Engineering, Virginia Commonwealth University, Richmond, Virginia 23219, USA. E-mail: wnwang@vcu.edu; Tel: +1 804 827 4306
bDepartemen Kimia, Universitas Pendidikan Indonesia, Jl. Dr. Setiabudi no 229, Bandung 40154, Indonesia
First published on 11th March 2019
Abstract
A new colloid-assisted approach is introduced to synthesize metal–organic framework (MOF) nanoparticles. Polystyrene latex (PS) nanocolloids were used as model colloids, which provide active surface sites for the controlled, in situ growth of MOF nanoparticles. Interactions among the colloid surfaces, ligands, and metal ions were studied systematically to map out the possible formation pathways of the MOF nanoparticles.
Metal–organic frameworks (MOFs) have attracted tremendous attention during the past decades due to their super high porosity and incredibly large surface areas,1 enabling their applications in a variety of areas, from gas adsorption and storage, catalysis, molecular sieving, to chemical sensing.2
Conventional synthesis of MOFs includes three major steps: (1) mixing metal ions and ligands in a solvent; (2) nucleation and growth through heating the precursor to form MOFs; and (3) purification and activation.3 These procedures, which are generally conducted in bulk solutions, are effective for fabricating various types of MOFs with sizes ranging from micrometers to millimeters.3b,4 With the increasing trend of manufacturing miniature devices, it is desirable to construct MOFs with sizes in the nanometer range.5 MOF nanoparticles are also increasingly important for drug delivery,6 diagnosis (e.g., positron emission tomography7 and magnetic resonance imaging8), and biomedical applications.9 However, it is very challenging to fabricate MOF nanoparticles in a conventional way because the nucleation and growth of MOFs in bulk solutions occur so fast.3b,4 Therefore, to synthesize MOF nanoparticles, additional strategies to manipulate the nucleation and growth processes of MOFs must be applied.10 Four general strategies have been suggested: (1) regulating the process conditions,11e.g., lowering the concentration and optimizing the compositions of reactants; (2) using microemulsion and reverse microemulsion processes12 for limiting the growth process since the reactants and the formed nuclei are in different phases; (3) utilizing specific techniques such as ultrasound and microwave-assisted heating3b,4 to increase the number of reaction sites and nucleation; and (4) adding additives13 to suppress the growth process.
Different from the aforementioned techniques, the present study introduces a new synthetic approach to fabricate MOF nanoparticles by employing nanocolloids to provide growth sites (Fig. 1A). In this method, the nanocolloids synergistically interact with ligands and metal ions to promote heterogeneous nucleation and in situ growth of MOF nanoparticles on their surfaces. The existence of heterogeneous nucleation facilitates the generation of more nuclei,14 allowing the successful fabrication of nanoparticles.15 The synthetic procedure involves the following steps: (i) interaction between ligands and the colloid surface to form a ligand layer on the colloid as the MOF growth sites (dashed and dotted arrow); (ii) deposition of metal ions (Mn+) to the growth sites due to the electrostatic interactions (dashed arrows). The deposited metal ions react with ligand layers to form nuclei and grow MOF nanoparticles on the surfaces of the colloids (red solid arrows); and (iii) removal of the nanocolloids to obtain MOF nanoparticles (Fig. 1B). It should be noted that the sequence of the above steps is important. Not following the correct sequence will result in failed formation of MOF nanoparticles. For example, when the ligand layer is not formed on the colloid surface, i.e., they exist in the solution as free ligands, large MOF particles will be formed as they were produced in the bulk method (see blue solid arrows).3b,4
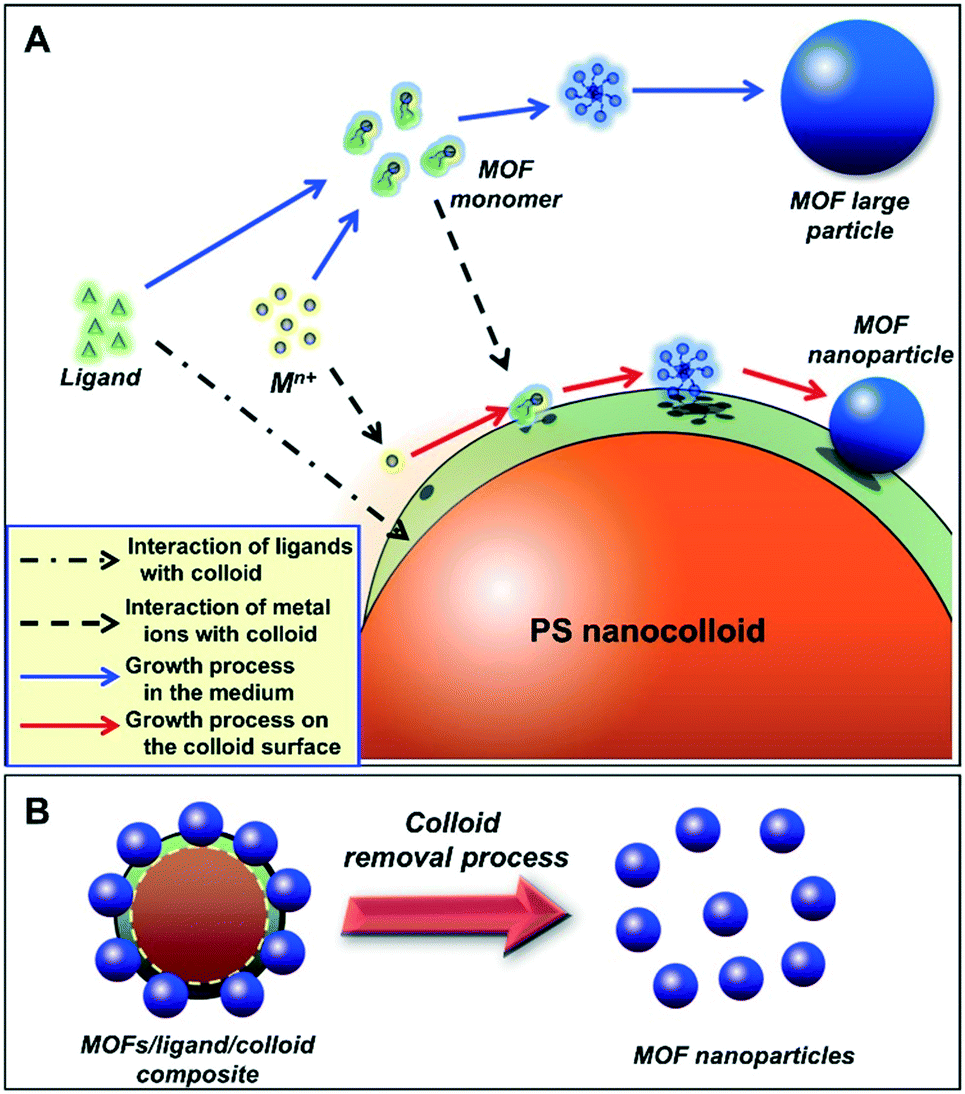 | ||
| Fig. 1 (A) Schematic illustration of formation pathways of MOF nanoparticles on the surface of a nanocolloid, and (B) the production of MOF nanoparticles after the colloid removal process. | ||
In this work, MIL-100(Fe) (MIL: Materials Institute Lavoisier) was selected as the model MOF, since it is one of the most widely used MOFs for environmental remediation.16 Polystyrene latex (PS) nanocolloids were used as the colloid model since they are chemically stable17 against reactions with ligands, making them an excellent candidate for growth sites of MOF nanoparticles. Although submicrometer-sized PS spheres were used as templates to produce porous18 and hollow MOFs,19 controlled synthesis of MOF nanoparticles on the surfaces of PS nanocolloids has not been reported.
In short, MOF nanoparticles were synthesized by mixing a certain amount of PS nanocolloids (10 wt%; MagSphere Inc., US; average sizes of 31 and 78 nm; see Fig. S1A and B,† respectively) and trimesic acid (95%; Sigma-Aldrich; as the ligand) in an aqueous solution for 15 minutes, followed by addition of iron(III) chloride (FeCl3·6H2O; 97%; Sigma-Aldrich; as the source of metal ion). The mixture was then put into a hydrothermal autoclave reactor and heated at 150 °C for 12 hours. The product was purified by a centrifugation process (11![[thin space (1/6-em)]](https://www.rsc.org/images/entities/char_2009.gif) 000 rpm for 30 minutes three times), followed by washing with dimethylformamide (DMF) (99.8%; Sigma-Aldrich) to remove unreacted chemicals and the PS nanocolloids, and then dried in a vacuum oven at 50 °C overnight. The mole ratio of metal ions to ligands was fixed at 1.00. The mass ratio of PS nanocolloids to anhydrous metal ions was varied from 0 to 0.33. To support the analysis, several characterizations were conducted by using a scanning electron microscope (SEM) equipped with an energy dispersive X-ray (EDX) spectrometer (SU-70, Hitachi Co. Ltd., Japan), a powder X-ray diffractometer (PXRD, PANalytical X'Pert Pro), a Fourier transform infrared spectrometer (FTIR, Nicolet iS50, Thermo Scientific, US), a nitrogen sorption instrument (Autosorb iQ, Quantachrome Instruments), and a zeta potential analyzer (Zetasizer Nano ZS, Malvern Instruments Ltd.). To measure the particle size and size distribution, the dynamic light scattering (DLS) technique is often used.20 However, the DLS technique is generally good for measuring well-dispersed particles with a spherical shape. In this work, the Feret method21 was used to measure the particle size and size distribution of both PS spheres and MOF particles from the SEM images (see Fig. S2†). Detailed information of the Feret analysis is presented in ESI 2.†
000 rpm for 30 minutes three times), followed by washing with dimethylformamide (DMF) (99.8%; Sigma-Aldrich) to remove unreacted chemicals and the PS nanocolloids, and then dried in a vacuum oven at 50 °C overnight. The mole ratio of metal ions to ligands was fixed at 1.00. The mass ratio of PS nanocolloids to anhydrous metal ions was varied from 0 to 0.33. To support the analysis, several characterizations were conducted by using a scanning electron microscope (SEM) equipped with an energy dispersive X-ray (EDX) spectrometer (SU-70, Hitachi Co. Ltd., Japan), a powder X-ray diffractometer (PXRD, PANalytical X'Pert Pro), a Fourier transform infrared spectrometer (FTIR, Nicolet iS50, Thermo Scientific, US), a nitrogen sorption instrument (Autosorb iQ, Quantachrome Instruments), and a zeta potential analyzer (Zetasizer Nano ZS, Malvern Instruments Ltd.). To measure the particle size and size distribution, the dynamic light scattering (DLS) technique is often used.20 However, the DLS technique is generally good for measuring well-dispersed particles with a spherical shape. In this work, the Feret method21 was used to measure the particle size and size distribution of both PS spheres and MOF particles from the SEM images (see Fig. S2†). Detailed information of the Feret analysis is presented in ESI 2.†
Dramatic differences in morphologies and sizes of the MOF particles synthesized with and without using PS nanocolloids are observed. As shown in Fig. 2A, without using PS nanocolloids, only submicron MOFs with an average size of 167 nm were obtained, which are very similar to those synthesized using conventional bulk methods.11 The addition of PS nanocolloids into the precursor led to the generation of MOF nanoparticles (Fig. 2B and C). The mass ratios of 78 nm PS nanocolloids to metal ions of 0.13 (Fig. 2B), 0.20 (Fig. S3A†), and 0.33 (Fig. 2C) were effective to produce MOF nanoparticles with average sizes of 92, 71, and 48 nm, respectively, confirming the roles of the nanocolloid amount in the precursor suspension in controlling the final sizes of the MOFs. The size of the MOF nanoparticles can also be controlled through adjusting the size of the nanocolloids. As demonstrated in Fig. 2D, even smaller MOF nanoparticles (an average size of 35 nm) were obtained when using 31 nm PS nanocolloids.
 | ||
| Fig. 2 SEM images (A–D) and PXRD patterns (E) of MIL-100(Fe) nanoparticles prepared with various sizes and amounts of PS nanocolloids. (A)–(C) are the samples prepared with the mass ratios of PS nanocolloids (78 nm) to metal ions of 0 (without an additional colloid), 0.13, and 0.33, respectively. (D) is the sample prepared with the mass ratio of PS nanocolloids (31 nm) to metal ions of 0.33. (F)–(I) are the EDX elemental mapping analysis of the MOF nanoparticles (sample Fig. 2C) for the low-magnification SEM image, carbon, iron, and oxygen, respectively. Scale bars in A–D: 250 nm; F: 1 μm. | ||
The PXRD patterns (Fig. 2E and S3D†) of the MOF nanoparticles prepared with various amounts and sizes of PS nanocolloids are identical and in good agreement with the reference pattern for MIL-100(Fe).22 The well-distributed elements including carbon, oxygen, and iron in the prepared MOF nanoparticles were confirmed by EDX analysis (Fig. 2F–I). The results imply that the use of nanocolloids in the synthesis process does not substantially alter the crystalline structure of the MOFs.
The nitrogen sorption analysis showed that the MOF submicron particles (Fig. 2A) and nanoparticles (Fig. 2C) had the characteristic type-I adsorption/desorption patterns (Fig. 3A and B, respectively), indicating the existence of microporous nature in the prepared materials.23 The Brunauer–Emmett–Teller (BET) surface area of the MOF nanoparticles (an average size of 48 nm) is 1920 m2 g−1, which is larger than that of submicron particles (1617 m2 g−1) and those of previously reported MIL-100(Fe) materials.16a,b The pore size distributions of the samples (Fig. 3C) obtained using the density functional theory (DFT) method showed that the mean half-pore widths were 0.74 nm. Different intensities in the pore size distributions in both samples were detected, which are in good agreement with the analysis of the pore volumes. The pore volumes of the MOF submicron particles and nanoparticles were 0.875 and 1.028 cc g−1, respectively. The results confirmed that the PS nanocolloids did not alter the pore structures in the MOFs. Further, they bring advantages to form MOF nanoparticles with better textural properties, such as larger surface areas and higher porosities, in comparison with those of bulk counterparts.
 | ||
| Fig. 3 Nitrogen sorption analysis of (A) MOF submicron particles and (B) nanoparticles as well as (C) their pore size distribution analyzed using the DFT method. MOF submicron particles and nanoparticles were prepared using the same procedures as described in Fig. 2A and C, respectively. | ||
Analyses of the interactions among the PS colloid surfaces, ligands, and metal ions for the formation of MOF nanoparticles are presented in Fig. 4. The photograph and SEM images of the samples show that applying hydrothermal heating to the PS nanocolloids (Fig. 4A) led to the sedimentation and particle swelling phenomena (Fig. 4B). However, adding ligands into the PS colloidal suspension maintains the dispersing stability and sizes of the PS nanocolloids during the hydrothermal process (Fig. 4C). Ligands interact and attach on the surfaces of PS, preserving their sizes and dispersibility during the hydrothermal process. The attachment of ligands on the PS colloid surfaces was identified by the detection of shifting FTIR peaks (assigned at about 1240 and 1260 cm−1, corresponding to C–H-related peaks24) to higher wavenumber (Fig. 4D). Since the FTIR spectrum of the hydrothermally-treated PS nanocolloids with ligands corresponded to the standard individual patterns of original PS and ligands,17b,24 the interactions between the PS colloid surfaces and ligands are possibly due to inter/intra molecular hydrogen bonding.13a This is different from the reactions of ligands with other small organic molecules that created new FTIR peaks.25
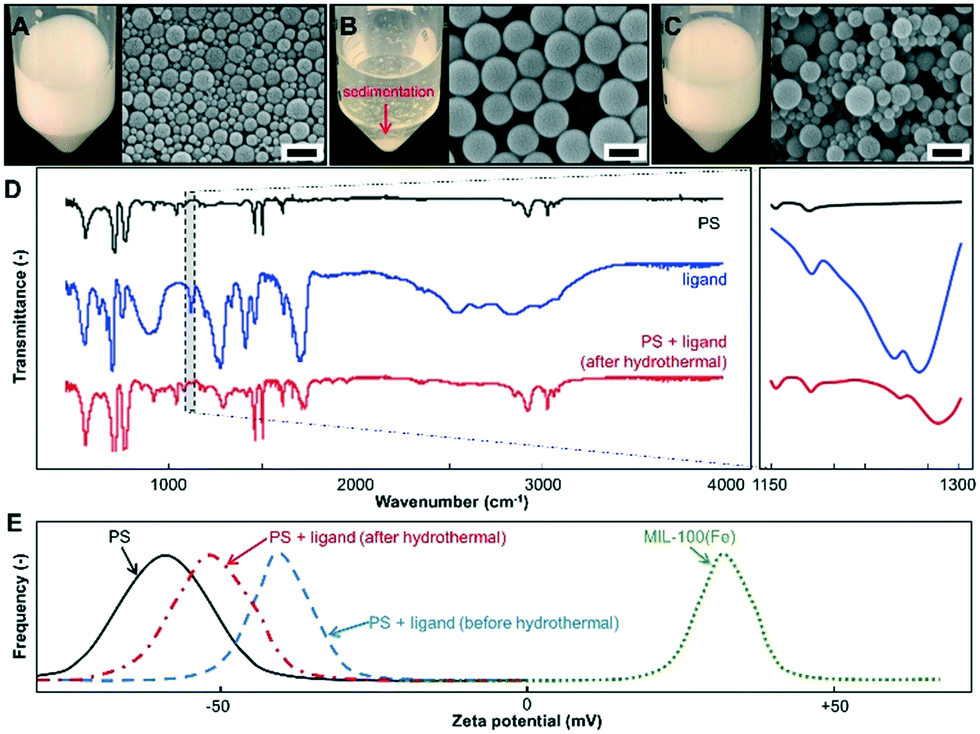 | ||
| Fig. 4 Photographs and SEM images of 78 nm PS before (A) and after the hydrothermal process without (B) and with additional ligands (C). FTIR spectra (D) and zeta potential measurement results (E) of samples containing PS nanocolloids, ligands, mixed PS nanocolloids and ligands (after the hydrothermal process), and submicron MIL-100(Fe) particles (synthesized using the same procedure in Fig. 2A). Scale bars in A–C: 200 nm. | ||
The zeta potentials (Fig. 4E) of the PS nanocolloids with and without ligands have the same charge sign, confirming that the interaction between the PS colloid surface and ligands did not involve attraction forces. Then, the zeta potential values of MIL-100(Fe) submicron particles (synthesized using the same procedure as described in Fig. 2A) and PS nanocolloids are of opposite signs, revealing that the diffusion of metal ions to the attached ligands on the PS colloid surfaces can be through a concentration gradient and electrostatic charge.
We also confirmed that to achieve successful production of MOF nanoparticles, the synthesis procedure must involve the attachment of ligands on the PS colloid surfaces followed by metal ion diffusion (as discussed in Fig. 1A). The change in sequences in the processing step in the experimental procedures will lead to the formation failure of MOF nanoparticles (see Fig. S3C and D†).
Conclusions
The present study demonstrates the use of a nanocolloid-assisted growth approach to synthesize MOF nanoparticles (i.e., MIL-100(Fe)) for the first time. PS nanocolloids as the model colloid are effective in providing growth sites for the controlled synthesis of MOF nanoparticles. Further, regulating the number of growth sites is effective to control the size of MOF nanoparticles. This work provides a novel strategy to synthesize MIL-100(Fe) nanoparticles, which can be further generalized to fabricate other MOF nanoparticles by addressing the persistent issues of poor control of nucleation and crystal growth rates in MOF synthesis by wet-chemical methods.Conflicts of interest
There are no conflicts to declare.Acknowledgements
This work is supported by the National Science Foundation (CMMI-1727553). A. B. D. N. acknowledges the Fulbright RISTEK DIKTI fellowship, and PTUPT, PSNI, and World Class Researcher (WCR) research grants from RISTEK DIKTI. We also acknowledge Prof. Sandro da Rocha and his group at Virginia Commonwealth University for helping with the zeta potential measurements.References
- Y. Chen, Z. Xiong, L. Peng, Y. Gan, Y. Zhao, J. Shen, J. Qian, L. Zhang and W. Zhang, ACS Appl. Mater. Interfaces, 2015, 7, 16338 CrossRef CAS PubMed.
- R. J. Kuppler, D. J. Timmons, Q.-R. Fang, J.-R. Li, T. A. Makal, M. D. Young, D. Yuan, D. Zhao, W. Zhuang and H.-C. Zhou, Coord. Chem. Rev., 2009, 253, 3042 CrossRef CAS.
- (a) U. Mueller, M. Schubert, F. Teich, H. Puetter, K. Schierle-Arndt and J. Pastre, J. Mater. Chem., 2006, 16, 626 RSC; (b) E. Haque, N. A. Khan, J. H. Park and S. H. Jhung, Chem. – Eur. J., 2010, 16, 1046 CrossRef CAS PubMed.
- J. L. Zhuang, D. Ceglarek, S. Pethuraj and A. Terfort, Adv. Funct. Mater., 2011, 21, 1442 CrossRef CAS.
- A. Carne, C. Carbonell, I. Imaz and D. Maspoch, Chem. Soc. Rev., 2011, 40, 291 RSC.
- (a) W. Chen and C. Wu, Dalton Trans., 2018, 47, 2114 RSC; (b) T. Simon-Yarza, A. Mielcarek, P. Couvreur and C. Serre, Adv. Mater., 2018, 30, 1707365 CrossRef PubMed; (c) S. Wang, C. M. McGuirk, A. d'Aquino, J. A. Mason and C. A. Mirkin, Adv. Mater., 2018, 30, 1800202 CrossRef PubMed; (d) S. Wuttke, M. Lismont, A. Escudero, B. Rungtaweevoranit and W. J. Parak, Biomaterials, 2017, 123, 172 CrossRef CAS PubMed.
- D. Chen, D. Yang, C. A. Dougherty, W. Lu, H. Wu, X. He, T. Cai, M. E. Van Dort, B. D. Ross and H. Hong, ACS Nano, 2017, 11, 4315 CrossRef CAS PubMed.
- M. Peller, K. Böll, A. Zimpel and S. Wuttke, Inorg. Chem. Front., 2018, 5, 1760 RSC.
- (a) R. Freund, U. Lächelt, T. Gruber, B. Rühle and S. Wuttke, ACS Nano, 2018, 12, 2094 CrossRef CAS PubMed; (b) M. Lismont, L. Dreesen and S. Wuttke, Adv. Funct. Mater., 2017, 27, 1606314 CrossRef.
- M. J. Van Vleet, T. Weng, X. Li and J. Schmidt, Chem. Rev., 2018, 118, 3681 CrossRef CAS PubMed.
- (a) M. Díaz-García, A. Mayoral, I. Diaz and M. Sánchez-Sánchez, Cryst. Growth Des., 2014, 14, 2479 CrossRef; (b) X. Gao, M. Zhai, W. Guan, J. Liu, Z. Liu and A. Damirin, ACS Appl. Mater. Interfaces, 2017, 9, 3455 CrossRef CAS PubMed.
- (a) J. Della Rocca, D. Liu and W. Lin, Acc. Chem. Res., 2011, 44, 957 CrossRef CAS PubMed; (b) W. J. Rieter, K. M. Pott, K. M. Taylor and W. Lin, J. Am. Chem. Soc., 2008, 130, 11584 CrossRef CAS PubMed.
- (a) D. Jiang, T. Mallat, F. Krumeich and A. Baiker, Catal. Commun., 2011, 12, 602 CrossRef CAS; (b) A. Ranft, S. B. Betzler, F. Haase and B. V. Lotsch, CrystEngComm, 2013, 15, 9296 RSC; (c) S. Diring, S. Furukawa, Y. Takashima, T. Tsuruoka and S. Kitagawa, Chem. Mater., 2010, 22, 4531 CrossRef CAS.
- X. Liu, J. Chem. Phys., 2000, 112, 9949 CrossRef CAS.
- A. B. D. Nandiyanto, T. Ogi, A. Ohmura, E. Tanabe and K. Okuyama, KONA Powder Part. J., 2011, 29, 141 CrossRef CAS.
- (a) X. Liu, Y. Zhou, J. Zhang, L. Tang, L. Luo and G. Zeng, ACS Appl. Mater. Interfaces, 2017, 9, 20255 CrossRef CAS PubMed; (b) Y. Jia, Q. Jin, Y. Li, Y. Sun, J. Huo and X. Zhao, Anal. Methods, 2015, 7, 1463 RSC; (c) A. Zimpel, T. Preiß, R. Röder, H. Engelke, M. Ingrisch, M. Peller, J. O. Rädler, E. Wagner, T. Bein and U. Lächelt, Chem. Mater., 2016, 28, 3318 CrossRef CAS; (d) P. Horcajada, T. Chalati, C. Serre, B. Gillet, C. Sebrie, T. Baati, J. F. Eubank, D. Heurtaux, P. Clayette and C. Kreuz, Nat. Mater., 2010, 9, 172 CrossRef CAS PubMed.
- (a) R. Ottewill and J. Shaw, Discuss. Faraday Soc., 1966, 42, 154 RSC; (b) A. Bhutto, D. Vesely and B. Gabrys, Polymer, 2003, 44, 6627 CrossRef CAS.
- K. Shen, L. Zhang, X. Chen, L. Liu, D. Zhang, Y. Han, J. Chen, J. Long, R. Luque and Y. Li, Science, 2018, 359, 206 CrossRef CAS PubMed.
- (a) H. J. Lee, W. Cho and M. Oh, Chem. Commun., 2012, 48, 221 RSC; (b) W.-T. Koo, S.-J. Choi, J.-S. Jang and I.-D. Kim, Sci. Rep., 2017, 7, 45074 CrossRef CAS PubMed; (c) A.-L. Li, F. Ke, L.-G. Qiu, X. Jiang, Y.-M. Wang and X.-Y. Tian, CrystEngComm, 2013, 15, 3554 RSC.
- P. Hirschle, T. Preiß, F. Auras, A. Pick, J. Völkner, D. Valdepérez, G. Witte, W. J. Parak, J. O. Rädler and S. Wuttke, CrystEngComm, 2016, 18, 4359 RSC.
- W. C. Hinds, Aerosol Technology: Properties, Behavior, and Measurement of Airborne Particles, Wiley, New York, 2nd edn, 1999 Search PubMed.
- A. Mahmood, W. Xia, N. Mahmood, Q. Wang and R. Zou, Sci. Rep., 2015, 5, 10556 CrossRef PubMed.
- X. He, Z. Gan, S. Fisenko, D. Wang, H. M. El-Kaderi and W.-N. Wang, ACS Appl. Mater. Interfaces, 2017, 9, 9688 CrossRef CAS PubMed.
- G. Mahalakshmi and V. Balachandran, Spectrochim. Acta, Part A, 2014, 124, 535 CrossRef CAS PubMed.
- Z.-Y. Wang, Y.-F. Luo, R.-R. Ye and X.-M. Song, J. Polym. Res., 2011, 18, 499 CrossRef CAS.
Footnotes |
| † Electronic supplementary information (ESI) available: (1) SEM images of the original PS nanocolloids, (2) particle size and size distribution analysis, and (3) effects of sizes/amounts of PS colloids and chemical adding sequences. See DOI: 10.1039/c9ce00033j |
| ‡ Equal contributions. |
| This journal is © The Royal Society of Chemistry 2019 |