 Open Access Article
Creative Commons Attribution 3.0 Unported Licence
Can macrocyclic phosphonate molecules inhibit barium sulfate crystallization?†
Tomoko
Radomirovic
b,
Mark I.
Ogden
 c,
Andrew L.
Rohl
 a and
Franca
Jones
 *c
*c
aCurtin Institute for Computation and School of Molecular and Life Sciences, Curtin University, GPO Box U1987, Perth WA, 6845 Australia
bChemistry, School of Molecular and Life Sciences, Curtin University, GPO Box U1987, Perth WA, 6845 Australia
cCurtin Institute of Functional Molecules and Interfaces, and School of Molecular and Life Sciences, Curtin University, GPO Box U1987, Perth WA, 6845 Australia. E-mail: F.Jones@curtin.edu.au; Tel: +618 9266 7677
First published on 22nd November 2018
Abstract
Macrocyclic compounds such as DOTP (1,4,7,10-tetraazacyclododecanetetrakis(methylenephosphonic acid)) and NOTP (1,4,7,-triazacyclononanetri(methylenephosphonic acid)) are found to inhibit precipitation of barium sulfate just as potently as their non-cyclic counterparts depending on the ionisation state of the molecule. Morphologically, DOTP has a more significant influence on the shape of barium sulfate particles formed than NOTP while turbidity results show that NOTP does not significantly affect the induction time observed, unlike DOTP, which does impact the induction time at higher concentrations. Overall, the inhibition of these macrocyclic compounds can be explained by the number of de-protonated phosphonate groups and is not significantly impacted by the presence of the ring. The presence of calcium ions during barium sulfate crystallization lowers the degree of inhibition for both NOTP and DOTP. Molecular modelling showed that an uncomplexed DOTP molecule could lattice match to the barium sulfate lattice but had fewer Ba⋯Ophos interactions than the equivalent non-macrocyclic molecule. The comparison of uncomplexed with complexed DOTP shows that the final configuration is similar for these two situations, thus in this case it is not the Ba⋯Ophos interactions but the overall replacement energy that is important.
Introduction
Scale is defined as the unwanted crystallization of a solid. In off-shore oil production, the combination of temperature and pressure changes and the mixing of aquifer and sea water commonly result in barium sulfate as a scale product.1–4 A great deal of effort has been invested to devise strategies for either removing or avoiding the formation of scale.3–7 One mode of tackling barium sulfate scale is to use an organic additive so that crystallization is inhibited to such a degree that the scale does not form. Some industrially used inhibitors are, for example, HEDP (hydroxyethylenediphosphonic acid5,8–10) and EDTP (ethylenediaminetetraphosphonic acid11–13). Previous literature has stated that DOTP (1,4,7,10-tetraazacyclododecanetetrakis-(methylenephosphonic acid)) would not be suitable as an inhibitor as it is a rigid molecule.7,14,15 While the term ‘rigid’ was not defined in this paper, the authors were referring to the decreased molecular flexibility once the molecule is in the complexed form. This limitation on movement is above and beyond the constraints that the initial ring structure would impart. The impact on crystal growth due to changes in ‘rigidity’ upon complexation has not yet been studied experimentally in detail. An advantage of macrocyclic compounds relative to acyclic analogues is that their coordination to metal ions is typically well defined in terms of structure and stoichiometry. Hence we decided to investigate the behaviour of some macrocyclic compounds as inhibitors, with an emphasis on quantifying the impact of complexation to a metal ion.Complexation of an additive with cations in solution can influence crystallization by impacting on the activity of the free cations, that is, by impacting supersaturation. For complexation to be effective, equivalent molar concentrations of the ligand to cation are often required to induce significant effects. This is in contrast to most ‘threshold’ inhibitors that influence crystallization significantly at very low levels (typically ppm levels or mM concentrations). However, this assumes that the complexed molecule has no interaction with the crystallization process. This assumption that complexing agents only interact by influencing activity has been shown to be erroneous in the case of ethylenediaminetetraacetic acid16 and oxalate.17 ‘Rigidity’ on the other hand is thought to decrease inhibition efficacy due to the ‘lattice matching’ hypothesis. This hypothesis proposes that a molecule requires a certain amount of flexibility to match the lattice spacings of the crystallizing solid.7,14,15 For example, nitrilotrimethylenephosphonic acid (NTMP) and 1,3,5-benzenetriphosphonic acid have recently been compared as inhibitors of barium sulfate, and it was found that the more flexible NTMP was more efficient (although neither additive impacted on crystal morphology under the conditions studied).18 In the case of stronger ionophores, complexation is reasoned to lead to a molecule less able to ‘lattice match’ and, therefore, less able to inhibit. However, data on this effect is lacking.
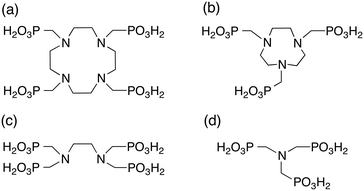
Here, we investigate the impact of macrocyclic molecules on crystallization and study the role of complexation in more detail. To do this, we have carried out experiments with the macrocycles DOTP and NOTP (1,4,7,-triazacycloheptanetri(methylenephosphonic acid)), and compared these results with their acyclic analogues EDTP, and NTMP (nitrilotrimethylenephosphonic acid). We also report computational results for DOTP and EDTP to probe the hypothesised mechanisms of inhibition (lattice matching) in more detail. Finally, the macrocyclic additives with and without calcium ions present are assessed for their inhibitory powers in an attempt to de-couple the impact of the flexibility of the additives from complexation effects. The structures of these additive molecules are shown in Fig. 1.
Methods and materials
The program PHREEQC19 was used to determine the molality and activity of ions for each experiment. The ion activity product (IAP) was calculated and the supersaturation index then defined as SI = log10(IAP/Ksp), where Ksp is the solubility product.Conductivity
Unseeded runs were conducted at 25 °C using conductivity (WTW LF 197 Conductivity meter) to monitor the crystallization in situ as previously described.20–22 The method consists of equilibrating 0.249 mM BaCl2 and adding the molar equivalent Na2SO4 solution to initiate crystallization. The total volume is kept constant at 201 mL and the graph of conductivity versus time is used to calculate kobs (observed de-supersaturation rate) by fitting the linear region of the de-supersaturation curve. The pH is kept constant at 6.5 by the addition of NaOH or HCl as required. Organic additives were added to the barium chloride solution prior to the addition of sulfate. Calcium chloride, when present, was also added to the barium chloride solution prior to the sulfate in order to allow complexation of the macrocycle to occur prior to the crystallization reaction. The concentration of calcium ions was kept constant at 2.5 mM. The de-supersaturation rate has been found to have an error of ∼10%.22The conductivity measures the mobile ions in solution, thus complexation of cations with the macrocyclic anions will alter the conductivity value compared to the value obtained in the absence of the macrocycle. However, the changes in the conductivity post addition and equilibration of the macrocyclic organic will be mainly due to the barium and sulfate ions coming together to crystallize.
Turbidity
The effect of the macrocyclic additives on the nucleation behaviour of barium sulfate during crystallization was determined by its impact on turbidity as in previous studies.23–25 The turbidity was measured by operating a UV-vis instrument (GBC, UV-vis 916 instrument) at 900 nm to limit absorption of light by the solution. The crystallization reaction, equilibrated at temperature, involved 200 mL ultrapure water, 0.5 mL barium chloride solution (0.1 M) and 0.5 mL sodium sulfate solution (0.1 M) stirred at 150 rpm with a two-pronged glass impellor. The macrocyclic solution (1 g L−1 stock solution) was added after the barium chloride and the amount of ultrapure water was adjusted to maintain a constant final volume. This solution was pumped through a flow-through quartz cuvette using a Masterflex® peristaltic pump and the absorbance reading through the cell monitored over time.The induction time (time taken for the turbidity to rise above zero) was determined at different additive concentrations. Induction time changes reflect nucleation rate changes, which in turn can give information about the surface free energy of the nuclei (in classical nucleating systems).26,27
SEM (scanning electron microscopy)
The barium sulfate solids were collected after conductivity runs, filtered onto 0.22 μm membranes and subsequently washed. After drying in a desiccator, a portion of the filter paper was placed onto a carbon-coated stub and gold sputtered prior to viewing in a Zeiss Evo instrument.Complexation
Conductivity was used to measure the degree of complexation using the reaction scheme below:L4− + 2Ba2+ ![[left over right harpoons]](https://www.rsc.org/images/entities/char_21cb.gif) Ba2L Ba2L | (1) |
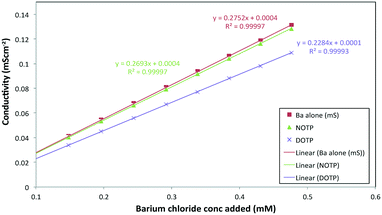 | ||
| Fig. 2 Conductivity versus barium ion concentration in the absence or presence of the ligands, DOTP (0.092 mM) and NOTP (0.097 mM). | ||
Molecular Modelling
The modeling was performed by using the previously reported empirical models for barium sulfate.12,28 For the macrocyclic organic molecules, the parameters used can be found in the supplementary information, the parameters were modified from CVFF forcefields as reported previously.9,29 The visualization software GDIS30 was used to construct 2D simulation cells and GULP31 was used to minimize their energy. The first step was to construct a supercell of barium sulfate large enough to accommodate the DOTP without there being interactions with neighbouring DOTP molecules due to the periodic nature of the system. Secondly, the slab was split into two regions; region I represents the surface and ions within it are able to move during minimization while region II represents the bulk and all ions in this region are fixed. The seven most stable faces of barium sulfate were simulated (including the two possible surface cuts of the (100) face, called a and b28). The number of phosphonate groups present on the organic dictated the number of sulfate groups removed from the surface (to maintain charge neutrality of the system as a whole) and many different configurations were trialled in an attempt to find the global minimum.For the complexed DOTP, the DOTP molecule was modeled with calcium in a binding position (i.e. able to interact with the phosphonate groups and the nitrogen atoms) and a sulfate was placed on the opposite side of the slab (for charge neutrality). The hydration energy for all molecules was calculated by utilizing the COSMIC continuum solvation model available in GULP,31,32 whereby it is assumed that the solvent behaves as a perfect conductor situated around a solvent accessible surface (SAS) around the ion of interest. The parameters required in the COSMIC model are:
(i) The dielectric constant of the solvent; for water this is 78.4.
(ii) The radius of water used to generate the solvent accessible surface; set to 1.4 Å, the radius shift of water was then set equal to this radius, as is widely done.
(iii) The number of points and segments per atom, which control the fineness of the SAS; set equal to 326 (a smoothing range of 0.2 Å was used to ensure continuous behavior of the energy surface).
(iv) The radii of the atoms (adjusted to reproduce the experimental solvation energies of the individual ions and the previously calculated solvation energy of EDTP28) resulting in the following radii: Ba 2.18 Å, Ca 1.81 Å, S 1.50 Å, N 1.58 Å, H 1.10 Å and O 1.75 Å.
The hydration energy values are listed in the supplementary section.
For each run, a replacement energy was calculated based on the following reaction:
| Bariteinitial + DOTP → Barite + DOTPadsorbed + 4SO42− | (2) |
Giving the following equation for the replacement energy, Erepl:
| Erepl = (FinalE + 4 × EhydrSulfate + 4 × Esulf) − (InitialE + EhydrDOTP + EDOTP) | (3) |
Results
Detailed results for the impact of EDTP and NTMP on the crystallisation of barium sulfate can be found in the literature.6,28 Only brief descriptions will be given here for the purpose of comparison.Conductivity
The de-supersaturation rates of barium sulfate in the presence of the two macrocyclic molecules generally decrease as their concentration increases (see Fig. 3). DOTP and NOTP appear to be similar in the efficacy of inhibiting crystallization overall. This is in contrast to the EDTP and NTMP de-supersaturation rates6,22,28 where EDTP strongly inhibits barium sulfate crystallization at very low levels and NTMP is found to be less potent as an inhibitor. In addition, it would appear that the DOTP molecule, despite having the same number of phosphonate groups as the EDTP molecule, is not as potent as the non-macrocylic counterpart in inhibiting barium sulfate crystallization. DOTP appears to have more of an impact at low concentrations and approaches the behaviour of NOTP and NTMP at higher concentrations. Interestingly, the NOTP is as efficacious as NTMP in inhibiting the crystallization of barium sulfate. The impact of the macrocycles is not due to their ability to complex barium ions (see supplementary information for calculations); firstly, the degree of complexation by NOTP is insignificant at these concentrations, thus reduced [Ba2+] activity cannot explain the inhibition observed and secondly, while the degree of complexation is greater for DOTP this results in a change of Ba2+ ion concentration of ∼16% at the highest concentration (as calculated from the Fig. 2 and the calculations shown in the ESI†). However, both DOTP and NOTP have similar inhibitory activity, implying that complexation does not determine this ability.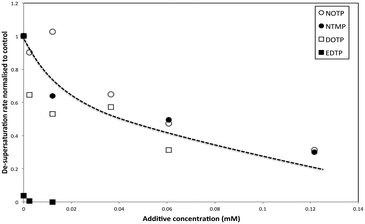 | ||
| Fig. 3 Normalized de-supersaturation rates of barium sulfate crystallization versus additive concentration. | ||
Calcium ions (2.5 mM), known to bind strongly with DOTP,33 were added to make the molecule more ‘rigid’. However, complexation will lower the amount of free DOTP and complexation of DOTP to barium ions is also expected to change the supersaturation. In order to account for all these phenomena, the DOTP speciation was calculated. Fig. 4 shows there is a majority of LH4 and LH5 species at pH 6.5 (where L is the fully deprotonated DOTP molecule). Thus, the ability of the LH5 and LH4 species to complex calcium (and, if possible, barium) must be considered.
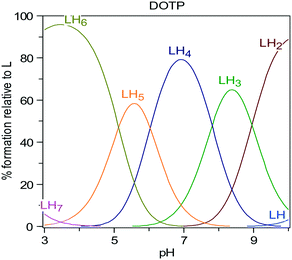 | ||
| Fig. 4 Speciation of L = DOTP8− with varying pH as calculated using the HySS2 program®.34 | ||
The complexation constants of DOTP with barium are not available but those for calcium have been reported.31Fig. 5a shows that the degree of DOTP complexed with calcium ions is ∼100%, in the LH2Ca2 form, with a simultaneous loss of ∼10% calcium ions from solution (Fig. 5b) if barium ions are ignored. At the highest DOTP concentration (0.09 mM) this is a reduction in calcium ions to 2.3 mM (from the original 2.5 mM). This was calculated to give a saturation index of 2.31 for the ‘control’ with calcium ions present, and 2.32 with the calcium ions complexed as determined by PHREEQC.19 Thus, the main influence of calcium ion complexation is the complete loss of free DOTP. The degree of complexation when barium ions were present was calculated by noting that complexation constants are at most two orders of magnitude lower for barium ions than for calcium ions (e.g. Ca-NTMP 7.86 and BaNTMP 6.34, from the JESS database35). Using the complexation constant calculations shown in the supplementary information and this ‘rule of thumb’, we believe we have overestimated the complexing ability with the barium ion. Calculations show when barium ions are present the DOTP prefers to bind calcium and only when the pH is >7 does interaction with barium ions become significant (see ESI†).
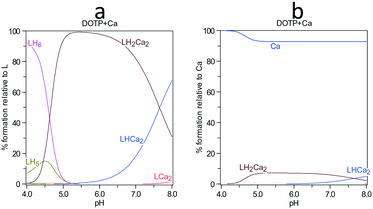 | ||
| Fig. 5 Calcium complexation with DOTP showing the species a) with respect to L = DOTP8− and b) with respect to calcium ions. | ||
Thus, the results when barium ion complexation is considered do not differ to those shown in Fig. 5. Given the speciation results, little if any changes in supersaturation are expected other than when more calcium is removed via complexation, the supersaturation increases slightly. The experimental results (Fig. 6) in the presence of calcium ions show that with increasing concentration of both DOTP and NOTP, the crystallization de-supersaturation rate is either static or increases with increasing macrocyclic concentration. One possible explanation for the change in inhibitory activity with DOTP concentration when calcium ions are present is that no free DOTP is left to inhibit, thus inhibition is commensurate with the concentration of free NOTP or DOTP remaining uncomplexed.
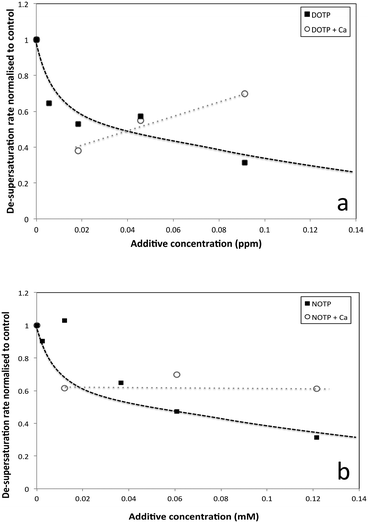 | ||
| Fig. 6 De-supersaturation rates (normalized) of barium sulfate crystallization in the presence of calcium ions (2.5 mM) and a) DOTP and b) NOTP at varying concentrations. | ||
If the degree of inhibition was related to the free DOTP concentration then since all of the DOTP is expected to complex with calcium (Fig. 5a), values close to that for the control, regardless of DOTP concentration, would be expected (i.e. values close to and around 1). However, this is not what is observed. Another possibility is that the decreasing calcium ion concentration (due to complexation) leads to a small increase in crystallization rate since the solubility of barium sulfate is dependent on ionic strength and thus decreases in calcium ion concentration can lead to increases in supersaturation. The SI was calculated to increase from 2.31 to 2.32 according to PHREEQC.19 The graph does show an increase in rate with increasing DOTP concentration when calcium ions are present but the value is not greater than the control value (i.e. >1) meaning that the supersaturation change is not the root cause of the trend observed. Thus, we would suggest that the complexed macrocycle is a less effective inhibitor than the uncomplexed macrocycle but still has some impact. One reason for this reduced impact is the proposed ‘rigidity’, however, another possible reason is that the complexed DOTP macrocycle interacts with the barium sulfate surface via fewer phosphonate groups (or a reduced overall charge) making the interaction weaker.
This concept was investigated further. Closer inspection of Fig. 4 shows that the speciation at pH 6.5 is LH4 and so an overall charge of −4 is expected. At pH 6.5 EDTP is expected to be in the LH3 state36 (implying an overall charge of −5), thus, one of the reasons why DOTP is less of an inhibitor than EDTP is its speciation. At pH 6.5 the triphosphonate NTMP is in the LH2 state.36 This means the charge for NTMP is also −4 overall and this could also explain the similarity between NTMP and DOTP inhibition. When calcium is added and the DOTP molecule is complexed with calcium, the overall charge is further reduced and may, therefore, lead to weaker interactions with the surface of barium sulfate and therefore be a weaker inhibitor.
Morphology
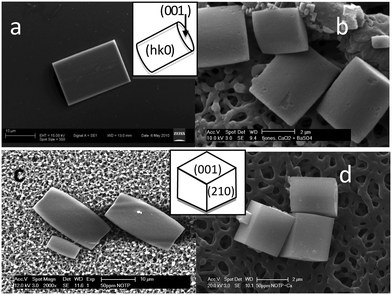
The morphology of pure barium sulfate particles at this supersaturation can be seen in Fig. 7a (schematic shows indexing of faces). The morphology of barium sulfate when calcium ions but no additives are present can be found in the literature20,21 and is presented in Fig. 7b. The barium sulfate particles have an aspect ratio that is close to 1:1 at 2.5 mM. At higher concentrations (25 mM), the morphology becomes diamond shaped.20 There was very little impact of NOTP on the morphology of the barium sulfate particles formed (Fig. 7c), suggesting an overall inhibition rather than an impact on specific faces. In contrast, NTMP had significant impacts on morphology,28 whereby NTMP induced the formation of round disc-like particles. NTMP, thus, adsorbed preferentially on particular faces of barium sulfate. A small c- axis lengthening is observed in the presence of NOTP suggesting that the growth of the (001) face is faster relative to other faces (Fig. 7c).Introduction of calcium ions (Fig. 7d) results in a barium sulfate particle with more pronounced (210) and (001) faces (schematic shows indexing of faces). While the presence of calcium is known to produce more diamond-shaped particles,20 the influence of calcium ions should be either (a) static if little change in the concentration of calcium ions is expected or (b) if most of the calcium ions are complexed and removed, the morphology should be more akin to that in the presence of NOTP alone (even though we have determined that NOTP complexation with barium ions is negligible the same may not be true with calcium). Neither of these scenarios is observed and the morphology appears to be dependent on the NOTP concentration. Thus, there appears to be a combined NOTP-Ca effect.
The presence of DOTP has a more pronounced impact on the barium sulfate morphology (Fig. 8) suggesting DOTP has a preference for particular barite faces. The presence of DOTP appears to inhibit the (011) face of barium sulfate, making it visible in the morphology (Fig. 8a and b). In addition, the particles appear quite flat suggesting an influence on the (100) face as well. There is also perhaps a small impact on the (010) face given the “thickness” of the particles visible when 0.05 mM DOTP has been added to the system. With increasing DOTP concentration, the particles become more rounded, flatter and eventually the (001) face disappears (Fig. 8c). The addition of calcium ions (Fig. 8d) results in barium sulfate particles that have a morphology that cannot be explained by the presence of calcium ions alone. As with NOTP, this is not a supersaturation effect, nor a free calcium effect but a combined calcium ion and DOTP effect. While the presence of calcium ions is known to inhibit the (001) face20,21 the particles do not show significant (001) faces. The presence of calcium ions in the presence of DOTP causes the square-like particles to be formed (Fig. 8d) that show the (011) rounding and the flat (100) faces seen with free DOTP. The main difference in the presence of calcium ions is that small (001) faces are still present. Thus, the impact of complexed DOTP is similar to that of free DOTP.
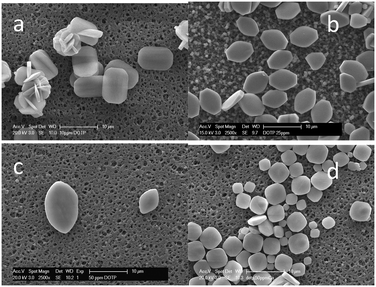 | ||
| Fig. 8 SEM images of barium sulfate particles formed in the presence of DOTP, (a) 0.02 mM, (b) 0.05 mM, (c) 0.10 mM, (d) 0.10 mM + Ca2+ (2.5 mM). | ||
What is of great interest here is that while the inhibitory efficacy of the DOTP and NOTP may be reduced when calcium is present, the impact on morphology is not diminished and, in the case of NOTP, enhanced.
Turbidity and induction times
Measuring the induction time via turbidity can give information about nucleation rates. Despite differences in the final turbidity value achieved (the turbidity is impacted by many things; including particle size, number and shape, and isotropy; and these factors cannot be de-coupled37,38), there is very little change in the induction time (the time when turbidity increases above background) of barium sulfate crystallization at low DOTP concentrations (9.1 μM) as can be seen in Fig. 9a. However, as the concentration increases to 18.2 μM the induction time becomes significantly longer. Assuming that this is a classically nucleating system and that no significant complexation between the Ba2+ ion and DOTP is occurring, this would suggest a nucleation rate decrease and, therefore, a surface free energy increase for the critical nuclei.26,27 For the system with NOTP present, the induction time changes even less and the impact on nucleation appears minimal. The turbidity observed for barium sulfate crystallization in the presence of 60.5 μM NOTP was identical to that at 24.3 μM NOTP and is not shown. This suggests that NOTP has a weaker interaction with barium sulfate nuclei than DOTP.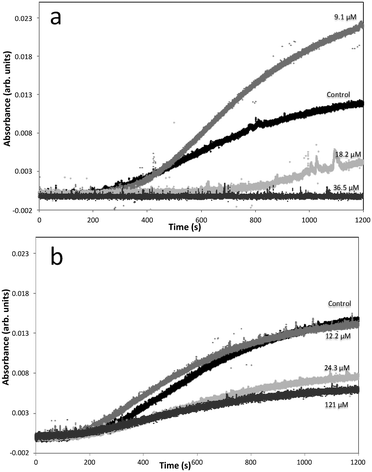 | ||
| Fig. 9 Turbidity curves for barium sulfate in the presence of different (a) DOTP and (b) NOTP concentrations. | ||
Modelling of EDTP and DOTP adsorption onto barium sulfate
The replacement energy (to replace four sulfate ions with one organic additive) is presented in Table 1 for the molecules EDTP, DOTP and the complexed DOTP with calcium (and sulfate ion to maintain a charge neutral model).| Face | EDTP | DOTP | Complexed DOTP |
|---|---|---|---|
| 001 | −1843.4 | −1384.3 | −155.7 |
| 210 | −1711.0 | −1283.8 | −115.3 |
| 211 | −2053.8 | −1558.0 | −367.0 |
| 020 | −2014.9 | −1375.1 | −585.7 |
| 011 | −1800.3 | −1685.6 | −615.1 |
| 101 | −1573.4 | −1573.1 | −427.5 |
| 100b | −1710.4 | −1705.9 | −355.7 |
| 100a | −2273.8 | −2246.3 | −957.3 |
| Av Erepl | −1872.6 | −1643.4 | −447.4 |
From the table above, the lowest replacement energies for the two additives adsorbed on each of the faces are:
The primary difference between the ranking of the replacement energies between EDTP and DOTP is that EDTP has several faces with a low replacement energy of ≃2000 kJ mol−1 while only one face has such a low replacement energy when DOTP is present. This makes the average replacement energy more negative for EDTP than for DOTP. Based on the replacement energy considerations then, the EDTP molecule should be a better inhibitor. Thus, even if the DOTP had the same speciation as EDTP, the replacement energy predicts weaker inhibition in the presence of DOTP. The DOTP on the other hand appears to have a more face-specific interaction, whereby the replacement energy is much more negative on the (100a) face compared to the other faces compared to the behaviour of EDTP. If the DOTP is complexed with Ca ions the replacement energy is less negative again, with all replacement energies ≤|1000| kJ mol−1. Looking at the preferred faces according to the replacement energies, it is found that
Similar faces are preferred by the complexed molecule compared to the uncomplexed molecule, the main difference being the impact on the (100b) face for the uncomplexed DOTP is significantly reduced when complexed. The replacement energy of complexed DOTP is significantly more positive than its uncomplexed form and this compares well to the observed reduced inhibition compared to free DOTP. Clearly, the modelling is predicting the correct trend in the strength of interaction between the surfaces of barium sulfate and the organic molecules.
Turning to the predicted morphological impacts of DOTP (and complexed DOTP), we see that the (100) faces and the (011) face are those with the lowest replacement energies thus, we would expect these faces to be seen in the morphology when DOTP is present. This is indeed observed experimentally for both the free DOTP (Fig. 8b) and the complexed DOTP (Fig. 8d). There is a dominant, flat (100) face and the (011) face appears in both cases.
To get a better idea of why the EDTP molecule has a lower replacement energy than the DOTP molecule, the components of the final energy can be examined (the (001) face was chosen to reflect an intermediate replacement energy) in Table 2.
| EDTP | Free DOTP | |
|---|---|---|
| Interatomic potentials | −881649.4 | −881672.6 |
| Three-body potentials | 1979.0 | 2114.1 |
| Four-body potentials | 27.0 | 52.1 |
| Monopole–monopole (total) | −1343541.2 | −1342957.5 |
| Solvation energy | −7896.8 | −7489.1 |
| Energy of molecule (gas) | 5038.1 | 4890.6 |
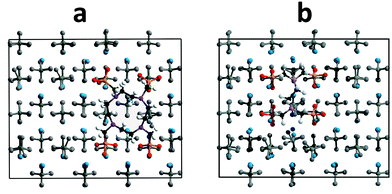
From this list of interactions it is clear that the interatomic interactions are very similar, ∼23.2 kJ mol−1 difference. The three and four body terms are more positive for free DOTP suggesting more energy (max difference of ∼135 kJ mol−1) is required to achieve conformational changes. Finally, perhaps surprisingly, the Coulombic/charge interactions are different for the two (monopole–monopole), being more negative for EDTP than free DOTP (by about ∼584 kJ mol−1). This suggests that the EDTP is able to interact with the barium ions in the surface more effectively than the free DOTP and this is the root cause of the more negative replacement energy (the solvation energy difference and the energy of the initial molecule combined contribute ∼260 kJ mol−1 energy difference in DOTP's favour rather than EDTP). This may, in turn, be related to the more constrained configuration of the free DOTP (particularly the ring structure) whereby it will be less able to change its conformation to align the phosphonate groups in the ideal position to interact with barium ions as evidenced by the difference in the three and four body potentials. As can be seen in Fig. 10, the free DOTP is seen to ‘lattice match’ well with the sulfate positions – that is the free DOTP phosphonate groups can sit in the vacant sulfate positions just as EDTP can – thus based on this criterion both molecules should be good inhibitors. However, this is insufficient to determine the degree of inhibition, a better criterion is the number of Ba⋯Ophos interactions, which can be defined as the number of Ba⋯Ophos distances that are 2.4 Å or less. There are fewer of these interactions for free DOTP than EDTP (12 compared to 14) and would explain the smaller Coulombic term for DOTP. This is mainly due to the inability of the ring to rotate the phosphonate groups in the appropriate plane, which would increase the number of Ba⋯Ophos interactions.
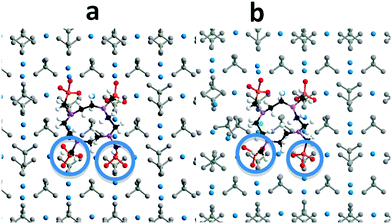
Finally, one last comparison can be made. For complexed DOTP, the number of Ba⋯Ophos interactions can be compared to the free DOTP on the same face (Fig. 11). Firstly, on the (100a) face the number of Ba⋯Ophos interactions is significantly greater than on the (001) face shown in Fig. 10. The number of Ba⋯Ophos distances less than 2.4 Å is 16 for the free DOTP (and for EDTP), while it is 15 for the complexed DOTP on this face.
The changes in adsorbed conformation between the free and complexed DOTP are small. For the most part, the phosphonate groups are interacting similarly with the (100a) face for the free and the complexed DOTP (shown in Fig. 11). The two bottom phosphonates show small differences in the rotation of the phosphonate groups, which diminishes the number of Ba⋯Ophos interactions slightly. In this case the degree of inhibition is not so much related to the number of Ba⋯Ophos interactions that can be formed but to the other factors such as the solvation energy and initial energy of the complexed DOTP. The number of Ba⋯Ophos interactions was found to be similar for free and for complexed DOTP on all the faces studied.
Conclusions
We show that macrocyclic compounds such as DOTP and NOTP are additives that can inhibit precipitation and are sometimes just as potent as non-macrocyclic equivalents (e.g. NOTP c/f NTMP). The important factor in determining inhibition appears to be the ionisation state of the functional groups, the more deprotonated the phosphonate groups are the more potent they are as inhibitors. NOTP has very little impact on barium sulfate morphology while DOTP has a greater influence showing rounding of particles and the presence of (011) faces. This impact is increased when calcium ions are present in the case of NOTP. The morphology in the presence of the two macrocycles is a synergistic impact of the organic molecule and calcium ions that is not related to impacts on the supersaturation.Turbidity results support the idea that NOTP is more weakly interacting with barium sulfate nuclei than DOTP, with NOTP not significantly affecting the induction time observed. DOTP, on the other hand, does impact the induction time at higher concentrations only.
Investigation into why the DOTP macrocyclic additive is a weaker inhibitor followed. It was found that DOTP can complex barium ions in solution but has little impact on the supersaturation. Thus, complexation to barium ions cannot be the cause. The de-protonation state of the phosphonate is an important parameter in determining the inhibitory efficacy. Complexation to calcium ions should result in no free DOTP being present, thus the inhibitory impact of DOTP should be negated in the presence of calcium ions. This is not observed. The impacts of the macrocyclic additive lessens when calcium ions are present but does not disappear. Thus, complexed molecules can also be inhibitors.
In order to fully understand these impacts, molecular modelling was undertaken. This showed that a free DOTP ion can ‘lattice match’ the sulfate positions as well as EDTP but that the number of barium ion interactions with the oxygen atoms on the phosphonate groups is less for DOTP than EDTP due to the constrained nature of the ring. The replacement energy differences for DOTP and EDTP are mainly related to the Coulombic interactions that are significantly greater for EDTP than DOTP. More importantly, it was found that complexed DOTP still can interact with the barium sulfate surface albeit with a more positive replacement energy, supporting the results that complexed DOTP still has some inhibiting properties. In addition, the modelling predicts the morphological significance of the (100) and (011) faces both for the free and complexed DOTP. Thus, when ionisation state of the molecules is equivalent, the number of interactions between the cation and the additive anion is important. The interactions do not change significantly on complexation with calcium and in this scenario the solvation energies and initial energies of the molecules impacts the overall replacement energy. By combining molecular modelling with the calculation of replacement energies, the relative inhibitory efficacy was able to be correlated to the magnitude of the replacement energy.
Conflicts of interest
There are no conflicts to declare.Acknowledgements
This work was supported by computational resources provided by the Australian Government through the Pawsey Centre under the National Computational Merit Allocation and the Pawsey Partner schemes. We would also like to acknowledge the John de Laeter Centre, Curtin University for use of the SEM facilities (ARC LE0775553).References
- M. S. H. Bader, J. Pet. Sci. Eng., 2007, 55, 93 CrossRef CAS.
- M. S. Kamal, I. Hussein, M. Mahmoud, A. S. Sultan and M. A. S. Saad, J. Pet. Sci. Eng., 2018, 171, 127 CrossRef CAS.
- W. J. Benton, I. R. Collins, I. M. Grimsey, G. M. Parkinson and S. A. Rodger, Faraday Discuss., 1993, 95, 281 RSC.
- S. Kumar, T. K. Naiya and T. Kumar, J. Pet. Sci. Eng., 2018, 169, 428 CrossRef CAS.
- D. A. Maffra, T. C. Freitas, G. F. da Cruz, F. D. Siqueira and F. F. do Rosario, Ind. Eng. Chem. Res., 2018, 57(34), 11493 CrossRef CAS.
- E. Barouda, K. D. Demadis, S. R. Freeman, F. Jones and M. I. Ogden, Cryst. Growth Des., 2007, 7, 321 CrossRef CAS.
- D. Bosbach, P. V. Coveney, J. L. W. Griffin, A. Putnis, P. Risthaus, S. Stackhouse and A. Whiting, J. Chem. Soc., Perkin Trans. 2, 2002, 2, 1238 RSC.
- C. Garcia, G. Courbin, F. Ropital and C. Fiaud, Electrochim. Acta, 2001, 46, 973 CrossRef CAS.
- M. Nygren, D. Gay, C. Catlow, M. Wilson and A. Rohl, J. Chem. Soc., Faraday Trans., 1998, 94, 3685 RSC.
- G. M. Van Rosmalen and M. C. Van der Leeden, Cryst. Res. Technol., 1982, 17, 627 CrossRef CAS.
- K. Dunn and T. Yen, Environ. Sci. Technol., 1999, 33, 2821 CrossRef CAS.
- F. Jones and A. L. Rohl, Mol. Simul., 2005, 31, 393 CrossRef CAS.
- S. Prostakov, B. Driker, S. Rempel and N. Belyaeva, Crystallization of barium sulfate, Deposited Doc. (SPSTL 339 khp-D81), USSR, 1981 Search PubMed.
- P. V. Coveney, R. J. Davey, J. L. W. Griffin, Y. He, J. D. Hamlin, S. Stackhouse and A. Whiting, J. Am. Chem. Soc., 2000, 122, 11557 CrossRef CAS.
- R. Davey, S. Black, L. Bromley, D. Cottier, B. Dobbs and J. Rout, Nature, 1991, 353, 549 CrossRef CAS.
- F. Jones, P. Jones, M. I. Ogden, W. R. Richmond, A. L. Rohl and M. Saunders, J. Colloid Interface Sci., 2007, 316, 553 CrossRef CAS PubMed.
- F. Jones, T. Radomirovic and M. I. Ogden, J. Cryst. Growth, 2018, 498, 148 CrossRef CAS.
- E. D. Athanasopoulos, E. Armakola, P. G. Koutsoukos and K. D. Demadis, CrystEngComm, 2018, 20, 6589 RSC.
- D. L. Parkhurst and C. A. Appelo, Users guide to PHREEQC (version 2) - a computer program for speciation, batch reaction, one dimensional transport, and inverse geochemical calculations, U.S. Geological Survey Water-Resources Investigation Report, 1999 Search PubMed.
- F. Jones, A. Oliviera, G. M. Parkinson, A. L. Rohl, A. Stanley and T. Upson, J. Cryst. Growth, 2004, 270, 593 CrossRef CAS.
- F. Jones, A. Oliviera, G. M. Parkinson, A. L. Rohl, A. Stanley and T. Upson, J. Cryst. Growth, 2004, 262, 572 CrossRef CAS.
- F. Jones, A. Oliviera, A. L. Rohl, G. M. Parkinson, M. I. Ogden and M. M. Reyhani, J. Cryst. Growth, 2002, 237-239, 424 CrossRef CAS.
- A. Baynton, M. I. Ogden, C. L. Raston and F. Jones, CrystEngComm, 2012, 14, 1057 RSC.
- T. Radomirovic, P. Smith and F. Jones, Int. J. Miner. Process., 2013, 118, 59 CrossRef CAS.
- A. Baynton, T. Becker, B. D. Chandler, F. Jones, M. I. Ogden, T. Radomirovic and G. K. H. Shimizu, CrystEngComm, 2011, 13, 1090 RSC.
- J. W. Mullin, Crystallization, Butterworth-Heinemann Publishers Ltd, London, 1993 Search PubMed.
- O. Söhnel and J. W. Mullin, J. Colloid Interface Sci., 1988, 123, 43 CrossRef.
- F. Jones, W. R. Richmond and A. L. Rohl, J. Phys. Chem. B, 2006, 110, 7414 CrossRef CAS PubMed.
- M. P. Wilson, A. L. Rohl, A. J. McKinnon and J. D. Gale, “An experimental and molecular modelling investigation into the inhibition of gypsum crystallization by phosphonate additives” Proceedings of the 14th International Symposium on Industrial Crystallization, Sept 1999 Search PubMed.
- A. L. Rohl, Z. Kristallogr., 2005, 22, 580 Search PubMed.
- J. D. Gale and A. L. Rohl, Mol. Simul., 2003, 29, 291 CrossRef CAS.
- J. D. Gale and A. L. Rohl, Mol. Simul., 2007, 33, 1237 CrossRef CAS.
- L. C. Sepini, N. V. Jarvis, D. R. Jansen and J. R. Zeevaart, Anal. Chim. Acta, 2012, 730, 66 CrossRef CAS PubMed.
- L. Alderighi, P. Gans, A. Ienco, D. Peters, A. Sabatini and A. Vacca, Hyperquad simulation and speciation (HySS): a utility program for the investigation of equilibria involving soluble and partially soluble species, Coord. Chem. Rev., 1999, 184, 311 CrossRef CAS.
- P. May and K. Murray, Joint Expert Speciation System (JESS), online data base of constants found at http://jess.murdoch.edu.au/jess_home.htm, accessed 24th April 2018 Search PubMed.
- F. Jones, A. Stanley, A. Oliviera, A. L. Rohl, M. M. Reyhani, G. M. Parkinson and M. I. Ogden, J. Cryst. Growth, 2003, 249, 584 CrossRef CAS.
- V. Tantayakom, T. Sreethawong, H. S. Folger, F. F. de Morales and S. Chavadej, J. Colloid Interface Sci., 2004, 284, 57 CrossRef PubMed.
- H. H. Kleizen, A. B. de Putter, M. van der Beek and S. J. Huynink, Guolu Yu Fenli, 1995, 32(9), 897 CAS.
Footnote |
| † Electronic supplementary information (ESI) available. See DOI: 10.1039/c8ce01869c |
| This journal is © The Royal Society of Chemistry 2019 |

