Dual amplification ratiometric biosensor based on a DNA tetrahedron nanostructure and hybridization chain reaction for the ultrasensitive detection of microRNA-133a†
Liping
Zhu
a,
Jing
Ye
a,
Shuang
Wang
ab,
Mengxia
Yan
ab,
Qiuju
Zhu
a,
Jianshe
Huang
 *b and
Xiurong
Yang
 *ab
*ab
aDepartment of Chemistry, University of Science and Technology of China, Hefei, Anhui 230026, P. R. China
bState Key Laboratory of Electroanalytical Chemistry, Changchun Institute of Applied Chemistry, Changchun, Jilin 130022, China. E-mail: xryang@ciac.ac.cn; huangjs@ciac.ac.cn
First published on 30th August 2019
Abstract
A novel ratiometric electrochemiluminescence (ECL)–electrochemical (EC) hybrid biosensor with a high accuracy and reproducibility was fabricated for the ultrasensitive detection of miRNA-133a. With the help of a DNA tetrahedron nanostructure and hybridization chain reaction dual amplification strategy, the detection limit of 12.17 aM for miRNA-133a was obtained.
MicroRNA-133a (miRNA-133a) has been regarded as a potential biomarker of acute myocardial infarction (AMI).1 When an acute myocardial infarction occurs, especially in the early stage of the disease, the concentration of miRNA-133a in the blood usually increases dramatically.2 Therefore, the specific and sensitive detection of miRNA-133a is of great significance for the early diagnosis and treatment of AMI. However, due to their trace amounts in tissues and cells, small size and high similarity in sequence, more accurate and sensitive methods are required for the detection of miRNAs.3 Until now, many strategies and techniques have been developed for the determination of miRNAs such as surface-enhanced Raman scattering (SERS),4 fluorescence,5 ECL6 and electrochemistry.7 Among them, ECL biosensors are one of the most powerful bioanalysis platforms to assay miRNAs owing to their simple equipment requirements, high sensitivity and short response time.
In the ECL system, a ratiometric ECL biosensor is a relatively new ECL detection method and has attracted increasing research interest due to its high detection accuracy.8 ECL ratiometry is based on the ratio of two signals rather than a single signal for quantitative analysis. Therefore, the positive or negative errors can be reduced, thus making the detection more reliable.9 Until now, the reported ECL ratiometry is mainly based on two ECL signals (for example, the potential-resolved10 and the wavelength-resolved ratiometric biosensors11). Significantly, a ratiometric detection strategy that is different from relying on two luminescent signals, but based on the ratio of ECL and electrochemical (EC) signals has emerged in recent years.12 This ECL–EC ratiometric method not only has the typical advantages of high accuracy of the ECL ratiometric biosensor, but also can reflect the real-time state of the electrode surface and improve the repeatability of the system.
Besides accuracy, sensitivity is also an important parameter for biosensors, especially for the biosensors targeting low-abundance miRNAs in biological samples. Optimizing the probe immobilization and/or adopting efficient signal amplification methods are usually used to improve the sensitivity.13 Because the crowding effect, irregular distribution and cross reactions of probes on the electrode surface can negatively affect the stability and sensitivity of the sensor,14 various optimized probe immobilization methods have been developed. Recently, DNA tetrahedron nanostructures (DTNs), owing to their advantages of simple synthesis, high rigidity and well-defined sizes and shapes, have been applied to immobilize probes and construct excellent biosensing platforms.15 The well-ordered structure and high stability of DTN, could improve the biorecognition efficiency and reduce the nonspecific adsorption of biomolecules on the electrode surface.16 For the signal amplification strategies, enzyme-assisted amplification,17 rolling circle amplification (RCA)18 and hybridization chain reaction (HCR)19 usually can provide satisfactory amplification effects in biosensors. In particular, HCR is an isothermal enzyme-free amplification technology with high amplification efficiency, which is widely used for highly sensitive detection in biological analysis.20
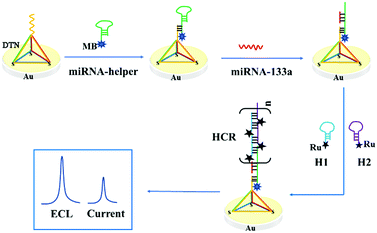
Based on the above consideration, a novel and elaborate ECL–EC ratiometric biosensor based on a DNA tetrahedral platform and HCR amplification was fabricated for detecting miRNA-133a (Scheme 1). In this strategy, the three vertices of the DTN with thiol groups can be highly ordered, assembled on the surface of the gold electrode (GE) through Au–S bonds, while the other vertex had an additional capture sequence. Two Ru(bpy)32+-labeled hairpins (H1 and H2) were used as ECL probes and fuel strands for HCR. Given the short length of miRNA-133a, a hairpin DNA (miRNA-helper) was elaborately designed, in which a linear sequence of 25 nucleotides at the 5′ end can complement to the capture sequence of the DTN. Furthermore, the 5′ end of the miRNA-helper was tagged with methylene blue (MB), and its electrochemical signal was used as an internal reference signal. The loop of the miRNA-helper was designed to pair with the sticky end at the 3′ end of H1, and the sequence from the loop to the 3′ end of the miRNA-helper was used as a trigger strand for HCR. When the miRNA-133a was present in the solution, it hybridized with the miRNA-helper and opened the hairpin structure, subsequently triggering an HCR to obtain an amplified ECL signal of Ru(bpy)32+. The ECL signal enhanced with the increase of the miRNA-133a. However, the EC signal of MB was independent of the concentration of the target miRNA but reflected the real-time state of the electrode surface. Therefore, by measuring the ratio of ECLRu/currentMB, the quantitative analysis of the miRNA-133a with high accuracy and reproducibility can be obtained. Besides, using the stem-loop structure of the miRNA-helper to capture the target enhanced the specificity of the biosensor.
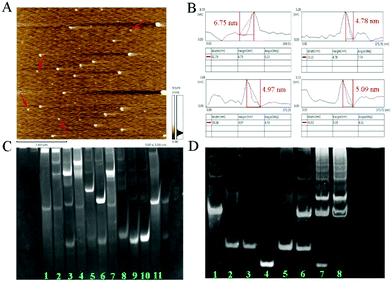
As shown in Fig. 1A, the AFM image exhibits the well-dispersed DTN. The height distribution of DTN ranged from 4.78 nm to 6.75 nm (Fig. 1B), which was close to the theoretical height of 5.02 nm and theoretical side length of 6.12 nm.12a Native polyacrylamide gel electrophoresis (PAGE) was also used to confirm the successful preparation of the DTN. As shown in Fig. 1C, the migration rate of the hybrid products (lane 1 and 2) of S1, S2, S3 and S4 is much slower than that of any single DNA strand (lane 8–11), and other combinations of two or three sequences (lane 3–7). These results suggested that the DNA tetrahedron nanostructure was assembled successfully. PAGE was also performed to verify the success of HCR. As shown in Fig. 1D, the clear bands from lane 1 to 4 correspond to the miRNA-helper, H1, H2 and miRNA-133a, and their migration rates are consistent with their molecular sizes. When the miRNA-133a is incubated with miRNA-helper and H1 + H2 mixture, a series of stripes with higher molecular weight were observed (lane 7 and 8), indicating that a cascade of hybridization events was triggered. These results solidly confirmed the rational design of the DNA sequences, which can successfully conduct the HCR. In addition, the PAGE image of the tetrahedron after HCR showed that the double stranded DNA has expanded upon miRNA binding (Fig. S1, ESI†).
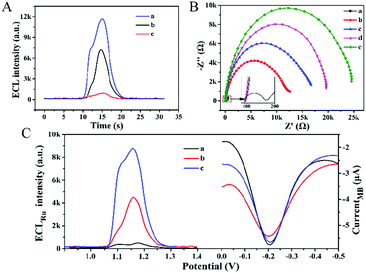
Due to the uniform distribution of DTN on the electrode surface and the well-defined size, each capturing probe was distributed at a specific nanoscale distance, thereby reducing the hindrance effect. The above characteristics of the DTN platform are expected to enhance the recognition and hybridization efficiency of nucleic acid molecules, and subsequently enhance the ECL signal of the biosensor. In order to confirm the enhancement effect of the DTN platform, thiolated S1 strands (S1*) were directly assembled on the electrode surface (S1*/GE) to anchor the miRNA-helper. As shown in Fig. 2A, the ECL intensity of the biosensor using the DTN platform (curve a) is stronger than that of S1*/GE (curve b), indicating that the DTN platform indeed enhanced the hybridization efficiency. In addition, the remarkable amplification effect of HCR on the ECL signal also can be seen from Fig. 2A; the ECL signal of the proposed biosensor (curve a) is nearly 10 times that of the biosensor using H1 as the signal probe alone (curve c). The dual amplification of ECL signals based on the DTN and HCR ensured the ultra-high sensitivity of the constructed biosensor.
As shown in Fig. 2B, the assembly of the ECL–EC ratiometric biosensor was characterized by EIS. After the DTN (curve b), miRNA-helper (curve c), miRNA-133a (curve d) and H1 + H2 mixture (curve e) were successively modified on the GE surface, the electron-transfer resistances showed an increasing trend due to the repulsive interaction between the negatively charged nucleic acid molecules and the redox probe of [Fe(CN)6]3−/4. This result suggested that the biosensor was successfully constructed.
In order to verify the feasibility of the ratiometric detection strategy, the ECL response and EC signal were measured at different miRNA-133a concentrations (Fig. 2C). In the absence of miRNA-133a, the ECL signal was quite weak (curve a), while the SWV signal of MB appeared at about −0.2 V with the peak current of 3.2 μA. When 1 fM of the target was added to the system, a strong ECL signal was obtained (curve b), and the ECL intensity further enhanced when the concentration of the target increased to 100 fM (curve c). However, the electrochemical signals changed a little (≤5.03%) due to the changes of the state of the electrode surface. These results indicated that the EC signal was independent of the target and could reflect the real situation of the electrode surface, while the intensity of the ECL depended on the concentration of the miRNA-133a. Therefore, quantitative analysis with the ratio of ECLRu/currentMB can reduce the measurement errors caused by the changes of electrode surface states and improve the reproducibility of detection.
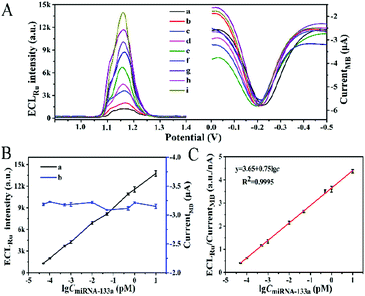
The analytical performance of the proposed biosensor for miRNA-133a was investigated under the optimal conditions: 1.5 μM miRNA-helper, 75 min incubation time for miRNA-helper and miRNA-133a and 90 min for HCR (ESI,† Fig. S2). As shown in Fig. 3A and B, the ECL intensity of Ru(bpy)32+ gradually enhanced with the miRNA-133a concentration increasing from 50 aM to 10 pM, while the current signal of MB at about −0.2 V changed slightly. The calibration curve showed a good linear correlation between the ratio of ECLRu/currentMB and logarithm of miRNA-133a concentration (Fig. 3C). The corresponding correlation coefficient (R2) was 0.9995 and the limit of detection (LOD) was 12.17 aM (S/N = 3). Compared with previously reported methods for miRNA detection, our biosensor showed a lower detection limit (Table S2, ESI†). This result suggested that the proposed dual amplification ECL–EC ratiometric biosensor based on DTN and HCR exhibited high sensitivity and favorable potential application for the detection of miRNA-133a.
The selectivity was investigated by measuring the response of the ECL–EC ratiometric biosensor to miRNA-133a and other three interference miRNAs associated with AMI (miRNA-499a, miRNA-208b and miRNA-328) (Fig. 4A). Under the same conditions, the ECLRu/currentMB ratios of the three interferences (bars b–d) were similar to that of the blank (bar a), and were much smaller than that of the miRNA-133a (bar e). This result suggested that the constructed ECL–EC ratiometric biosensor had a good selectivity for the detection of miRNA-133a. Furthermore, when 17 cycles of continuous potential scanning were performed for assaying 400 aM miRNA-133a (Fig. 4B), the relative standard deviation (RSD) of the ECL signals was 2.51%, indicating its excellent stability. Reproducibility of the proposed biosensor was studied by detecting 10 fM miRNA-133a with six electrodes (Fig. 4C), and the RSD of the ECLRu/currentMB responses was 1.72%, suggesting the outstanding fabrication repeatability of this biosensor.
To investigate the practical application of the proposed strategy, different concentrations of miRNA-133a were injected into 2.5% (v/v), 10% (v/v), and 15% (v/v) human serum and detected by the biosensor. Satisfactory recoveries (99.07–104.1%) and RSD (0.78–2.91%) were obtained (Table S3, ESI†), indicating the promising potential of the constructed ratiometric biosensor for detecting miRNA-133a in actual human serum.
In conclusion, we have successfully constructed a fascinating ECL–EC ratiometric system with the following characteristics: (i) ECL responses depended on the miRNA-133a while the EC signal was independent of the target but reflected the real-time state of the electrode surface, which enabled the detection of miRNA-133a with high accuracy and convincing results. (ii) The DTN could reduce the hindrance effect of probes and improve the hybridization efficiency of nucleic acid molecules, which, together with the high amplification efficiency of HCR, resulted in a dual amplification effect on ECL signal, thus realizing the ultrasensitive detection of miRNA-133a. (iii) The elaborately designed miRNA-helper for capturing the miRNA-133a improved the specificity of the biosensor. (iv) The feature of the DTN of reducing the nonspecific adsorption of nucleic acid molecules on the electrode surface combined with the design of indirectly triggering HCR by the target, could eliminate the masking step and simplify the assembly of the biosensor. The excellent analytical performance of the constructed biosensor indicated its great potential for early diagnosis of AMI. Furthermore, the proposed strategy can be easily extended to detect other miRNAs, and the ECL–EC ratiometric system could provide creative inspiration to develop more elaborate and sensitive hybrid ratiometric biosensors.
We acknowledge financial support from the National Key Research and Development Program of China (2016YFA0201301), the National Natural Science Foundation of China (no. 21435005, 21627808 and 21721003), and the Key Research Program of Frontier Sciences, CAS (QYZDY-SSW-SLH019).
Conflicts of interest
There are no conflicts to declare.Notes and references
- (a) Y. Zhao, J. F. Ransom, A. Li, V. Vedantham, M. von Drehle, A. N. Muth, T. Tsuchihashi, M. T. McManus, R. J. Schwartz and D. Srivastava, Cell, 2007, 129, 303–317 CrossRef CAS; (b) C. Widera, S. K. Gupta, J. M. Lorenzen, C. Bang, J. Bauersachs, K. Bethmann, T. Kempf, K. C. Wollert and T. Thum, J. Mol. Cell. Cardiol., 2011, 51, 872–875 CrossRef CAS.
- (a) Y. D'Alessandra, P. Devanna, F. Limana, S. Straino, A. Di Carlo, P. G. Brambilla, M. Rubino, M. C. Carena, L. Spazzafumo, M. De Simone, B. Micheli, P. Biglioli, F. Achilli, F. Martelli, S. Maggiolini, G. Marenzi, G. Pompilio and M. C. Capogrossi, Eur. Heart J., 2010, 31, 2765–2773 CrossRef; (b) G. K. Wang, J. Q. Zhu, J. T. Zhang, Q. Li, Y. Li, J. He, Y. W. Qin and Q. Jing, Eur. Heart J., 2010, 31, 659–666 CrossRef CAS.
- (a) Y. Q. Cheng, L. J. Dong, J. Y. Zhang, Y. Q. Zhao and Z. P. Li, Analyst, 2018, 143, 1758–1774 RSC; (b) J. Lu, L. Wu, Y. F. Hu, S. Wang and Z. Y. Guo, Biosens. Bioelectron., 2018, 109, 13–19 CrossRef CAS.
- Y. D. Sun and T. Li, Anal. Chem., 2018, 90, 11614–11621 CrossRef CAS.
- Y. K. Xia, L. L. Wang, J. Li, X. Q. Chen, J. M. Lan, A. Yan, Y. Lei, S. Yang, H. H. Yang and J. H. Chen, Anal. Chem., 2018, 90, 8969–8976 CrossRef CAS.
- Y. Zhou, H. J. Wang, H. Zhang, Y. Q. Chai and R. Yuan, Anal. Chem., 2018, 90, 3543–3549 CrossRef CAS.
- (a) Y. L. Huang, S. Mo, Z. F. Gao, J. R. Chen, J. L. Lei, H. Q. Luo and N. B. Li, Microchim. Acta, 2017, 184, 2597–2604 CrossRef CAS; (b) L. Liu, C. Song, Z. Zhang, J. Yang, L. Zhou, X. Zhang and G. Xie, Biosens. Bioelectron., 2015, 70, 351–357 CrossRef CAS.
- (a) X. L. Huo, N. Zhang, H. Yang, J. J. Xu and H. Y. Chen, Anal. Chem., 2018, 90, 13723–13728 CrossRef CAS; (b) Y. Z. Wang, W. Zhao, P. P. Dai, H. J. Lu, J. J. Xu, J. Pan and H. Y. Chen, Biosens. Bioelectron., 2016, 86, 683–689 CrossRef CAS.
- (a) L. Li, Y. Chen and J. J. Zhu, Anal. Chem., 2017, 89, 358–371 CrossRef CAS; (b) K. Shao, B. Wang, S. Ye, Y. Zuo, L. Wu, Q. Li, Z. Lu, X. Tan and H. Han, Anal. Chem., 2016, 88, 8179–8187 CrossRef CAS.
- Y. Z. Wang, N. Hao, Q. M. Feng, H. W. Shi, J. J. Xu and H. Y. Chen, Biosens. Bioelectron., 2016, 77, 76–82 CrossRef CAS.
- Q. M. Feng, Y. Z. Shen, M. X. Li, Z. L. Zhang, W. Zhao, J. J. Xu and H. Y. Chen, Anal. Chem., 2016, 88, 937–944 CrossRef CAS.
- (a) Y. Lin, J. P. Jia, R. Yang, D. Z. Chen, J. Wang, F. Luo, L. H. Guo, B. Qiu and Z. Y. Lin, Anal. Chem., 2019, 91, 3717–3724 CrossRef CAS; (b) X. Feng, N. Gan, H. Zhang, T. Li, Y. Cao, F. Hu and Q. Jiang, Biosens. Bioelectron., 2016, 75, 308–314 CrossRef CAS.
- (a) M. H. Lin, J. J. Wang, G. B. Zhou, J. B. Wang, N. Wu, J. X. Lu, J. M. Gao, X. Q. Chen, J. Y. Shi, X. L. Zuo and C. H. Fan, Angew. Chem., Int. Ed., 2015, 54, 2151–2155 CrossRef CAS; (b) Y. F. Wu, R. D. Tilley and J. J. Gooding, J. Am. Chem. Soc., 2019, 141, 1162–1170 CrossRef CAS.
- (a) A. V. Pinheiro, J. Nangreave, S. Jiang, H. Yan and Y. Liu, ACS Nano, 2012, 6, 5521–5530 CrossRef CAS; (b) E. L. Wong, E. Chow and J. J. Gooding, Langmuir, 2005, 21, 6957–6965 CrossRef CAS.
- (a) H. Pei, X. L. Zuo, D. Zhu, Q. Huang and C. H. Fan, Acc. Chem. Res., 2014, 47, 550–559 CrossRef CAS; (b) Z. L. Ge, M. H. Lin, P. Wang, H. Pei, J. Yan, J. Y. Sho, Q. Huang, D. N. He, C. H. Fan and X. L. Zuo, Anal. Chem., 2014, 86, 2124–2130 CrossRef CAS.
- (a) Y. Wen, H. Pei, Y. Wan, Y. Su, Q. Huang, S. Song and C. Fan, Anal. Chem., 2011, 83, 7418–7423 CrossRef CAS; (b) H. Pei, N. Lu, Y. Wen, S. Song, Y. Liu, H. Yan and C. Fan, Adv. Mater., 2010, 22, 4754–4758 CrossRef CAS; (c) W. Nie, Q. Wang, L. Zou, Y. Zheng, X. Liu, X. Yang and K. Wang, Anal. Chem., 2018, 90, 12584–12591 CrossRef CAS.
- Q. Liu, C. Ma, X. P. Liu, Y. P. Wei, C. J. Mao and J. J. Zhu, Biosens. Bioelectron., 2017, 92, 273–279 CrossRef CAS.
- S. K. Li, A. Y. Chen, Y. Q. Chai, R. Yuan and Y. Zhuo, Electrochim. Acta, 2016, 212, 767–774 CrossRef CAS.
- Y. Chen, J. Xu, J. Su, Y. Xiang, R. Yuan and Y. Chai, Anal. Chem., 2012, 84, 7750–7755 CrossRef CAS.
- (a) J. Huang, Y. Wu, Y. Chen, Z. Zhu, X. Yang, C. J. Yang, K. Wang and W. Tan, Angew. Chem., Int. Ed., 2011, 50, 401–404 CrossRef CAS; (b) M. J. Niu, Y. J. Wang, S. Li and Y. S. Guo, Sens. Actuators, B, 2016, 223, 359–364 CrossRef CAS.
Footnote |
| † Electronic supplementary information (ESI) available: Experimental section, optimization of detection conditions, Fig. S1, S2 and Tables S1–S3. See DOI: 10.1039/c9cc05592d |
| This journal is © The Royal Society of Chemistry 2019 |


![[thin space (1/6-em)]](https://www.rsc.org/images/entities/char_2009.gif)
