
 Open Access Article
 This Open Access Article is licensed under a Creative Commons Attribution-Non Commercial 3.0 Unported Licence
Nd3+-Doped BiVO4 luminescent nanothermometers of high sensitivity†
Pascal M.
Gschwend
 a,
Fabian H. L.
Starsich
a,
Robert C.
Keitel
b and
Sotiris E.
Pratsinis
*a
a,
Fabian H. L.
Starsich
a,
Robert C.
Keitel
b and
Sotiris E.
Pratsinis
*a
aParticle Technology Laboratory, Institute of Process Engineering, Department of Mechanical and Process Engineering, ETH Zürich, Sonneggstrasse 3, CH-8092 Zurich, Switzerland. E-mail: sotiris.pratsinis@ptl.mavt.ethz.ch
bOptical Materials Engineering Laboratory, Institute of Process Engineering, Department of Mechanical and Process Engineering, ETH Zürich, Leonhardstrasse 21, CH-8092 Zurich, Switzerland
First published on 23rd May 2019
Abstract
Neodymium-doped BiVO4 nanoparticles are explored for luminescent nanothermometry in the first and second biological windows. The nanothermometer sensitivity can be increased by an order of magnitude through careful selection of excitation wavelength and emission peaks, leading to sub-degree resolution and penetration depth up to 6 mm in biological tissues.
Temperature measurements are important in countless industrial and research applications. It is thus not surprising that temperature sensors presently account for 80% of the world-wide sensor market which is valued over 5 billion USD.1 As the focus, however, shifts to smaller scales, especially for microelectronics or nanomedicine, traditional temperature measurements (thermistors, thermocouples) are no longer applicable,2i.e. when the target is small compared to the sensor. Therefore, nanoscale thermometers with high spatial resolution and accuracy are required.
Especially medicine has attracted increasing interest for precise temperature sensing at the nanoscale: many functions within a human body, such as cell division, gene expression or enzyme reactions depend on temperature.3 For example, cellular pathogenesis of cancer and other diseases lead to heat generation.4 Temperature changes can also be induced intentionally to locally kill diseased cells.5 There, having precise information over the local thermal profile is crucial to avoid destruction of the surrounding healthy tissue.
The temperature measurement within biological tissue, however, is challenging. Surface-based methods such as IR thermography are obviously not applicable. Other competing methods such as MRI thermometry6 require careful calibration specific to the surrounding tissue.7 In contrast, luminescence thermometry is a simple and inexpensive approach to measure intra-tissue temperatures in real time with high accuracy8 and spatial resolution.9 It takes advantage of the thermally-induced changes of the luminescence characteristics, such as band shape, spectral position or lifetime.10 Several nanostructured materials have been proposed as luminescent thermometers, including rare-earth doped nanoparticles,11 quantum dots,12 polymeric particles,13 fluorescent proteins14 or metallic nanoparticles.15 Rare-earth doped nanoparticles are especially promising due to their chemical, thermal10 and photo-stability as well as their immunity to blinking.16 Typical examples are fluorides doped with Yb3+ and Er3+ for upconverting luminescence. High relative sensitivities have been reported for NaYF4:Yb,Er.17 However, such upconverting materials typically suffer from low quantum yields18 and a strong dependence of sensitivity on excitation density.19 This hinders their use for deep tissue applications. Therefore, efficient downconverting nanomaterials for temperature sensing, mainly based on Nd3+ doping, have been investigated recently. These include LaF3:Nd,20 LiNdP4O12,21 and CaF2:Nd.22 The Nd3+ is an ideal dopant due to its ladder-like intra-4f energy level structure, where excitation and emission peaks lie within the first and second biological window.23 There, absorption and scattering by the human tissue is drastically reduced, allowing deep tissue penetration of light. Recently, BiVO4 was reported as an excellent host for Nd3+ enabling such deep penetration (3–20 mm)24 in chicken tissue and bovine liver.
Commonly, material optimization is used to increase the sensitivity of nanothermometers. Here, however, the actual thermometry method is optimized. For Nd3+-doped nanoparticles, typically the relative intensity of two emission peaks is used to determine the temperature, commonly termed fluorescence intensity ratio (FIR) method.25 It is self-referencing and independent of emitter particle concentration, excitation power or emission intensity,26 making it a robust approach that eliminates the need for cumbersome calibration in specific environments. However, typically employed emission peaks are close to each other resulting in relatively low thermal sensitivities. In contrast, through careful selection of the Nd3+ energy levels, the sensitivity can be increased by an order of magnitude.
Here, novel luminescent nanothermometers consisting of flame-made BiVO4 nanoparticles doped with 1 at% Nd3+ for deep-tissue thermal sensing are presented. Fig. 1a shows their XRD pattern indicating monoclinic BiVO4 (circles) with average crystal size of 38 nm. This is consistent with 40 nm by analyzing transmission electron microscopy (TEM) images (inset Fig. 1a and Fig. S1c, ESI†). The primary particle size by nitrogen adsorption (BET) is slightly larger (51 nm) indicating sinter necks and aggregation that were created during annealing (Fig. S1a, ESI†). The formation of such aggregates and agglomerates of average size 249 nm is also supported by DLS measurements (Fig. S1b and d, ESI†).
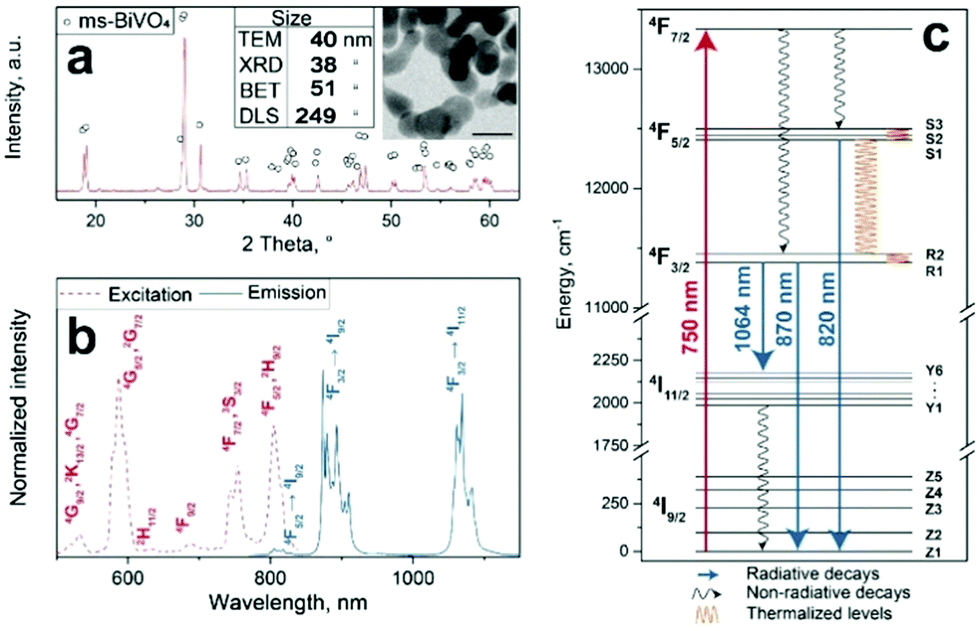 | ||
| Fig. 1 Flame-made Nd-doped BiVO4 nanoparticles: (a) XRD pattern with electron microscopy image (inset, scale bar = 50 nm) along with the average primary particle size determined by microscopy (TEM), XRD and N2 adsorption (BET) as well as average agglomerate size determined by dynamic light scattering (DLS), (b) excitation (broken red line) and emission spectra (solid blue line) and (c) corresponding energy diagram. | ||
Fig. 1b shows the excitation (dotted red line) and emission (solid blue line) spectra of these particles. The characteristic absorption bands of Nd3+ are around 750 (4F7/2, 4S3/2) and 800 nm (4F5/2, 2H9/2), corresponding to the f–f transitions from the ground 4I9/2 state to the excited states.27 Readily available 808 nm lasers are typically employed for excitation of Nd3+-doped materials that only allow detection of the 4F3/2 → 4I9/2 (λ = 860–925 nm) in the first biological window as well as the 4F3/2 → 4I11/2 (λ = 1050–1100 nm) and 4F3/2 → 4I13/2 (λ = 1300–1350 nm) transitions in the second biological window. In contrast, here the absorption band around 750 nm is chosen as excitation wavelength to enable the detection of the additional 4F5/2 → 4I9/2 transition (λ = 800–840 nm), while still exciting the particles within that biological window.23Fig. 1c shows the corresponding energy diagram for Nd3+ in monoclinic BiVO4 that was obtained by deconvolution (Fig. S2, ESI†). The observed peaks in the emission spectrum fit nicely to the calculated radiative decays and indicate that indeed Nd3+ is excited.
These nanophosphors are explored for luminescent temperature sensing. Fig. 2a shows their normalized emission spectra measured at 37, 100 and 250 °C. The relative intensity of several peaks changes with temperature. The most relevant emission intensity changes are observed for the complete 4F5/2 → 4I9/2 transition (Fig. 2a, blue area, A1), as well as for some stark sublevel peaks (P1–P4).
 | ||
| Fig. 2 (a) Normalized emission spectra at three temperatures. Three areas (A1 to A3) and four peaks (P1 to P4) are evaluated for thermometry. (b) Fluorescence intensity ratios as a function of temperature. | ||
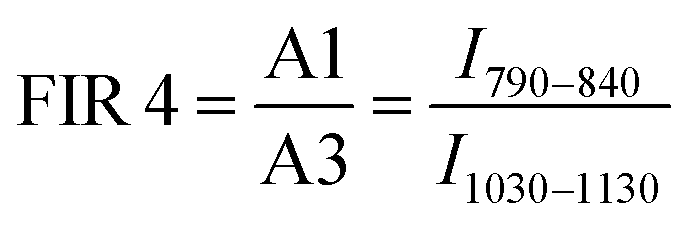
Here, the intensity ratios25 of two different peaks are investigated as a temperature readout. For Nd3+-based nanothermometers, typically the intensity ratio of two narrow, closely separated intra-stark transitions (peaks) such as the ones from P1 to P2 or P3 to P4 are chosen.11 Additionally, the ratio of complete transition (areas under peaks) from A1 to A2 and A1 to A3 are investigated. This includes the 4F5/2 → 4I9/2 emission centered around 808 nm that is only available due to the choice of 750 nm excitation wavelength instead of the employed 808 nm.28 In summary, the following four luminescent peak ratios were defined to analyze the temperature dependence:
 | (1) |
 | (2) |
 | (3) |
 | (4) |
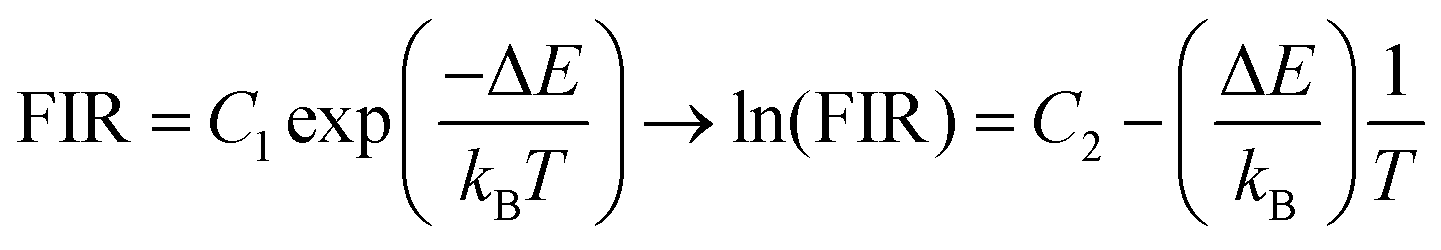
Theoretically, the ratio of two thermally coupled levels can be described by the Boltzmann thermal equilibrium between two emitting states according to:25
 | (5) |
These slopes correspond to ΔE/kB, according to eqn (5). The obtained slopes of FIRs 1–3 increase for larger energy differences (ΔE) between analyzed peaks, as expected (Table S1, ESI†). The FIR 1 and 2 use the thermal equilibrium between the sublevels of 4F3/2 and 4F5/2 (Fig. 1c), respectively, while FIR 3 uses the equilibrium between the complete 4F3/2 and 4F5/2 levels. The slope of FIR 4 is similar to FIR 3 despite the, on first sight, much larger energy difference. However, the emission peak around 1064 nm corresponds to the 4F3/2 → 4I11/2 transition (i.e. the same excited state as 870 nm emission) and is followed by a non-radiative decay down to the 4I9/2 ground state.27 Therefore, in both FIR 3 and 4 the same thermal equilibrium between the 4F3/2 and 4F5/2 states is exploited for temperature sensing, resulting in similar slopes.
The response of nanothermometers to temperature was determined by calculating the relative thermal sensitivitiy (SR):25
 | (6) |
Besides lower sensitivities, another disadvantage of using the intra-stark level peaks (FIR 1 and 2) is the limited operating temperature range. At higher temperatures, the emission lines become broader and start overlapping (Fig. 2a). This blurs the identification and separation of individual peaks, making cumbersome deconvolutions necessary (Fig. S2, ESI†). Moreover, a slight red shifting of the emission lines with increasing temperature has been reported.30 However, using large energy separations can limit the usefulness of these nanothermometers for some applications: for example, the absorption and scattering properties of surrounding biological tissue show a strong dependence on wavelength. Thus, a strong spectral separation can increase the error or require cumbersome calibration in each environment. Moreover, also technical limitations have to be taken into consideration: standard silicon-based detectors operate up to 1000 nm, whereas InGaAs-based detectors for NIR operate between 900–1700 nm.31 Therefore, we have chosen FIR 3 as the most promising option for further analysis, as it can still be detected with a single detector and does not require any data correction.
To fully characterize the nanothermometers, their uncertainty and reproducibility, as well as the influence of experimental conditions were investigated. Besides sensitivity, temperature uncertainty (or resolution) is the most important characteristic of a nanothermometer, as it determines the smallest temperature change that can be detected under real working conditions:2
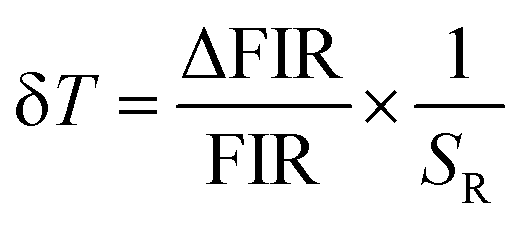 | (7) |
The reproducibility of the temperature measurements was more than 99.6% over ten cycles between 30 and 50 °C (Fig. S4d, ESI†). Furthermore, the sensitivity of the nanothermometers under different experimental conditions was tested (Fig. S5, ESI†). Only small differences within the experimental error were observed when changing excitation power, particle concentration or solvent. This independency between experimental conditions and environment represents one of the biggest advantages of the FIR method. It allows the use of nanothermometers in different environments,33 which is especially attractive for in vivo applications.
Since FIR 3 was the most promising thermal readout, it is used here to demonstrate the potential of BiVO4:Nd nanothermometers for temperature measurements within biological tissues. Fig. 3a shows a sketch of the experimental setup. A plexiglass plate with two cavities (orange boxes) was heated from below. One cavity was covered by chicken skeletal muscle tissue of varying thickness (1.5–6 mm) while the other remained uncovered and acted as control. The temperature of the nanothermometers was determined through the tissue by the present FIR method (green triangles) under 750 nm laser excitation (0.2 W cm−2) while the surface temperature of the tissue (red circles) and the control square (black squares) were determined by IR thermal imaging.
 | ||
| Fig. 3 (a) BiVO4:Nd nanothermometers mixed with agar were filled into two square cavities (5 × 5 × 3 mm): one cavity was covered by chicken skeletal muscle tissue of varying thickness while the other was used as a reference (control), and both were heated from below. The temperature of the first filled cavity was measured through chicken tissue by luminescence thermometry (triangle). The control (square) and the chicken tissue surface temperature (circle) were measured by IR thermal imaging. (b) The evolution of these temperatures as measured through 3 mm thick tissue and that of the control cavity (squares) during heating. | ||
Fig. 3b shows the temperature evolution through the 3 mm thick chicken tissue and at its surface along with that of the control cavity. Both nanothermometer and control particles quickly heat up reaching 78 °C within 900 s. This indicates the good accuracy of the nanothermometers even through a scattering and absorbing medium such as chicken tissue. In contrast, the surface temperature increases much slower and reaches 51 °C after 15 minutes, leading to a temperature difference (ΔT) of 27 °C. This final temperature difference was measured to be 23 and 33 °C for 1.5 and 6 mm thick tissues, respectively. As expected, this difference increases for increasing tissue thickness. Remarkably, even at 1.5 mm the temperature difference between the surface and the nanothermometers is around 23 °C. This experiment, which is similar to that of plasmonic particles under laser irradiation inside tumor tissue,6 shows the shortcomings of surface-based IR thermal imaging.34
In summary, a novel ratiometric approach for luminescent nanothermometry was presented with BiVO4 nanoparticles doped with Nd3+. The luminescent thermometric performance in suspension and powder form was tested in a broad temperature range between 25 and 300 °C. It was demonstrated how the careful choice of emission bands for the FIR can lead to relative thermal sensitivities of up to 1.53%/K at 37 °C within the first and second biological window. These values are almost an order of magnitude larger than most nanothermometers based on Nd3+. Additionally, the present nanothermometers exhibited excellent reproducibility while showing negligible dependence on experimental parameters and surroundings. Finally, the potential of these nanothermometers for deep-tissue thermal sensing in real-time was demonstrated ex vivo with chicken skeletal muscle tissue.
Financial support by ETH Zürich (ETH-43 17-1) and Swiss National Science Foundation (#206021_177037 and #205320_163243) are kindly acknowledged. We thank Dr. Frank Krumeich (ScopeM, ETH Zürich) for electron microscopy.
Conflicts of interest
There are no conflicts to declare.References
- MarketsAndMarkets, Temperature Sensors Market by Type, End User, and Geography – Global Forecast to 2022, http://www.marketsandmarkets.com/Market-Reports/temperature-sensor-market-522.html, accessed 05.04.2019, 2019.
- Lanthanides in Luminescent Thermometry, ed. C. D. S. Brites, A. Millan and L. D. Carlos, Elsevier, Amsterdam, 2016 Search PubMed.
- R. J. DeBerardinis, J. J. Lum, G. Hatzivassiliou and C. B. Thompson, Cell Metab., 2008, 7, 11–20 CrossRef CAS.
- M. Karnebogen, D. Singer, M. Kallerhoff and R. H. Ringert, Thermochim. Acta, 1993, 229, 147–155 CrossRef.
- D. Jaque, L. M. Maestro, B. del Rosal, P. Haro-Gonzalez, A. Benayas, J. L. Plaza, E. M. Rodriguez and J. G. Solé, Nanoscale, 2014, 6, 9494–9530 RSC.
- A. M. Elliott, R. J. Stafford, J. Schwartz, J. Wang, A. M. Shetty, C. Bourgoyne, P. O'Neal and J. D. Hazle, Med. Phys., 2007, 34, 3102–3108 CrossRef CAS.
- V. Rieke and K. B. Pauly, J. Magn. Reson. Imaging, 2008, 27, 376–390 CrossRef PubMed.
- T. T. Bai and N. Gu, Small, 2016, 12, 4590–4610 CrossRef CAS PubMed.
- C. D. S. Brites, P. P. Lima, N. J. O. Silva, A. Millan, V. S. Amaral, F. Palacio and L. D. Carlos, Front. Chem., 2013, 1, 9 Search PubMed.
- D. Jaque and F. Vetrone, Nanoscale, 2012, 4, 4301–4326 RSC.
- D. Wawrzynczyk, A. Bednarkiewicz, M. Nyk, W. Strek and M. Samoc, Nanoscale, 2012, 4, 6959–6961 RSC.
- J. M. Yang, H. Yang and L. W. Lin, ACS Nano, 2011, 5, 5067–5071 CrossRef CAS PubMed.
- K. Okabe, N. Inada, C. Gota, Y. Harada, T. Funatsu and S. Uchiyama, Nat. Commun., 2012, 3, 705 CrossRef PubMed.
- J. S. Donner, S. A. Thompson, M. P. Kreuzer, G. Baffou and R. Quidant, Nano Lett., 2012, 12, 2107–2111 CrossRef CAS PubMed.
- L. Shang, F. Stockmar, N. Azadfar and G. U. Nienhaus, Angew. Chem., Int. Ed., 2013, 52, 11154–11157 CrossRef CAS PubMed.
- D. Jaque, C. Richard, B. Viana, K. Soga, X. G. Liu and J. G. Sole, Adv. Opt. Photonics, 2016, 8, 1–103 CrossRef.
- F. Vetrone, R. Naccache, A. Zamarron, A. J. de la Fuente, F. Sanz-Rodriguez, L. M. Maestro, E. M. Rodriguez, D. Jaque, J. G. Sole and J. A. Capobianco, ACS Nano, 2010, 4, 3254–3258 CrossRef CAS.
- J. C. Boyer and F. C. J. M. van Veggel, Nanoscale, 2010, 2, 1417–1419 RSC.
- L. Marciniak, K. Waszniewska, A. Bednarkiewicz, D. Hreniak and W. Strek, J. Phys. Chem. C, 2016, 120, 8877–8882 CrossRef CAS.
- U. Rocha, C. Jacinto, K. U. Kumar, F. J. Lopez, D. Bravo, J. G. Sole and D. Jaque, J. Lumin., 2016, 175, 149–157 CrossRef CAS.
- L. Marciniak, K. Prorok, A. Bednarkiewicz, A. Kowalczyk, D. Hreniak and W. Strek, J. Lumin., 2016, 176, 144–148 CrossRef CAS.
- P. Cortelletti, C. Facciotti, I. X. Cantarelli, P. Canton, M. Quintanilla, F. Vetrone, A. Speghini and M. Pedroni, Opt. Mater., 2017, 68, 29–34 CrossRef CAS.
- R. Weissleder, Nat. Biotechnol., 2001, 19, 316–317 CrossRef CAS.
- F. H. L. Starsich, P. Gschwend, A. Sergeyev, R. Grange and S. E. Pratsinis, Chem. Mater., 2017, 29, 8158–8166 CrossRef CAS.
- S. A. Wade, S. F. Collins and G. W. Baxter, J. Appl. Phys., 2003, 94, 4743–4756 CrossRef CAS.
- C. D. S. Brites, P. P. Lima, N. J. O. Silva, A. Millan, V. S. Amaral, F. Palacio and L. D. Carlos, Nanoscale, 2013, 5, 7572–7580 RSC.
- A. Bednarkiewicz, D. Wawrzynczyk, M. Nyk and W. Strek, Opt. Mater., 2011, 33, 1481–1486 CrossRef CAS.
- S. Balabhadra, M. L. Debasu, C. D. S. Brites, L. A. O. Nunes, O. L. Malta, J. Rocha, M. Bettinelli and L. D. Carlos, Nanoscale, 2015, 7, 17261–17267 RSC.
- C. Liu, Y. Hou and M. Gao, Adv. Mater., 2014, 26, 6922–6932 CrossRef CAS.
- L. Marciniak, A. Bednarkiewicz, D. Hreniak and W. Strek, J. Mater. Chem. C, 2016, 4, 11284–11290 RSC.
- A. M. Smith, M. C. Mancini and S. Nie, Nat. Nanotechnol., 2009, 4, 710–711 CrossRef CAS PubMed.
- M. Rodrigues, R. Pinol, G. Antorrena, C. D. S. Brites, N. J. O. Silva, J. L. Murillo, R. Cases, I. Diez, F. Palacio, N. Torras, J. A. Plaza, L. Perez-Garcia, L. D. Carlos and A. Millan, Adv. Funct. Mater., 2016, 26, 200–209 CrossRef CAS.
- E. Carrasco, B. del Rosal, F. Sanz-Rodriguez, A. J. de la Fuente, P. H. Gonzalez, U. Rocha, K. U. Kumar, C. Jacinto, J. G. Sole and D. Jaque, Adv. Funct. Mater., 2015, 25, 615–626 CrossRef CAS.
- I. L. Maksimova, G. G. Akchurin, B. N. Khlebtsov, G. S. Terentyuk, G. G. Akchurin, I. A. Ermolaev, A. A. Skaptsov, E. P. Soboleva, N. G. Khlebtsov and V. V. Tuchin, Med. Laser Appl., 2007, 22, 199–206 CrossRef.
Footnote |
| † Electronic supplementary information (ESI) available: Experimental details, detailed size distributions (TEM, DLS), deconvolution of emission spectra, detailed thermometry characterization. See DOI: 10.1039/c9cc03180d |
| This journal is © The Royal Society of Chemistry 2019 |