 Open Access Article
Measurement of quantum coherence in thin films of molecular quantum bits without post-processing†‡
Samuel
Lenz
a,
Bastian
Kern
b,
Martin
Schneider
c and
Joris
van Slageren
 *a
*a
aInstitute of Physical Chemistry and Center for Integrated Quantum Science and Technology, University of Stuttgart, Pfaffenwaldring 55, D-70569 Stuttgart, Germany. E-mail: slageren@ipc.uni-stuttgart.de
bMax Planck Institute for Solid State Research, Heisenbergstraße 1, D-70569 Stuttgart, Germany
cBrno University of Technology, Technická 2, Brno 61669, Czech Republic
First published on 3rd June 2019
Abstract
Thin film deposition of molecular quantum bits may further their integration into devices. Current electron paramagnetic resonance equipment is ill-suited for thin film investigations of spin dynamics. We present a 35 GHz Fabry–Pérot resonator enabling such measurements and demonstrate its use in the study of different molecular quantum bits.
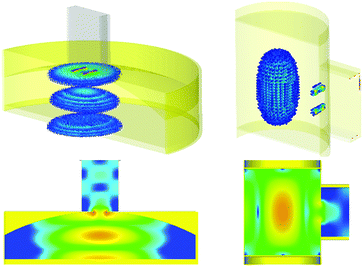
Molecular quantum bits (qubits) are promising building blocks for quantum technologies, including quantum sensing and quantum information processing.1–4 Their main advantages include excellent tunability through chemical synthesis, as well as the possibility to position them in regular arrays with atomic precision. One of the main quality criteria for quantum bits is their quantum coherence time, i.e., the lifetime of an arbitrary superposition state of the two (or more) levels defining the quantum bit. During the past decade, coherence times have increased from hundreds of nanoseconds to just shy of a millisecond.5–7 Measurements were largely performed on dilute frozen solutions or doped powders of the compounds.1–4 Local addressing of molecular qubits in quantum information processing will require depositing them in two-dimensional arrays,8 whereas (porous) thin films may be used for quantum sensing of analytes.1,9 Conventional EPR cylindrical or rectangular resonators have prolately shaped microwave magnetic field distributions (Fig. 1, right), poorly suited for thin film investigations. Consequently, thus far, spin dynamics measurements of thin films, including the determination of phase memory or quantum coherence time have been carried out either ex situ by dissolving the films,10 or by cutting thin films on flexible substrates into pieces so that they fit into standard electron paramagnetic resonance (EPR) tubes.11,12 Both are rather unsatisfactory and do not allow moving forward towards device application.
 | ||
| Fig. 1 Simulations of microwave magnetic field strength distributions for a Fabry–Pérot resonator (TEM002 mode, left) and cylindrical resonator (TE011 mode, right) made out of brass. | ||
To remedy this situation, we have constructed a new microwave resonator of the Fabry–Pérot type, which we present here (Fig. S1 and S2, ESI†). It allows measurement of thin films without the need of post-processing the films (such as cutting) and are fundamentally compatible with measurements on devices, as well as measurements in ultrahigh-vacuum (for ultraclean film deposition) and in gas flows (for quantum sensing).
Fabry–Pérot resonators (FPR) are open resonators that consist of two parallel mirrors that can be plane or concave. They are ubiquitous in optics and, e.g., an essential part of many lasers. FPR have found application in high-frequency EPR,13–19 but have been little used at conventional frequencies.20 Microwave simulations revealed that by using a flat bottom mirror and a concave upper mirror, coupling to a rectangular Q-band waveguide, typical Fabry–Pérot modes TE00q can be excited at Q-band frequencies of ca. 35 GHz (Fig. 1, left). By changing the intermirror distance, the resonator can be tuned to the desired TE00q mode. These modes possess oblate microwave field distributions with excellent magnetic field (B1) homogeneities in the plane of the bottom mirror (Fig. 1 and Fig. S3, ESI†). The B1-direction is in the plane of the bottom mirror and given by the orientation of the rectangular waveguide. With the external magnetic field B0 of an electromagnet also in the plane of the bottom mirror, both parallel and perpendicular EPR measurements are thus possible. A tunable FPR that follows this design was manufactured out of brass (Fig. S1 and S2, ESI†). No variable coupling means was implemented, because pulsed EPR measurements are typically performed under overcoupled conditions and a means to critically couple the resonator is not essential. We designed the iris in a way that overcoupling is assured for the TEM modes inside the FPR.
The FPR was characterized by using a vector network analyzer (Fig. S4, S5 and Table S1, ESI†). The unloaded Q-factor of a resonator is only limited by the finite conductivity of the resonator walls and by dielectric losses, and was found to be Q = 5560 for the TEM002 mode and largely temperature independent. When inserted into an external circuit, the resonator experiences its influence leading to a lowering of the apparent Q-factor (loaded Q-factor). This can be characterized by measuring the complex input reflection coefficient S11.21 In a polar plot (Smith chart), the result is a so-called Q-circle (Fig. S4, ESI†), where the diameter d of the circle allows determination of the coupling factor κ as κ = (2/d − 1)−1. The reflection data can be linearized and fitted with a straight line to obtain the loaded Q-factor (Fig. S5, ESI†).21 In the case of our FPRs we found that the coupling coefficients were between κ = 0.93 and κ = 3.87, and the loaded Q-factors between Qloaded = 404 and Qloaded = 1142 for the different modes (Table S1, ESI†), indicating that the FPR is overcoupled (κ > 1) for most modes. For pulsed EPR measurements, overcoupling is essential to limit the instrument deadtime due to cavity ringing.22 These Q-factors are quite comparable to those found for the cylindrical resonator (CR) also used in our laboratory (Qloaded = 900).
For a first comparison of the FPR and CR, we used a sample of 0.1% [Cu(dbm)2] in [Pd(dbm)2] (Hdbm = dibenzoylmethane), which was previously studied by us.23 The echo-detected EPR spectra obtained by measuring the echo intensity of a conventional Hahn echo sequence (π/2–τ–π–echo) as a function of B0 (Fig. S6, ESI†) are essentially indistinguishable from each other, demonstrating the good performance of the new FPR resonator.
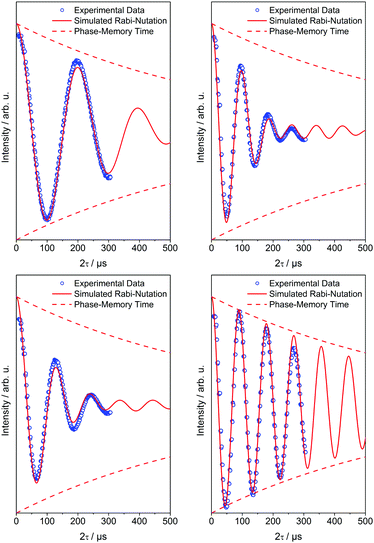
By changing the distance between the two mirrors of the FPR, four different EPR-active modes can be excited. We have investigated these different modes by means of Hahn echo measurements on a disc shaped sample of 5 weight% of the stable BDPA-(α,γ-bisdiphenylene-β-phenylallyl-) radical in polystyrene (5 mm diameter, 0.1 mm thick). Interestingly, the echo signal intensity as a function of mode number (1 corresponds to shortest intermirror distance) is not monotonic (Fig. S7, ESI†). In addition, the Rabi oscillations observed in nutation measurements at room temperature decay much more quickly for first three modes compared to mode 4 (Fig. 2) In mode 4, the decay is essentially given by the phase memory time of the sample (TM = 650 ns). Rabi oscillations with decay times shorter than TM are often observed in practice. This prompted us to investigate the nature of these modes further by means of microwave simulations (Fig. S8–S15, ESI†). It turns out that the first three modes are TEM modes mixed with TM modes. This leads to a much reduced microwave field strength homogeneity at the position of the sample. In contrast, mode 4 is essentially the TEM002 mode which has a much better field homogeneity. To elucidate the different Rabi oscillation decay behaviour, we sampled the B1 field calculated by microwave simulations for all modes at many (∼104) points at the sample position, calculated the local nutation frequency according to ωnut = g·μB·B1/ħ (for S = 1/2) and simulated the effect of the nutation pulse by summing up all contributions. The result is astoundingly close to what was measured, suggesting that B1 inhomogeneity is the main cause of rapid Rabi oscillation decay here and by extension potentially also in measurements carried out with conventional pulsed EPR resonators.
In a next step we were interested in the absolute sensitivity that can be achieved with the FPR. To this end, we prepared PMMA films of various thicknesses doped with BDPA. The echo detected spectra (Fig. S16, ESI†) show that the absolute spin sensitivity is better than 1013 spins per G for 200 shots per measurement point. This number of spins corresponds to an array of 3 × 106 by 3 × 106 spins, which for a 1 × 1 nm molecular size is roughly around 3 × 3 mm, i.e. much smaller than the volume of the FPR microwave modes. Consequently, we could in principle measure monolayers of molecular quantum bits. This is in spite of the fact that the absolute spin sensitivity is inferior to that of our CR as the conversion factor c (which connects microwave power with the magnetic field) of our FPR is only half as large as that of our CR (FPR: 1.8 G/W0.5 CR: 3.7 G/W0.5). However, the larger mode volume of the FPR allows using samples that are five times larger than in our CR. Because sensitivity scales linearly with c and the sample size, we gain a factor of two in concentration sensitivity for large samples compared to our CR. The possibility of using large samples results in a very high concentration sensitivity of 10 nM G−1. Irrespective of sensitivity considerations, it is much more convenient to place a thin film sample directly on a metal mirror than slicing and packing it into a small tube.
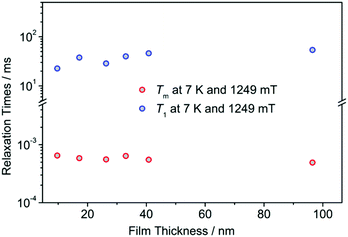
These samples also allow us to investigate the sample thickness dependence of the spin dynamics. Recent work has revealed that spin dynamics of molecular nanomagnets in monolayers can be radically different from bulk behaviour.24 Therefore we determined the spin–lattice relaxation time as a function of film thickness. The measurements reveal no significant change of the spin–lattice relaxation time down to a film thickness of 9.7 nm (Fig. 3, Fig. S17 and Table S2, ESI†). Also the phase memory times recorded at 7 K are essentially independent of film thickness. This is an important result which makes the prospect of employing regular arrays of molecular quantum bits very promising.
To make a first step in this direction, we have co-evaporated copper phthalocyanine (CuPc) and free base phthalocyanine (H2Pc) in a 1![[thin space (1/6-em)]](https://www.rsc.org/images/entities/char_2009.gif) :
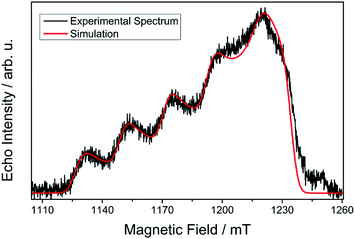
:![[thin space (1/6-em)]](https://www.rsc.org/images/entities/char_2009.gif) 5 ratio onto sapphire in ultra-high vacuum to give a 60 nm thin film. The substrate with film was directly transferred into the FPR and inserted into the cryostat. Thus we ensure that the film is not damaged in post-processing manipulations such as cutting. The echo detected spectrum recorded at 7 K (Fig. 4) shows the typical features of EPR spectra of copper(II) complexes with the g‖ region with the prominent four copper hyperfine components between 1125–1220 G and the g⊥ region around 1230 G without strong hyperfine splitting. However, the intensity ratio of the two regions is unusual in that the parallel region is more pronounced than expected for a powder sample. This demonstrates that the copper(II) phthalocyanine molecules in the film are preferentially oriented perpendicularly to the substrate. Because the B0-field is parallel to the substrate, this leads to statistically more molecules oriented parallelly to the B0-field than would be the case in a randomly oriented powder. Indeed, simulations of the spectrum taking into account this preferential orientation fit very well to the experimental data (see ESI† for details). The spin–lattice relaxation time at 7 K was determined to be T1 = 7 μs by using the inversion recovery pulse sequence (Fig. S18, ESI†). By means of the Hahn echo sequence, we also determined the phase memory time to be 400 ns at 7 K (Fig. S18, ESI†). This is very similar to what was measured for thicker films of 400 nm at similar concentrations, showing the robustness also of this molecular quantum bit.12
5 ratio onto sapphire in ultra-high vacuum to give a 60 nm thin film. The substrate with film was directly transferred into the FPR and inserted into the cryostat. Thus we ensure that the film is not damaged in post-processing manipulations such as cutting. The echo detected spectrum recorded at 7 K (Fig. 4) shows the typical features of EPR spectra of copper(II) complexes with the g‖ region with the prominent four copper hyperfine components between 1125–1220 G and the g⊥ region around 1230 G without strong hyperfine splitting. However, the intensity ratio of the two regions is unusual in that the parallel region is more pronounced than expected for a powder sample. This demonstrates that the copper(II) phthalocyanine molecules in the film are preferentially oriented perpendicularly to the substrate. Because the B0-field is parallel to the substrate, this leads to statistically more molecules oriented parallelly to the B0-field than would be the case in a randomly oriented powder. Indeed, simulations of the spectrum taking into account this preferential orientation fit very well to the experimental data (see ESI† for details). The spin–lattice relaxation time at 7 K was determined to be T1 = 7 μs by using the inversion recovery pulse sequence (Fig. S18, ESI†). By means of the Hahn echo sequence, we also determined the phase memory time to be 400 ns at 7 K (Fig. S18, ESI†). This is very similar to what was measured for thicker films of 400 nm at similar concentrations, showing the robustness also of this molecular quantum bit.12
 | ||
Fig. 4 Echo detected (π/2–τ–π–τ–echo) spectra of a 60 nm thick film of CuPc![[thin space (1/6-em)]](https://www.rsc.org/images/entities/char_2009.gif) : :![[thin space (1/6-em)]](https://www.rsc.org/images/entities/char_2009.gif) H2Pc (ca. 1 H2Pc (ca. 1![[thin space (1/6-em)]](https://www.rsc.org/images/entities/char_2009.gif) : :![[thin space (1/6-em)]](https://www.rsc.org/images/entities/char_2009.gif) 5) on sapphire at 7 K. The solid line is a fit based on the parameters given in the text. 5) on sapphire at 7 K. The solid line is a fit based on the parameters given in the text. | ||
In conclusion, we have constructed a Fabry–Pérot resonator that allows measurement of thin film samples of paramagnetic species such as molecular quantum bits without post-processing of the films. We have demonstrated that the larger microwave magnetic field homogeneity of the TEM00q modes over other resonator modes prevents the rapid decay of Rabi oscillations often observed in literature.
We acknowledge the Carl-Zeiss-Foundation for funding and Dr Petr Neugebauer (CEITEC, Brno), Thomas Hettich (University of Stuttgart) and Prof. Sabine Ludwigs (University of Stuttgart) for useful discussions, preliminary experiments, and access to the spin coating equipment, respectively.
Conflicts of interest
There are no conflicts to declare.Notes and references
- M. J. Graham, J. M. Zadrozny, M. S. Fataftah and D. E. Freedman, Chem. Mater., 2017, 29, 1885–1897 CrossRef CAS.
- F. Troiani and M. Affronte, Chem. Soc. Rev., 2011, 40, 3119–3129 RSC.
- S. Sproules, Electron Paramagnetic Resonance, The Royal Society of Chemistry, 2017, vol. 25, pp. 61–97 Search PubMed.
- A. Gaita-Ariño, F. Luis, S. Hill and E. Coronado, Nat. Chem., 2019, 11, 301–309 CrossRef.
- A. Ardavan, O. Rival, J. J. L. Morton, S. J. Blundell, A. M. Tyryshkin, G. A. Timco and R. E. P. Winpenny, Phys. Rev. Lett., 2007, 98, 057201 CrossRef PubMed.
- K. Bader, D. Dengler, S. Lenz, B. Endeward, S.-D. Jiang, P. Neugebauer and J. van Slageren, Nat. Commun., 2014, 5, 5304 CrossRef CAS PubMed.
- J. M. Zadrozny, J. Niklas, O. G. Poluektov and D. E. Freedman, ACS Cent. Sci., 2015, 1, 488–492 CrossRef CAS PubMed.
- A. Urtizberea, E. Natividad, P. J. Alonso, M. A. Andrés, I. Gascón, M. Goldmann and O. Roubeau, Adv. Funct. Mater., 2018, 28, 1801695 CrossRef.
- C. L. Degen, F. Reinhard and P. Cappellaro, Rev. Mod. Phys., 2017, 89, 035002 CrossRef.
- F. Ciccullo, A. Calzolari, K. Bader, P. Neugebauer, N. M. Gallagher, A. Rajca, J. van Slageren and M. B. Casu, ACS Appl. Mater. Interfaces, 2019, 11, 1571–1578 CrossRef CAS PubMed.
- Y.-Z. Dai, B.-W. Dong, Y. Kao, Z.-Y. Wang, H.-I. Un, Z. Liu, Z.-J. Lin, L. Li, F.-B. Xie, Y. Lu, M.-X. Xu, T. Lei, Y.-J. Sun, J.-Y. Wang, S. Gao, S.-D. Jiang and J. Pei, ChemPhysChem, 2018, 19, 2972–2977 CrossRef CAS PubMed.
- M. Warner, S. Din, I. S. Tupitsyn, G. W. Morley, A. M. Stoneham, J. A. Gardener, Z. Wu, A. J. Fisher, S. Heutz, C. W. M. Kay and G. Aeppli, Nature, 2013, 503, 504–508 CrossRef CAS PubMed.
- P. Neugebauer and A. L. Barra, Appl. Magn. Reson., 2010, 37, 833–843 CrossRef.
- P. Neugebauer, D. Bloos, P. Lutz and J. van Slageren, Phys. Chem. Chem. Phys., 2017, 20, 15528–15534 RSC.
- I. Tkach, U. Rogulis, S. Greulich-Weber and J. M. Spaeth, Rev. Sci. Instrum., 2004, 75, 4781–4788 CrossRef CAS.
- J. P. Barnes and J. H. Freed, Rev. Sci. Instrum., 1997, 68, 2838–2846 CrossRef CAS.
- O. Burghaus, M. Rohrer, T. Gotzinger, M. Plato and K. Mobius, Meas. Sci. Technol., 1992, 3, 765–774 CrossRef.
- M. Rohrer, J. Krzystek, V. Williams and L. C. Brunel, Meas. Sci. Technol., 1999, 10, 275–284 CrossRef CAS.
- J. A. J. M. Disselhorst, H. Vandermeer, O. G. Poluektov and J. Schmidt, J. Magn. Reson., Ser. A, 1995, 115, 183–188 CrossRef CAS.
- M. O. Schulte, PhD thesis, University of Stuttgart, 2005 Search PubMed.
- S. Shahid, J. A. R. Ball, C. G. Wells and P. Wen, IET Microw. Antennas Propag., 2011, 5, 426–432 CrossRef.
- A. Schweiger and G. Jeschke, Principles of Pulse Electron Paramagnetic Resonance, Oxford University Press, Oxford, 2001 Search PubMed.
- S. Lenz, K. Bader, H. Bamberger and J. van Slageren, Chem. Commun., 2017, 53, 4477–4480 RSC.
- C. Cervetti, A. Rettori, M. G. Pini, A. Cornia, A. Repolles, F. Luis, M. Dressel, S. Rauschenbach, K. Kern, M. Burghard and L. Bogani, Nat. Mater., 2016, 15, 164–168 CrossRef CAS PubMed.
- I. Tkach, A. Baldansuren, E. Kalabukhova, S. Lukin, A. Sitnikov, A. Tsvir, M. Ischenko, Y. Rosentzweig and E. Roduner, Appl. Magn. Reson., 2008, 35, 95–112 CrossRef CAS.
- S. Stoll and A. Schweiger, J. Magn. Reson., 2006, 178, 42–55 CrossRef CAS PubMed.
Footnotes |
| † Electronic supplementary information (ESI) available. See DOI: 10.1039/c9cc02184a |
| ‡ BDPA (α,γ-bisdiphenylene-β-phenylallyl), PMMA (poly(methylmethacrylate)), H2Pc and CuPc were obtained from commercial sources and used as received. Thin films of BDPA in PMMA were prepared by spin coating from toluene at 1200 rpm. Thin films of CuPc:H2Pc were prepared by thermal vapour deposition. Film thicknesses were determined by means of AFM measurements (Fig. S21–S31, ESI†). Resonators were characterized by means of an Anritsu ShockLine MS46322B vector network analyzer. Pulsed Q-band EPR measurements (νMW = 35.000 GHz) were performed on a homebuilt spectrometer25 equipped with an Oxford Instruments CF935 continuous flow Helium cryostat. Electron spin echo detected EPR spectra were simulated with the Matlab toolbox “EasySpin”26 (see also Fig. S19 and S20, ESI†). Microwave simulations were carried out by means of CST Microwave Studio. |
| This journal is © The Royal Society of Chemistry 2019 |


