 Open Access Article
Electrodeposition of indium from non-aqueous electrolytes†
Wouter
Monnens
 a,
Clio
Deferm
 b,
Jeroen
Sniekers
b,
Jan
Fransaer
b,
Jeroen
Sniekers
b,
Jan
Fransaer
 a and
Koen
Binnemans
 *b
*b
aKU Leuven, Department of Materials Engineering, Kasteelpark Arenberg 44, bus 2450, B-3001 Heverlee, Belgium
bKU Leuven, Department of Chemistry, Celestijnenlaan 200F, bus 2404, B-3001 Heverlee, Belgium. E-mail: Koen.Binnemans@kuleuven.be
First published on 4th April 2019
Abstract
The electrochemical behaviour and deposition of indium in electrolytes composed of 0.4 mol dm−3 In(Tf2N)3 and 0.4 mol dm−3 InCl3 in the solvents 1,2-dimethoxyethane and poly(ethylene glycol) (average molecular mass of 0.400 kg mol−1, PEG400) was investigated. Indium(I) was identified as the intermediate species that disproportionated to indium(III) and indium(0) nanoparticles. The presence of nanoparticles was verified by TEM analysis. SEM analysis showed that deposits obtained at room temperature from 1,2-dimethoxyethane were rough, while spherical structures were formed in PEG400 at 160 °C.
Indium is a technologically important metal that finds application in flat panel display devices as transparent indium tin oxide (ITO) electrodes, in various binary compound semiconductors, and in copper (indium, gallium) selenide (CIGS) solar cells.1,2 Electrodeposition of indium from aqueous electrolytes has been extensively studied, but the co-evolution of hydrogen gas leads to low current efficiencies.3–5 Electrodeposition of indium has also been investigated from non-aqueous electrolytes such as ionic liquids,6–9 deep-eutectic solvents10–13 and molten salts14,15 for electrowinning and formation of indium compounds. However, ionic liquids and deep-eutectic solvents are often very viscous at ambient temperatures, whereas the use of high-temperature molten salts consumes a lot of energy. Electrodeposition experiments on tetrabutylammonium tetrachloroindate(III) dissolved in dichloromethane gave indium particles rather than indium coatings.16 Very pure indium could be obtained by electrorefining in organic electrolytes based on organoindium compounds, but these electrolytes are very difficult to handle because of their extreme air-sensitivity.16
In this communication, the electrochemical behaviour and electrodeposition of indium from organic electrolytes composed of indium(III) chloride (InCl3) and indium(III) bis(trifluoromethanosulfonyl)imide (In(Tf2N)3) in 1,2-dimethoxyethane (DME, monoglyme) or poly(ethylene glycol) (average molecular mass of 0.400 kg mol−1, PEG400) is investigated. Glyme-based electrolytes exhibit desirable properties such as low viscosities, broad electrochemical windows and high thermal stabilities. Thus far, they have only been implemented in the development of electrolytes for lithium and magnesium batteries.16–20 The use of a mixture of two indium(III) salts, InCl3 and In(Tf2N)3, was inspired by the work on electrodeposition of magnesium, where MgCl2 was found to be poorly soluble in DME, but could be transformed into a highly soluble and electroactive species by the addition of Mg(Tf2N)2.20
An electrolyte was prepared that was composed of DME, 0.4 mol dm−3 of commercially available InCl3 and 0.4 mol dm−3 of In(Tf2N)3 (details on the synthesis of this compound can be found in ESI†). It was presumed that complexation occurred upon mixing the salts since InCl3 is poorly soluble in DME, whereas the combination of InCl3 and In(Tf2N)3 resulted in fast quantitative dissolution.
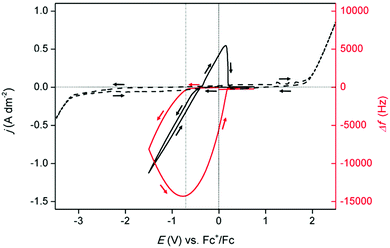
Preceding the electrochemical characterization of the prepared electrolyte, the electrochemical window of DME was measured to determine the potential range of operation. As pure DME is not electrically conductive, 0.5 mol dm−3 of carefully dried tetrabutylammonium tetrafluoroborate was added as an inert electrolyte. Tetra-alkylammonium salts are electrochemically very stable and are commonly used as supporting electrolyte in non-aqueous electrolytes.21 The measured electrochemical window of DME is shown in Fig. 1 (left axis, dashed line). The anodic limit of the solvent was found to be approximately +2.0 V vs. Fc+/Fc, while the cathodic limit was at −3.0 V vs. Fc+/Fc. A cyclic voltammogram (CV) of the prepared indium-containing electrolyte measured on a platinum-coated quartz crystal at room temperature is shown in Fig. 1 (left axis, full line). Distinctive, characteristic features for the electrodeposition and subsequent stripping of bulk metal were observed. The onset potential of the reduction current is positioned at −0.4 V vs. Fc+/Fc, and is ascribed to the reduction of trivalent indium ions:
| In(III) + 3e− ⇌ In(0) E0 = −0.34 V vs. SHE | (1) |
| In(III) + 2e− ⇌ In(I) E0 = −0.44 V vs. SHE | (2) |
| In(I) + e− ⇌ In(0) E0 = −0.14 V vs. SHE | (3) |
The absence of a limiting current indicates that this system is not mass-diffusion controlled. This points to a high mobility of the indium species towards the working electrode. After reversal of the scan direction, an anodic peak current was observed, which was attributed to stripping of the deposited indium.
Further insight into the mechanism of deposition and stripping of indium was obtained via a measurement with an electrochemical quartz crystal microbalance (EQCM). Herein, the frequency response, Δf, of the platinum-coated quartz crystal was monitored during the measurement of the CV (Fig. 1, right axis). The onset of the reduction current, at −0.4 V vs. Fc+/Fc in the forward scan, was not immediately accompanied by a change in the frequency signal. Hence, no deposition occurred. As DME is electrochemically stable, the occurring reduction process likely involved indium species. Indium(I) is an intermediate that has been described in various electrochemical studies.7,14 Furthermore, the standard reduction potentials of the In(III)/In(0) and In(III)/In(I) redox couples are close to each other: −0.34 V vs. SHE and −0.44 V vs. SHE, respectively.23 Therefore, it was assumed that the occurring process is the reduction from indium(III) to indium(I). Starting from −0.7 V vs. Fc+/Fc in the forward scan, a negative shift in the frequency signal was observed, indicating reduction of indium(III) to indium(0), and the reduction of indium(I) to indium(0). The largest shift, corresponding to the largest quantity of deposited indium, was reached at approximately −0.7 V vs. Fc+/Fc in the backward scan (indicated by the vertical dotted line). Between −0.7 V vs. Fc+/Fc and −0.4 V vs. Fc+/Fc, the frequency shift is negative, meaning that the indium deposits dissolve, while the current in the CV is still negative. In this region, two reactions occur, namely, the reduction of indium(III) to indium(I), and the stripping of deposited indium to indium(I). The net total current due to both processes is negative. At potentials more positive than −0.4 V vs. Fc+/Fc, the reduction of indium(III) to indium(I) no longer takes place but the oxidation of previously deposited indium to indium(I) continues, hence the current is positive. After the current falls to zero, a small negative Δf remains, which implies that a quantity of unstripped indium is left on the crystal. Conceivably, indium forms alloys with the platinum electrode of the EQCM crystal, which are not oxidized in the imposed potential region.22 The cathodic current efficiency (CCE) of the deposition process was calculated by taking the ratio of the charge and equalled 114%. Naturally this is an overestimation. (details regarding the calculation of the CCE and the explanation regarding the overestimation can be found in ESI,† together with an m/z vs. potential plot, constructed using the presented EQCM data in Fig. 1).
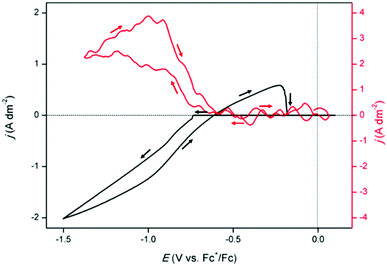
To investigate the formation of indium(I) during reduction and oxidation, a rotating ring disk (RRDE) experiment was performed (Fig. 2). A CV was measured at room temperature at a slow scan rate of 5 mV s−1 on the gold disk, whereas a constant potential of +1.0 V vs. Fc+/Fc was applied on the gold ring, while rotating at 200 rpm. In principle, the indium(I) formed at the central disk is spun outwards towards the outer ring and subsequently oxidized to indium(III). It was observed that the ring current density ring immediately increased when the reduction current in the CV initiated, at −0.7 V vs. Fc+/Fc, demonstrating the occurrence of the reduction of indium(III) to indium(I). Starting from −0.9 V vs. Fc+/Fc in the forward scan, increase in the current density on the ring gradually lessened. As the EQCM experiment suggested, at larger cathodic overpotentials, formed indium(I) further reduces to indium(0), forming deposits on the disk, and is therefore not spun outwards and captured on the ring. Between −0.9 V vs. Fc+/Fc and −0.6 V vs. Fc+/Fc in the backward scan, the ring current density starts to decrease. In this region, indium(I) is formed due to reduction of indium(III), and also due to oxidation of deposited indium. The net current of both processes is once more negative. However, the ring current completely drops to zero when the oxidation current in the CV initiates. Hence, no indium(I) if formed. It is postulated that the occurring processes during this oxidation current peak are oxidation of indium(I), formed during stripping, to indium(III), and possibly also stripping of remaining indium(0) to indium(III). It was observed that the solution colour slowly changed from pale yellow to black (see ESI†). It has been demonstrated that indium(I) can undergo a disproportionation reaction:14
| 3In(I) ⇌ 2In(0) + In(III) | (4) |
The morphology and elemental composition of the indium deposits were studied by scanning electron microscopy (SEM) (Fig. 3). Indium was electrodeposited on a platinum plate at a constant potential of −1.5 V vs. Fc+/Fc for a period of 1 h, at room temperature. The deposits were composed of rough shaped structures that fully covered the surface of the substrate (EDX spectrum is included in ESI†).
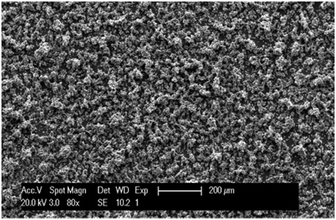 | ||
| Fig. 3 SEM image of indium deposited on a platinum working electrode at −1.5 V vs. Fc+/Fc at room temperature for 1 h from 0.4 mol dm−3 of In(Tf2N)3 and 0.4 mol dm−3 of InCl3 in DME. | ||
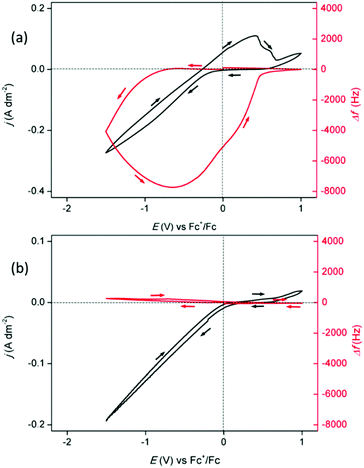
An additional electrolyte was prepared that was composed of 0.4 mol dm−3 of In(Tf2N)3 and 0.4 mol dm−3 of InCl3 in PEG400. PEG400 has the advantage that it has a much higher boiling point (290 °C) than DME (85 °C) so that PEG400 can be used for electrodeposition of indium above its melting point (156.6 °C). Fig. 4a shows the CV of the PEG400 electrolyte, recorded on a platinum-coated quartz crystal at 100 °C with EQCM analysis. It was observed that the onset of the reduction current, at −0.27 V vs. Fc+/Fc in the forward scan, was not immediately accompanied by a change in frequency. Most probably, the reduction of indium(III) to indium(I), and the subsequent disproportionation to indium(III) and indium(0) nanoparticles, occurred in this potential region. From −0.9 V vs. Fc+/Fc in the forward scan to −0.65 V vs. Fc+/Fc in the backward scan, a significant negative shift in the frequency signal appeared, indicating the deposition of indium. Accumulation of the anodic current, starting from −0.65 V vs. Fc+/Fc in the backward scan, led to a positive shift in the frequency signal, indicating the stripping of deposited indium. The small increase in current which arises after the stripping wave was attributed to the anodic decomposition of PEG400 (the electrochemical window of PEG400 is included in ESI†). The cathodic current efficiency of the deposition process was calculated and equalled 81%.
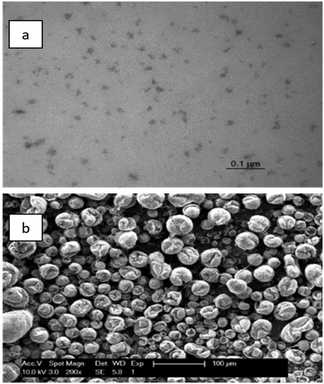
Fig. 4b shows the CV of the PEG400 electrolyte, recorded on a platinum-coated quartz crystal at 160 °C with EQCM analysis. A noteworthy reduction current was observed from 0.0 V vs. Fc+/Fc in the forward scan to 0.0 V vs. Fc+/Fc in the backward scan, yet the frequency signal remained nearly stagnant. Hence, negligible deposition takes place throughout the reduction wave. Therefore, the main occurring process is the reduction of indium(III) to indium(I). No anodic current is observed as no indium is deposited and indium(I) disproportionates to indium(III) and indium(0) nanoparticles. It was observed that the colour of the electrolyte darkened throughout the measurement. This was attributed to the formation of nanoparticles. To verify their formation, the spent, black electrolyte was collected after the measurement. It was diluted with acetone and dried on a 300 mesh Formvar/carbon coated copper grid. Analysis using transmission electron microscopy (TEM) indicated the presence of irregularly shaped agglomerates of indium nanoparticles (Fig. 5a).
Fig. 5b shows a SEM micrograph of indium deposits obtained by applying a high constant current of −1.0 A dm−2 for 1 h at 160 °C, on a molybdenum electrode. Besides nanoparticles, a small amount of spherical indium particles were obtained that are dimpled on their surface. These indium droplets become dimpled during solidification of the molten indium upon cooling because of the change in density.
In conclusion, the electrochemical behaviour of indium(III) in DME and PEG400 was investigated at room temperature and 160 °C, respectively. It is postulated that mixing both InCl3 and In(Tf2N)3 salts in the organic solvents leads to the formation of an electroactive complex. During reduction, both the reduction from indium(III) to indium(0) and from indium(III) to indium(I) was demonstrated. Indium(I) subsequently reacts to indium(III) and indium(0) through a disproportionation reaction. Indium(0) species in solution agglomerate forming nanoparticles. SEM analysis showed rough deposits from the DME-based electrolyte at room temperature, whereas spherical deposits were obtained from the PEG400 electrolyte at 160 °C. The observations that MgCl2 + Mg(Tf2N)2 can be used for electrodeposition of magnesium20 and InCl3 + In(Tf2N)3 for electrodeposition of indium suggest that MClx + M(Tf2N)x are versatile electrolytes for electrodeposition of metals that cannot be obtained from aqueous electrolytes, or only with poor current efficiency.
The authors acknowledge financial support from the European Research Council (ERC) under the European Union's Horizon 2020 Research and Innovation Programme: Grant Agreement 694078—Solvometallurgy for critical metals (SOLCRIMET).
Conflicts of interest
There are no conflicts to declare.Notes and references
- U. Schwarz-Schampera and P. M. Herzig, Indium: Geology, mineralogy, and economics, Springer Science & Business Media, 2002 Search PubMed.
- F. Ullmann, W. Gerhartz, Y. S. Yamamoto, F. T. Campbell, R. Pfefferkorn and J. F. Rounsaville, Ullmann's encyclopedia of industrial chemistry, VCH publishers, 1985 Search PubMed.
- F. C. Walsh and D. R. Gabe, Surf. Technol., 1979, 8, 87–99 CrossRef CAS.
- Y. Traore, S. Legeai, S. Diliberto, G. Arrachart, S. Pellet-Rostaing and M. Draye, Electrochim. Acta, 2011, 58, 532–540 CrossRef CAS.
- R. Piercy and N. A. Hampson, J. Appl. Electrochem., 1975, 5, 1–15 CrossRef CAS.
- M. Yang and I. Sun, J. Chin. Biochem. Soc., 2004, 51, 253–260 CrossRef CAS.
- J. Estager, P. Nockemann, K. R. Seddon, G. Srinivasan and M. Swadźba-Kwaśny, ChemSusChem, 2012, 5, 117–124 CrossRef CAS PubMed.
- M. Matsumiya, M. Sumi, Y. Uchino and I. Yanagi, Sep. Purif. Technol., 2018, 201, 25–29 CrossRef CAS.
- S. Z. El Abedin, A. Y. Saad, H. K. Farag, N. Borisenko, Q. X. Liu and F. Endres, Electrochim. Acta, 2007, 52, 2746–2754 CrossRef.
- E. Barrado, S. García, J. A. Rodriguez and Y. Castrillejo, J. Electroanal. Chem., 2018, 823, 106–120 CrossRef CAS.
- J. C. Malaquias, M. Steichen, M. Thomassey and P. J. Dale, Electrochim. Acta, 2013, 103, 15–22 CrossRef CAS.
- M. F. Rahman, R. Bernasconi and L. Magagnin, J. Optoelectron. Adv. Mater., 2015, 17, 122–126 CAS.
- A. A. C. Alcanfor, L. P. M. dos Santos, D. F. Dias, A. N. Correia and P. de Lima-Neto, Electrochim. Acta, 2017, 235, 553–560 CrossRef CAS.
- M. K. Carpenter and M. W. Verbrugge, J. Mater. Res., 1994, 9, 2584–2591 CrossRef CAS.
- U. Anders and J. A. Plambeck, Can. J. Chem., 1969, 47, 3055–3060 CrossRef CAS.
- P. N. Bartlett, D. Cook, C. H. K. de Groot, A. L. Hector, R. Huang, A. Jolleys, G. P. Kissling, W. Levason, S. J. Pearce and G. Reid, RSC Adv., 2013, 3, 15645–15654 RSC.
- R. E. Doe, R. Han, J. Hwang, A. J. Gmitter, I. Shterenberg, H. D. Yoo, N. Pour and D. Aurbach, Chem. Commun., 2014, 50, 243–245 RSC.
- D. Sharon, D. Hirshberg, M. Afri, A. A. Frimer and D. Aurbach, Chem. Commun., 2017, 53, 3269–3272 RSC.
- S. A. Freunberger, Y. Chen, N. E. Drewett, L. J. Hardwick, F. Bardé and P. G. Bruce, Angew. Chem., Int. Ed., 2011, 50, 8609–8613 CrossRef CAS PubMed.
- Y. Cheng, R. M. Stolley, K. S. Han, Y. Shao, B. W. Arey, N. M. Washton, K. T. Mueller, M. L. Helm, V. L. Sprenkle and J. Liu, Phys. Chem. Chem. Phys., 2015, 17, 13307–13314 RSC.
- H. O. House, E. Feng and N. P. Peet, J. Org. Chem., 1971, 36, 2371–2375 CrossRef CAS.
- W. G. Moffatt, The Handbook of Binary Phase Diagrams, General Electric Company, Corporate Research and Development, Technology Marketing Operation, 1981 Search PubMed.
- W. M. Haynes, CRC handbook of chemistry and physics, CRC press, Boca Raton, 92nd edn, 2011 Search PubMed.
Footnote |
| † Electronic supplementary information (ESI) available: Experimental methods, synthesis of electrolytes, cathodic current efficiency calculations using experimental EQCM data, EDS spectrum of deposits and images of the electrolytes. See DOI: 10.1039/c8cc10254f |
| This journal is © The Royal Society of Chemistry 2019 |

