
 Open Access Article
 This Open Access Article is licensed under a Creative Commons Attribution-Non Commercial 3.0 Unported Licence
Analyzing the scaffold immune microenvironment using flow cytometry: practices, methods and considerations for immune analysis of biomaterials
Kaitlyn
Sadtler
 ab and
Jennifer H.
Elisseeff
*cd
ab and
Jennifer H.
Elisseeff
*cd
aKoch Institute for Integrative Cancer Research, Department of Chemical Engineering, Massachusetts Institute of Technology, Cambridge, MA, USA
bDepartment of Anesthesia and Critical Care Medicine, Boston Children's Hospital, Harvard Medical School, Boston, MA, USA
cTranslational Tissue Engineering Center, Wilmer Eye Institute, Department of Biomedical Engineering, Johns Hopkins University School of Medicine, Baltimore, MD, USA. E-mail: jhe@jhu.edu
dBloomberg∼Kimmel Institute for Cancer Immunotherapy, Johns Hopkins University School of Medicine, Baltimore, MD, USA
First published on 19th August 2019
Abstract
The immune system has evolved as a powerful tool for our body to combat infections, and is being engineered for new treatments in cancer and autoimmune disease. More recently, the complex role of the immune system is being recognized in tissue repair, regenerative medicine and biomaterial responses. From these combined interests, the field of immunoengineering is rapidly growing. However, bridging immunology with engineering poses numerous challenges including the biological complexity, language of immunology and accurately leveraging the powerful techniques of immunology to new applications. Elucidating the identity and function of immune cell populations responding to engineering systems will be required for continued advancement. Multi-color flow cytometry is a central technique used by immunologists for this purpose that requires careful control of variables, data acquisition, and interpretation. Here, we present methods for multi-color flow cytometry experimental design and analysis focused on characterizing the scaffold immune microenvironment in regenerative medicine research.
1. Introduction
Any material that is implanted within the body will elicit an immune response through a process described as the foreign body response. First described in the 1980s by James Anderson, this entails protein adsorption to the surface of the implanted device, followed by neutrophil and macrophage recruitment, an attempt to degrade the material, then fusion of macrophages into foreign body giant cells, recruitment of fibroblasts and deposition of a dense fibrotic capsule around the device.1–3 This occurs at a different extent on different materials, owing to their surface chemistry, stiffness, degradability, and other yet to be elucidated factors.4 With certain applications, such as pacemakers, drug delivery devices, or the needles of insulin pumps, the desired reaction to an implant is either ignorance or tolerance. However, with other materials, such as those used in regenerative medicine, an immune response is desired to help integrate the scaffold with the surrounding tissue and grow new tissue.5 In development of materials for either purpose, it is necessary to analyze the immune environment created by the implanted material. To this extent a variety of techniques have been employed ranging from microscopy to gene expression. Over the past several years, engineers have been adopting specific techniques used and expanded by translational immunologists, including flow cytometry.Flow cytometry is a critical tool in the study of the immune system.6 This tool can create a description of the scaffold immune microenvironment of multiple tissues on a quantitative level at a single-cell resolution. Beyond analysis, this technique can be used to isolate specific cell types for sequencing or gene expression (RT-PCR/probe-based) on a population or single-cell level. Flow cytometry has been used widely in the immunology community since the late 1980s and early 1990s and has been advancing to expand the complexity and reliability of analysis.7 For many years, stem cells have been the focus of biomaterial analysis in regenerative medicine. In depth lineage tracing of stem cells is not general practice in the biomaterials fields but is required for accurate identification of specific immune cells.
With the rising appreciation of the immune system in tissue engineering and regenerative medicine, biomaterials researchers are beginning to implement flow cytometry in the analysis of biomaterials response. There is a significant need for implementation of consistent methodologies to avoid inaccuracies in experimental techniques and analysis. Application to biomaterial scaffolds also introduces specific concerns for analyzing tissue engineered constructs and materials that are not addressed with standard immunologic practices that have been primarily focused on infectious disease and cancer. An approach involving spatial characterization with immunohistochemistry or immunofluorescence, and flow cytometry providing a quantitative description of the immune microenvironment provides a more complete description of the interactions of the scaffold with the surrounding tissue and immune cells. Here, we present an in-depth approach to analyzing biomaterial scaffolds with flow cytometry, focusing on murine models but applicable to clinical samples.
2. Methods & discussion
2.1. Cell isolation methods
A general rule is to use the gentlest cell isolation method that will still result in a clean single-cell suspension for subsequent staining and analysis. These isolation methods generally fall into both enzyme-based and chelation-based cell isolation. In most cases, a matrix-degrading enzyme will be required to free the cells from the extracellular matrix (ECM).8 If isolating cells from the blood or a lavage (such as a peritoneal lavage), utilization of gentle chelation with filtration will suffice – but if the tissue is dense, with strong fibrosis or collagen deposition, or an ECM-based or collagen-based scaffold, then the sample requires a collagenase to degrade the surrounding tissue. If looking for abundant low-adherence cells (ex. lymphocytes in central lymphoid organs like the spleen or lymph nodes) then mechanical disruption through a sieve/strainer and re-straining after centrifugation will decrease preparation time and provide enough cells for analysis. It is critical to realize that different digestion protocols may enrich for certain cell population or specific cell populations may be lost, biasing the resulting data.| Enzymea | Working concentration | Tissues |
|---|---|---|
| a Trypsin should not be used for FACS digestion as it will degrade many surface proteins. | ||
| Dispase | 1–2 U ml−1 | Various (mainly soft) |
| Collagenase type I | 100–200 U ml−1 | Various |
| Liberase TL | 0.25–0.5 mg ml−1 | Soft tissues, low density collagen (ex. muscle, spleen) |
| Liberase TM | 0.1–0.5 mg ml−1 | High density collagen (ex. skin) |
| DNase I | 0.1 mg ml−1 | All |
In combination with these methods, there are other mechanical separation approaches that can assist in isolation of cells, including commercially available processors such as the gentleMACS Dissociator, which can be programmed to dice and, in some models, heat samples for simultaneous mechanical and enzymatic separation.23,24
2.2. Fluorophore selection & panel design
When designing a new antibody panel, especially for flow cytometry beginners, it is important to minimize the number of fluorophores per panel. This decreases error due to compensation issues, and provides and a robust signal. The general rule of thumb is that if it is possible to split the sample into two panels and not lose any information (if you have enough cells and are not relying on co-expression of many markers), then split the sample into two panels. One example is detecting different general cell populations. It would be easiest to create a myeloid and lymphoid panel for general screening as opposed to trying to fit all of the markers into one larger (10+ color) panel. Scaffolds can elicit a broad range of immune responses, and design of larger more intricate panels will rely on proper pilot testing with lower color panels.Selection of the proper number of markers to describe a cell type will depend on the experience with cytometry, as well as the amount of specificity and detail that is desired. For example, using only CD11b to define macrophages will result in quantification of in general myeloid cells, which can be mostly macrophages, however will also include neutrophils, eosinophils, and other cell types. Using CD11b and F4/80 will further key down to macrophages, but, eosinophils can express low levels of F4/80, so macrophages must be “F4/80hi”. Frequently, staining blood and tissue samples, researchers will use Gr1 which includes both Ly6G and Ly6C. In that case, evaluation of monocytes (Ly6ChiLy6G−) and neutrophils (Ly6C+Ly6G+) is determined by Gr1hiversus Gr1+.34 The more markers that can be included in a panel, the more confident you can be that the cells of interest are the cells you are detecting.
We have included examples of flow cytometry panels that have been in use and validated in skin, muscle, and intraperitoneal implant models which can be found in Table 2. These panels should all be validated with antibody titers, fluorescence minus one (FMO) controls, and isotype controls on the specific samples and flow cytometers to ensure proper data acquisition.
| 7 Color panel | |||
|---|---|---|---|
| Lymphoid phenotyping | Myeloid phenotyping | ||
| Antibody | Marker for: | Antibody | Marker for: |
| CD45 BV421 | Immune cells | CD45 BV421 | Immune cells |
| CD19 BV510 | B cell | Ly6G BV510 | Neutrophils |
| CD8a AF488 | Cytotoxic T (CTL) | Ly6C AF488 | Monocytes |
| NKp46 PE | NK cell | CD11c PE | Dendritic cells |
| CD4 PE/Cy7 | T helper (Th) | F4/80 PE/Cy7 | Macrophage |
| CD3 APC | T cell | SiglecF APC | Eosinophils |
| Viability eFluor780 | Dead cells | Viability eFluor780 | Dead cells |
| 14 Color panel | |||
|---|---|---|---|
| Lymphoid phenotyping | Myeloid phenotyping | ||
| Antibody | Marker for: | Antibody | Marker for: |
| Note: optimization and adjustments, as discussed in the text, should be completed for each study to ensure validity of results.a Myeloid cells are very autofluorescent, this allows to negative gate and remove them from lymphoid analyses.b NK1.1 is not present in BALB/c mice, panel used for C57BL/6 mice.c Intracellular antigen. | |||
| IgD BUV395 | Mature B cells | CD86 BUV395 | “M1” macrophage |
| CD45 BUV737 | Immune cells | CD45 BUV737 | Immune cells |
| TcRb BV421 | ab T cell | CD8a BV421 | Cross-presenting DCs |
| CD38 BV510 | Plasmablasts | Ly6G BV510 | Neutrophils |
| NK1.1 BV605b | NK cell | Siglec F BV605 | Eosinophils |
| IgM BV786 | Immature/early B cells | MHCII BV786 | Antigen presentation to Th |
| CD8a AF488 | Cytotoxic T (CTL) | Ly6C AF488 | Monocytes |
| CD4 PerCP/Cy5.5 | T helper (Th) | CD11c PerCP/Cy5.5 | Dendritic cells (DCs) |
| NKp46 PE | NK cell | CD206 PE | “M2” macrophage |
| CD19 PE/594 | B cell | CD197 PE/594 | Lymph node-homing |
| CD3 PE/Cy7 | T cell | F4/80 PE/Cy7 | Macrophage |
| FoxP3 APCc | Treg | CD200R3 APC | Basophils & mast cells |
| CD11b AF700a | Myeloid | CD11b AF700 | Myeloid |
| Viability eFluor780 | Dead cells | Viability eFluor780 | Dead cells |
![[thin space (1/6-em)]](https://www.rsc.org/images/entities/char_2009.gif) :100–1:500 (antibody:buffer) when staining. To titer the antibodies, you will need to acquire samples that act as both a positive control, and well as your sample of interest. If the sample of interest is a precious or difficult to obtain sample, titers can be done on tissues such as spleen or lymph node, but will need to follow-up with pilot staining an actual sample alongside positive control tissue to ensure proper staining. Titers are frequently calculated against a cell count of one million (1 × 10⁶) cells per sample. Each antibody should be tested in a dilution series, for example 1:100, 1:200, 1:300, 1:400 and 1:500. Further optimization of staining can be tested after an initial dilution series. The dilution selected should represent a concentration that displays an obvious separation in positive versus negative populations, but not beyond the saturation point of the antibody. For markers that experience a shift in expression as opposed to a binary positive/negative,38 the same protocol is applied but the dilution that is selected is based on the peak staining. To this extent, positive controls with known expression of the marker of interest are critical.
:100–1:500 (antibody:buffer) when staining. To titer the antibodies, you will need to acquire samples that act as both a positive control, and well as your sample of interest. If the sample of interest is a precious or difficult to obtain sample, titers can be done on tissues such as spleen or lymph node, but will need to follow-up with pilot staining an actual sample alongside positive control tissue to ensure proper staining. Titers are frequently calculated against a cell count of one million (1 × 10⁶) cells per sample. Each antibody should be tested in a dilution series, for example 1:100, 1:200, 1:300, 1:400 and 1:500. Further optimization of staining can be tested after an initial dilution series. The dilution selected should represent a concentration that displays an obvious separation in positive versus negative populations, but not beyond the saturation point of the antibody. For markers that experience a shift in expression as opposed to a binary positive/negative,38 the same protocol is applied but the dilution that is selected is based on the peak staining. To this extent, positive controls with known expression of the marker of interest are critical.
2.3. Intracellular cytokine staining & stimulation
| Component | Concentration |
|---|---|
| a Cocktails containing these 4 components at proper concentrations are commercially available. | |
| PMA | 20 ng ml−1a |
| Ionomycin | 1 μg ml−1a |
| Brefeldin A | 5 μg ml−1a |
| Monensin | 5 μg ml−1a |
| Fetal bovine serum | 10.0% |
| Non-essential amino acids | 1.0% |
| 2-Mercaptoethanol | 55 μM |
| Sodium pyruvate | 1 mM |
| L-Glutamine | 2 mM |
| HEPES | 20 mM |
2.4. Specific considerations for cell types
As myeloid cells tend to reside on more of a spectrum, it is very difficult to find markers that accurately stain all cell types that you are hoping to classify. One example is the case of peripheral blood-derived (blood monocyte-derived) versus tissue-resident macrophages.46 In mice, a standard peripheral blood-derived macrophage marker is F4/80; however, F4/80 will not stain many tissue-resident macrophages. Other markers used to identify tissue-resident macrophages include CD169, CD68, CD209, and others. Some tissue-resident macrophages express markers associated with other cells.47 Alveolar macrophages express Siglec-F (commonly associated with eosinophils) and many others express CD11c (associated with dendritic cells). Monocytes that have extravasated and matured to macrophages in the tissue can also be characterized via the expression of Ly6C, CD43, CCR2, CD115, and CX3CR1.48
Furthermore, functional assessments of myeloid cells can also be performed via flow cytometry. For example, evaluation of phagocytosis potential can be evaluated through incubation with fluorescent microparticles that can be measured simultaneously with surface marker phenotyping on a flow cytometer.49 Cells can be exposed to fluorescent microparticles both in vivo and in vitro depending upon the experimental setup.
Examples of several publications with their digestion enzymes and selected markers for myeloid and lymphoid cell identification from in vivo samples can be found in Table 4.
| Publication | Tissue | Material | Digestion | Cells of interest/markers |
|---|---|---|---|---|
| Ballestas et al., Acta Biomater., 201927 | Oral mucosa (oronasal fistula) | PCL & PLGA nanofibers | Collagenase I (1 mg ml−1) | Myeloid: CD11b, Ly6C, CD64, MerTK, CD206 |
| Li et al., Nat. Mater., 201821 | Subcutaneous implant | PEI adsorbed to mesoporous silica rods | Collagenase IV (250 U ml−1) | Dendritic cells: CD11c, CD86, CCR7 and SIINFEKL/H-2Kb |
| Sadtler et al., Biomaterials, 201829 | Subcutaneous implant and muscle (injury) | ECM particles, PEG-DA hydrogel, PE particles | Liberase TL (0.5 mg ml−1) + DNase I (0.2 mg ml−1) | Myeloid: CD45, CD11b, CD11c, Ly6C, Ly6G, F4/80, CD86, CD206, MHCII. Lymphoid: CD3, CD19, NK1.1 |
| Headen et al., Nat. Mater., 201850 | Kidney capsule (+spleen, lymph node) | Maleimide-terminated four-arm poly(ethylene) glycol microgels | Liberase TL | T Cell: CD3, CD4, CD8, CD62L, CD44, CD25, FoxP3 |
| Vegas et al., Nat. Med., 201625 | Subcutaneous and intraperitoneal implants | Alginate hydrogels | gentleMACS Dissociator and 2 mM EDTA | Myeloid: CD68, Ly6G, CD11b. Lymphoid: CD19, IgM, CD8, NK1.1 |
2.5. Selecting proper controls
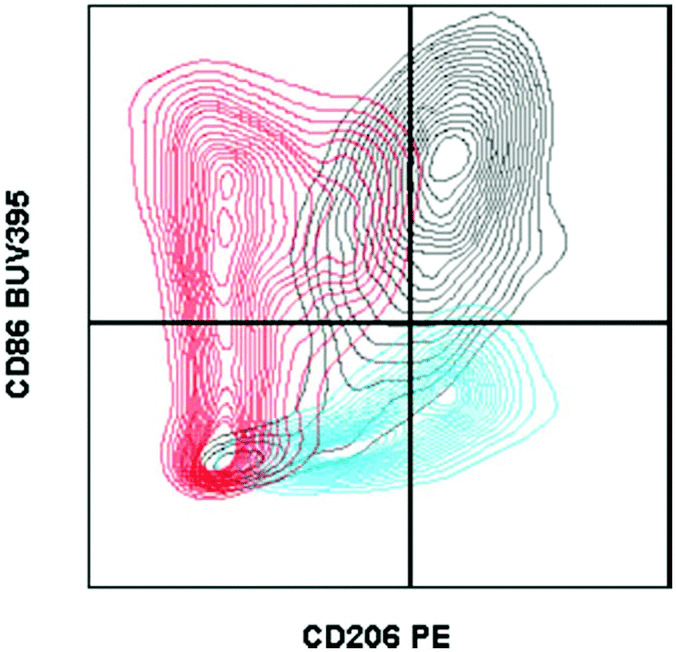 | ||
| Fig. 1 Fluorescence minus one controls on macrophages from biomaterial implant. Example of two fluorescence minus one controls gated against the full-stained sample. A fluorescence minus one control is a sample stained with every antibody of the tested panel except for the marker that the control is evaluating. Cells isolated from a C57BL/6 (Jackson Labs) murine muscle injury (using Liberase TL digestion) were stained with the antibody panel described in Table 2. CD206 FMO = red. CD86 FMO = blue. Full stained sample = black. | ||
In the context of material implantation, such controls are critical as there is often phagocytosis of particles (from the scaffold or surrounding tissue damage) that will increase cellular autofluorescence. Furthermore, as there is still relatively little known about the identity and behavior of these cells from different locations, each model or material may have different background signals and signal intensity which can change what is considered negative versus positive.
2.6. Analysis
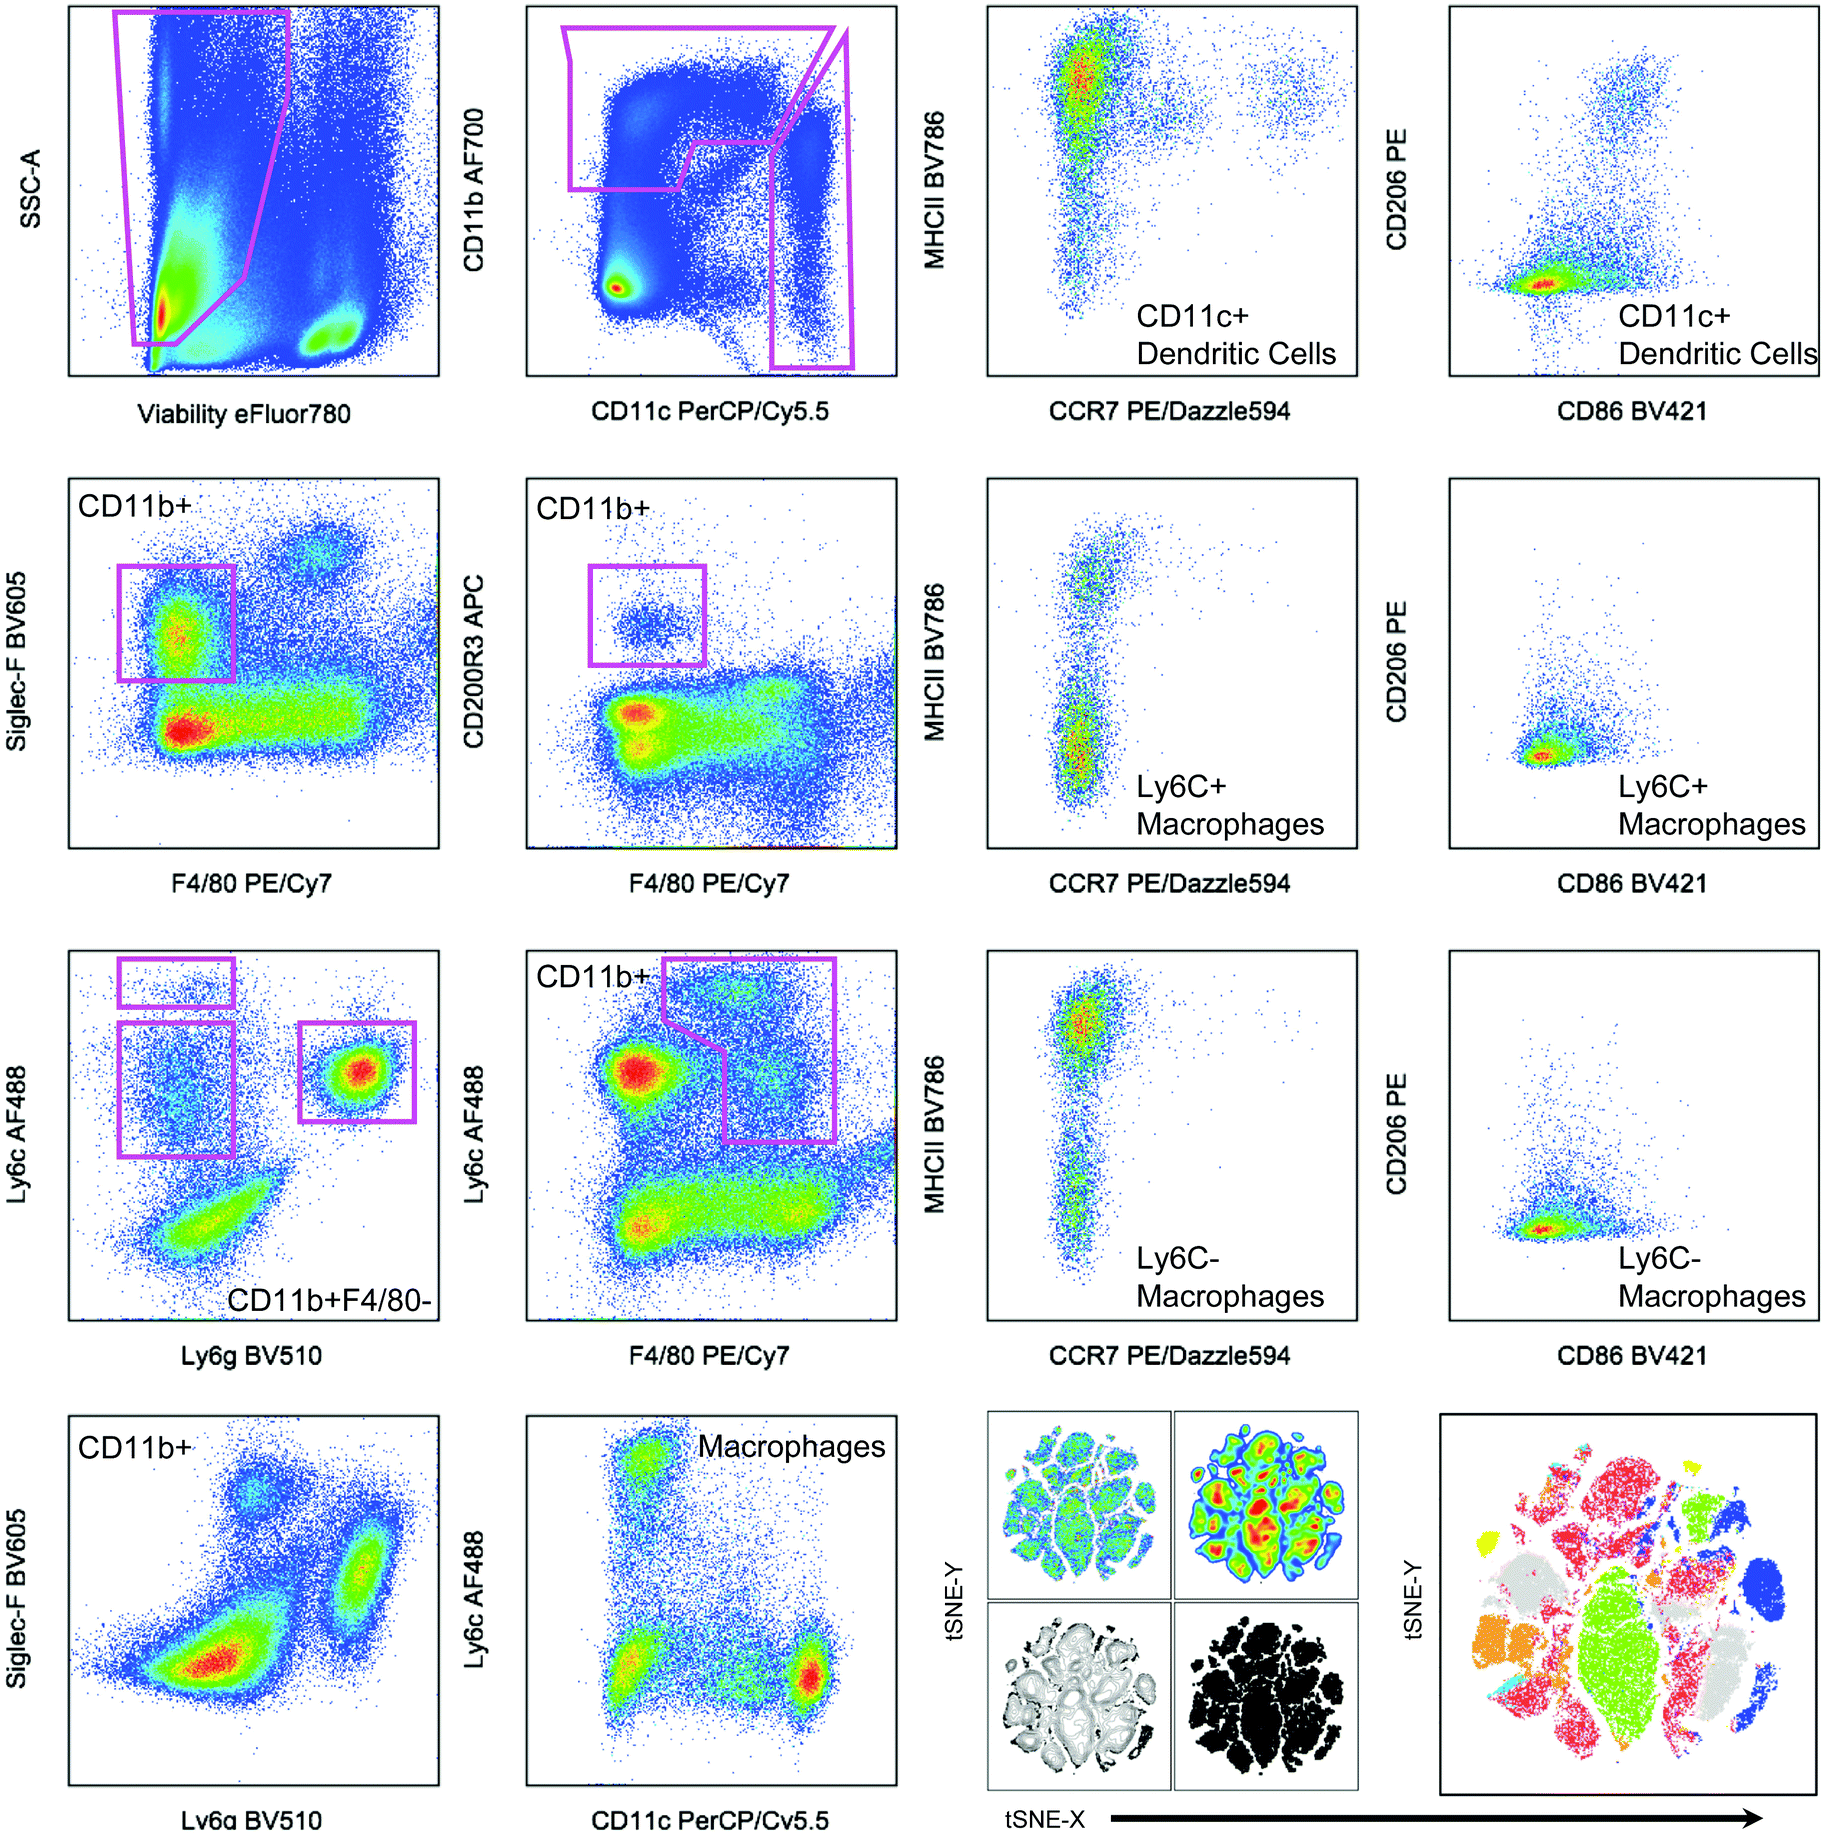 | ||
| Fig. 2 Hand gating and dimensionality-reduction algorithms used on 14-color myeloid panel. Cells isolated from the spleen of a tumor bearing mouse as a control for panel development. C57BL/6 (Jackson Labs) murine spleen cells, isolated with Liberase TL digestion, were stained with the antibody panel described in Table 2. Samples were then gated based on controls (example of FMO shown in Fig. 1). tSNE clustering was performed with the following parameters: iterations – 1000, perplexity – 20, eta/learning rate – 200, theta – 0.05. | ||
2.7. Long-term experiments
In some cases, researchers will be conducting studies over multiple years that relate to each other. In this scenario, it is important to carry over enough controls throughout the study to ensure validity of data and ability to compare across different timepoints. To control for any lot-to-lot variability of antibodies or drifting of PMT (photomultiplier tube) voltages on the flow cytometer due to servicing or unforeseen issues with laser power, one technique is to utilize control samples such as PMT beads to ensure that the voltage aligns with the proper fluorescence intensity read on the detector.56 Using these beads, which are used to calibrate the machine or for compensation purposes, will give a signal that is independent of any biologic variability, and yield a bookmark for confirming the setup of the machine over a longitudinal study.When working in animal models, it is important to include biological controls that can be used to compare across timepoints and serve for monitoring shifts in fluorescence intensity via fold change of MFI. These would include sham surgical controls for implantation or injury studies, as well as control implants if a material is being modified. Percent positive measurements are more reliable across longitudinal studies as compared to MFI as they are not as sensitive to shifts in the mean of the population. However, if sham and control implants are included for each study, fold changes of MFI over the control sample provide an alternative when MFI is the proper measurement (i.e. shifts in expression as opposed to binary on/off signal). Through the use of these controls, data can be acquired and analyzed reliably over long-term studies without concern for technical deviations in instrumentation or reagents.
2.8. Data reporting
As with many techniques, proper data reporting is critical for peer review and complete transparency and communication of conclusions. When including flow cytometry data in a manuscript, best practices are to include examples of your gating strategies used to identify cell populations, controls such as FMOs especially for low-intensity markers or highly autofluorescent cells, and example dot plots of the data from which you have derived any dot- or bar graphs.3. Conclusions
Flow cytometry is a powerful technique that is growing in importance in the fields of tissue engineering and regenerative medicine. Modifications of standard protocols are necessary when considering the immune environment of scaffolds, which can differ greatly from responses to infections or malignancies. As such, attentiveness at all stages of panel design, cell isolation, data acquisition, and analysis are necessary to properly gather and interpret data. As we any method, validation of results using other experimental modalities is critical.Benefits of flow cytometry, including protein- and cell-level analysis for the immune cell (and other) populations in the scaffold microenvironment, does come with limitations. At this time, higher-end cytometers advertise simultaneous detection of 50 parameters on cells; however, this is confounded by compensation and spectral overlap variables, and limited based on reagent availability. Advances in technologies have led to the innovation of so-called “spectral” cytometers that remove spectral overlap through evaluation of the emission spectra of a given fluorophore as opposed to a percent-based overlap of signals of fluorophores into other detectors. Nevertheless, there is a limitation on parameters of analysis that can be overcome by combining flow cytometry, specifically sorting capabilities, with bulk and single-cell sequencing. Cytometers can sort single cells into wells for sequencing in a well-based single cell format, or sort populations that can be further processed by microfluidic-based sequencing platforms. After sequencing, any results on the gene expression level can be further validated through a second flow cytometry assay or other protein-level assay such as ELISA. Such sorting techniques can also be combined with ELISA, proteomics, or western blots directly to measure protein secretion, proteome, or specific phosphorylation events that are best suited for molecular biology analyses.
As previously mentioned, there is a loss of location-specific data that cannot be learned from flow cytometry alone. Therefore, quantitative characterization of the immune cell environment, couple with immunofluorescence or histologic evaluations can synergize to yield both a quantitative and structural view of the environment. Imaging has also been combined simultaneously with flow cytometers, through imaging flow cytometers (IFC) that provide single-cell images of stained cells. Such cytometers can gather information regarding cell morphology and localization of protein expression that would be lost with a standard cytometer. These methods have been used in comparison of cancerous and non-cancerous cells,57 discriminating different stages of apoptosis and necrosis,58 and even classifying phytoplankton.59
Further expansion of utilizing these techniques in combination with imaging modalities and molecular biology platforms will promote a thorough understanding of the immune interactions with materials in both pre-clinical and clinical testing (Fig. 3). These examinations will both characterize developed materials as well as uncover fundamental biologic processes involved in device implantation and tissue engineering that may be exploited for future therapeutics.
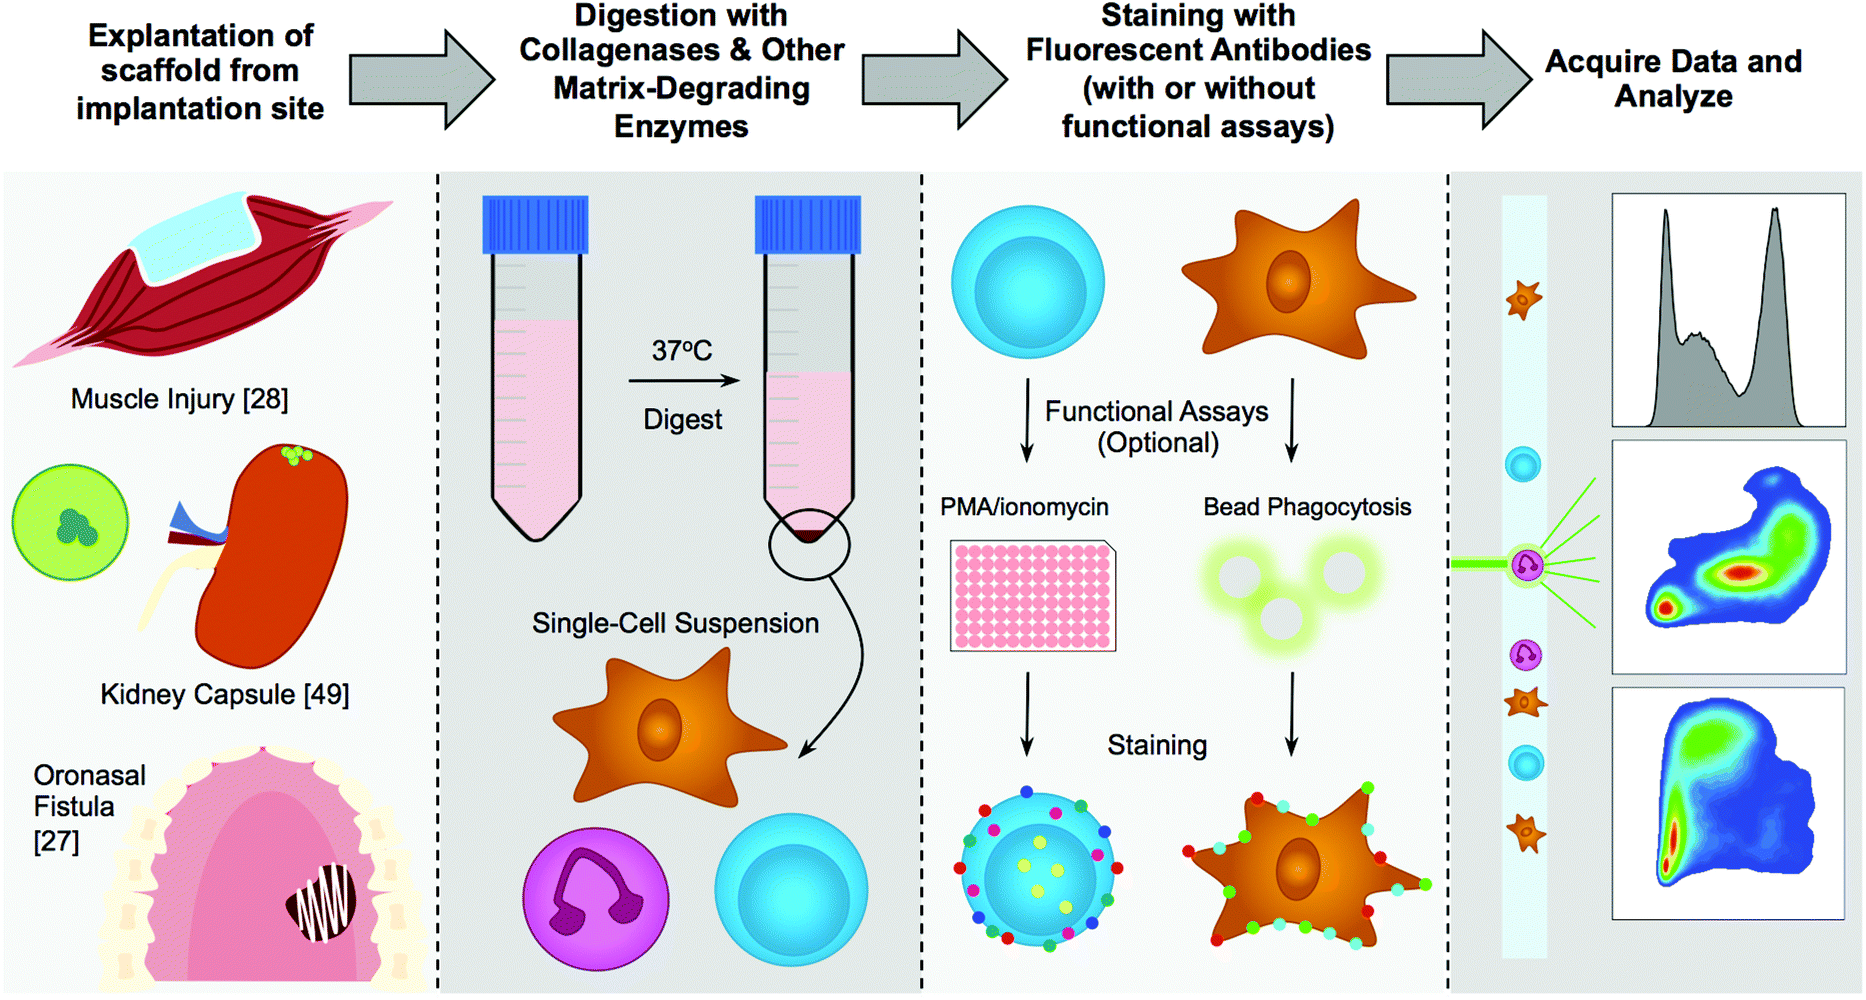 | ||
| Fig. 3 An overview of flow cytometry on biomaterial scaffolds. The tissue is explanted, finely diced, then digested with a matrix-degrading enzyme (commonly collagenases), followed by optional stimulation of T cells for intracellular cytokine staining or other functional assays such as phagocytosis of fluorescent beads by macrophages, then samples are run on a cytometer and data is analyzed via hand gating or analytic algorithms. | ||
Ethics statement
All procedures described in this manuscript were reviewed and approved by the Committee for Animal Care at Johns Hopkins University School of Medicine or the Massachusetts Institute of Technology in accordance with the guidelines set forth by IACUC.Conflicts of interest
There are no conflicts of interest to declare.Acknowledgements
The authors acknowledge the following financial support: J. E. was supported by the Morton Goldberg Professorship, the Bloomberg∼Kimmel Institute for Cancer Immunotherapy, and grants from the Department of Defense. K. S. was supported by the Ruth L. Kirschstein NRSA Postdoctoral Fellowship #1F32EB025688-01A1 from the National Institute of Biomedical Imaging and Bioengineering of the National Institutes of Health.References
- N. P. Ziats, K. M. Miller and J. M. Anderson, Biomaterials, 1988, 9, 5–13 CrossRef CAS PubMed.
- J. M. Anderson, A. Rodriguez and D. T. Chang, in Seminars in immunology, Elsevier, 2008, vol. 20, pp. 86–100 Search PubMed.
- J. M. Anderson and K. M. Miller, Biomaterials, 1984, 5, 5–10 CrossRef CAS PubMed.
- W. G. Brodbeck, M. S. Shive, E. Colton, Y. Nakayama, T. Matsuda and J. M. Anderson, J. Biomed. Mater. Res., 2001, 55, 661–668 CrossRef CAS PubMed.
- S. F. Badylak, J. E. Valentin, A. K. Ravindra, G. P. McCabe and A. M. Stewart-Akers, Tissue Eng., Part A, 2008, 14, 1835–1842 CrossRef CAS PubMed.
- G. Radcliff and M. J. Jaroszeski, in Flow Cytometry Protocols, Springer, 1998, pp. 1–24 Search PubMed.
- L. A. Herzenberg, D. Parks, B. Sahaf, O. Perez, M. Roederer and L. A. Herzenberg, Clin. Chem., 2002, 48, 1819–1827 CAS.
- K. Vermaelen and R. Pauwels, Cytometry, Part A, 2004, 61, 170–177 CrossRef PubMed.
- A. E. Cardona, D. Huang, M. E. Sasse and R. M. Ransohoff, Nat. Protoc., 2006, 1, 1947 CrossRef CAS PubMed.
- B. Weigmann, I. Tubbe, D. Seidel, A. Nicolaev, C. Becker and M. F. Neurath, Nat. Protoc., 2007, 2, 2307 CrossRef CAS PubMed.
- L. Wilson, C. Fathke and F. Isik, BioTechniques, 2002, 32, 548–551 CrossRef CAS PubMed.
- N. Seach, K. Wong, M. Hammett, R. L. Boyd and A. P. Chidgey, J. Immunol. Methods, 2012, 385, 23–34 CrossRef CAS PubMed.
- W. Thiele, M. Rothley, A. Schmaus, D. Plaumann and J. Sleeman, Lymphology, 2014, 47, 177–186 CAS.
- M. Iannacone, E. A. Moseman, E. Tonti, L. Bosurgi, T. Junt, S. E. Henrickson, S. P. Whelan, L. G. Guidotti and U. H. Von Andrian, Nature, 2010, 465, 1079 CrossRef CAS PubMed.
- J. C. Nussbaum, S. J. Van Dyken, J. Von Moltke, L. E. Cheng, A. Mohapatra, A. B. Molofsky, E. E. Thornton, M. F. Krummel, A. Chawla and H.-E. Liang, Nature, 2013, 502, 245 CrossRef CAS PubMed.
- A. R. Harris, J. X. Yuan and J. M. Munson, Methods, 2018, 134, 20–31 CrossRef PubMed.
- A. Mohapatra, S. J. Van Dyken, C. Schneider, J. C. Nussbaum, H.-E. Liang and R. M. Locksley, Mucosal Immunol., 2016, 9, 275–286 CrossRef CAS PubMed.
- J. R. Rock, C. E. Barkauskas, M. J. Cronce, Y. Xue, J. R. Harris, J. Liang, P. W. Noble and B. L. M. Hogan, Proc. Natl. Acad. Sci. U. S. A., 2011, 108, E1475–E1483 CrossRef CAS PubMed.
- D. H. D. Gray, A. P. Chidgey and R. L. Boyd, J. Immunol. Methods, 2002, 260, 15–28 CrossRef CAS PubMed.
- T. Später, F. S. Frueh, R. M. Nickels, M. D. Menger and M. W. Laschke, J. Biol. Eng., 2018, 12, 24 CrossRef PubMed.
- A. W. Li, M. C. Sobral, S. Badrinath, Y. Choi, A. Graveline, A. G. Stafford, J. C. Weaver, M. O. Dellacherie, T.-Y. Shih and O. A. Ali, Nat. Mater., 2018, 17, 528 CrossRef CAS PubMed.
- M. Abuzakouk, C. Feighery and C. O'Farrelly, J. Immunol. Methods, 1996, 194, 211–216 CrossRef CAS PubMed.
- M. Jungblut, K. Oeltze, I. Zehnter, D. Hasselmann and A. Bosio, J. Visualized Exp., 2008, e1029 Search PubMed.
- M. Jungblut, K. Oeltze, I. Zehnter, D. Hasselmann and A. Bosio, J. Visualized Exp., 2008, 22, e1029 Search PubMed.
- A. J. Vegas, O. Veiseh, M. Gürtler, J. R. Millman, F. W. Pagliuca, A. R. Bader, J. C. Doloff, J. Li, M. Chen and K. Olejnik, Nat. Med., 2016, 22, 306 CrossRef CAS PubMed.
- D. M. Mosser and J. P. Edwards, Nat. Rev. Immunol., 2008, 8, 958 CrossRef CAS PubMed.
- S. A. Ballestas, T. C. Turner, A. Kamalakar, Y. C. Stephenson, N. J. Willett, S. L. Goudy and E. A. Botchwey, Acta Biomater., 2019, 91, 209–219 CrossRef CAS PubMed.
- K. Sadtler, K. Estrellas, B. W. Allen, M. T. Wolf, H. Fan, A. J. Tam, C. H. Patel, B. S. Luber, H. Wang and K. R. Wagner, Science, 2016, 352, 366–370 CrossRef CAS PubMed.
- K. Sadtler, M. T. Wolf, S. Ganguly, C. A. Moad, L. Chung, S. Majumdar, F. Housseau, D. M. Pardoll and J. H. Elisseeff, Biomaterials, 2019, 192, 405–415 CrossRef CAS PubMed.
- K. Sadtler, B. W. Allen, K. Estrellas, F. Housseau, D. M. Pardoll and J. H. Elisseeff, Tissue Eng., Part A, 2017, 23, 1044–1053 CrossRef CAS PubMed.
- K. Sadtler, S. D. Sommerfeld, M. T. Wolf, X. Wang, S. Majumdar, L. Chung, D. S. Kelkar, A. Pandey and J. H. Elisseeff, in Seminars in immunology, Elsevier, 2017, vol. 29, pp. 14–23 Search PubMed.
- J. M. Wentworth, G. Naselli, W. A. Brown, L. Doyle, B. Phipson, G. K. Smyth, M. Wabitsch, P. E. O'Brien and L. C. Harrison, Diabetes, 2010, 59, 1648–1656 CrossRef CAS PubMed.
- J. Helft, J. Böttcher, P. Chakravarty, S. Zelenay, J. Huotari, B. U. Schraml, D. Goubau and C. R. e Sousa, Immunity, 2015, 42, 1197–1211 CrossRef CAS PubMed.
- S. Rose, A. Misharin and H. Perlman, Cytometry, Part A, 2012, 81, 343–350 CrossRef PubMed.
- ThermoFisher Scientific, Fluorescence SpectraViewer, https://www.thermofisher.com/order/spectra-viewer.
- BD Biosciences, BD Spectrum Viewer, http://www.bdbiosciences.com/en-us/applications/research-applications/multicolor-flow-cytometry/product-selection-tools/spectrum-viewer.
- BioLegend, Fluorescence Spectra Analyzer, https://www.biolegend.com/en-us/spectra-analyzer.
- O. D. Perez, P. O. Krutzik and G. P. Nolan, in Flow Cytometry Protocols, Springer, 2004, pp. 67–94 Search PubMed.
- M. T. Wolf, S. Ganguly, T. L. Wang, C. W. Anderson, K. Sadtler, R. Narain, C. Cherry, A. J. Parrillo, B. V. Park and G. Wang, Sci. Transl. Med., 2019, 11, eaat7973 CrossRef CAS PubMed.
- A. A. Pollice, J. Philip Mccoy Jr., S. E. Shackney, C. A. Smith, J. Agarwal, D. R. Burnolt, L. E. Janocko, F. J. Hornicek, S. G. Singh and R. J. Hartsock, Cytometry, 1992, 13, 432–444 CrossRef CAS PubMed.
- J. S. Collins and T. H. Goldsmith, J. Histochem. Cytochem., 1981, 29, 411–414 CrossRef CAS PubMed.
- H. Y. Lan, P. Hutchinson, G. H. Tesch, W. Mu and R. C. Atkins, J. Immunol. Methods, 1996, 190, 1–10 CrossRef CAS PubMed.
- M. J. Bevan, R. Epstein and M. Cohn, J. Exp. Med., 1974, 139, 1025–1030 CrossRef CAS PubMed.
- H. Sengeløv, L. Kjeldsen and N. Borregaard, J. Immunol., 1993, 150, 1535–1543 Search PubMed.
- F. Li, M. Yang, L. Wang, I. Williamson, F. Tian, M. Qin, P. K. Shah and B. G. Sharifi, J. Immunol. Methods, 2012, 386, 101–107 CrossRef CAS PubMed.
- S. Gordon, A. Plüddemann and F. Martinez Estrada, Immunol. Rev., 2014, 262, 36–55 CrossRef CAS PubMed.
- L. C. Davies, S. J. Jenkins, J. E. Allen and P. R. Taylor, Nat. Immunol., 2013, 14, 986 CrossRef CAS PubMed.
- L. Ziegler-Heitbrock, P. Ancuta, S. Crowe, M. Dalod, V. Grau, D. N. Hart, P. J. M. Leenen, Y.-J. Liu, G. MacPherson and G. J. Randolph, Blood, 2010, 116, e74–e80 CrossRef CAS PubMed.
- J. A. Steinkamp, J. S. Wilson, G. C. Saunders and C. C. Stewart, Science, 1982, 215, 64–66 CrossRef CAS PubMed.
- D. M. Headen, K. B. Woodward, M. M. Coronel, P. Shrestha, J. D. Weaver, H. Zhao, M. Tan, M. D. Hunckler, W. S. Bowen and C. T. Johnson, Nat. Mater., 2018, 17, 732 CrossRef CAS PubMed.
- J. W. Tung, D. R. Parks, W. A. Moore, L. A. Herzenberg and L. A. Herzenberg, Clin. Immunol., 2004, 110, 277–283 CrossRef CAS PubMed.
- Y. Saeys, S. Van Gassen and B. N. Lambrecht, Nat. Rev. Immunol., 2016, 16, 449 CrossRef CAS PubMed.
- H. Zare, P. Shooshtari, A. Gupta and R. R. Brinkman, BMC Bioinformatics, 2010, 11, 403 CrossRef PubMed.
- E. Lugli, M. Roederer and A. Cossarizza, Cytom. Part A, 2010, 77, 705–713 CrossRef PubMed.
- C. E. Pedreira, E. S. Costa, Q. Lecrevisse, J. J. M. van Dongen, A. Orfao and E. Consortium, Trends Biotechnol., 2013, 31, 415–425 CrossRef CAS PubMed.
- S. P. Perfetto, D. Ambrozak, R. Nguyen, P. Chattopadhyay and M. Roederer, Nat. Protoc., 2006, 1, 1522–1530 CrossRef CAS PubMed.
- D. A. Basiji, W. E. Ortyn, L. Liang, V. Venkatachalam and P. Morrissey, Clin. Lab. Med., 2007, 27, 653–670 CrossRef PubMed.
- T. C. George, D. A. Basiji, B. E. Hall, D. H. Lynch, W. E. Ortyn, D. J. Perry, M. J. Seo, C. A. Zimmerman and P. J. Morrissey, Cytom. Part A J. Int. Soc. Anal. Cytol., 2004, 59, 237–245 CrossRef PubMed.
- H. M. Sosik and R. J. Olson, Limnol. Oceanogr. Methods, 2007, 5, 204–216 CrossRef.
- W. B. Corporation, Worthington Biochemical Online Tissue Dissociation Guide, http://www.worthington-biochem.com/tissuedissociation/basic.html Search PubMed.
| This journal is © The Royal Society of Chemistry 2019 |