DOI:
10.1039/C9BM00255C
(Paper)
Biomater. Sci., 2019,
7, 2421-2429
Site-dependent fluorescence enhanced polymers with a self-restricted GFP chromophore for living cell imaging†
Received
16th February 2019
, Accepted 12th March 2019
First published on 14th March 2019
Abstract
The β-barrel structure of green fluorescent protein (GFP) provides a confined environment to enhance its fluorescence efficiency. Inspired by the unique structure of GFP, we reported a self-restricted GFP chromophore analogue which was rationally grafted onto the middle or the terminal of poly(ethylene glycol)-block-poly(N-isopropyl acrylamide) (PEG-b-PNIPAM) via click chemistry to obtain PEG-GA-PNIPAM and PEG-PNIPAM-GA (GA: MeOBDPI). These structures were characterized through NMR, GPC, and FT-IR. By varying the length of PNIPAM and the location of the GFP chromophore, self-assembly behaviour and fluorescence intensity were correspondingly changed. PEG-GA-PNIPAM and PEG-PNIPAM-GA were assembled into nano-sized spherical micelles above the low critical solution temperature (LCST). The size of the micelles increased with the length of the PNIPAM block. These optical properties were carefully evaluated by UV-Vis and fluorescence spectroscopy. The results indicated that increasing the length of the PNIPAM block enhanced the fluorescence in water, and PEG-PNIPAM74-GA has more remarkable fluorescence intensity than PEG-GA-PNIPAM106 in living cells such as MCF-7 cells. Furthermore, the fluorescence behaviour of PEG-PNIPAM74-GA was studied in MCF-7 cells and L929 cells. The result showed that PEG-PNIPAM74-GA was mostly located in the cytoplasm. Compared with the CellTracker™ Red CMTPX dye, it could enter into MCF-7 cells and L929 cells more easily in DMEM with 10% FBS. Therefore, PEG-PNIPAM74-GA has potential application prospects for living cell imaging.
Introduction
Due to its unique and outstanding fluorescence properties, green fluorescent protein (GFP) has been used as a bio-optical marker in many areas such as molecular biology and medicine during the past decade.1–4 The GFP chromophore (GFPc), formed from the Ser-Tyr-Gly tripeptide motif through autocatalytic cyclization and dehydration/oxidation, is located in a β-barrel secondary structure.5 Once it is surrounded by this confined micro-environment, free rotation of GFPc will be prevented and the fluorescence quantum yield will be extremely enhanced.6–8 Inspired by the restriction-induced emission of GFPc, various bio-mimicking fluorescence enhancement strategies have been developed. For example, the BF2 entity,9–11 hydrogen bond12,13 and Zn2+ coordination14–16 were used to lock GFPc analogues in order to resist the free rotation of the C–C (φ) bond and the C![[double bond, length as m-dash]](https://www.rsc.org/images/entities/char_e001.gif) C (τ) bond. Meanwhile, some rigid structures with nano-sized cavities also attracted great attention, such as supramolecular hosts,6 proteins,17 RNAs18 and MOFs.19,20 They reserved a confined environment for the encapsulation of GFPc. Besides, our group recently developed another promising strategy to mimic the structure of a β-barrel by amphiphilic self-assembly. The self-assembled micelles restrict the chromophore and enhance the fluorescence intensity of GFPc.21–24
C (τ) bond. Meanwhile, some rigid structures with nano-sized cavities also attracted great attention, such as supramolecular hosts,6 proteins,17 RNAs18 and MOFs.19,20 They reserved a confined environment for the encapsulation of GFPc. Besides, our group recently developed another promising strategy to mimic the structure of a β-barrel by amphiphilic self-assembly. The self-assembled micelles restrict the chromophore and enhance the fluorescence intensity of GFPc.21–24
Herein, we introduced a self-restricted GFPc analogue into the thermosensitive block copolymer. When GFPc is chemically modified with blockage groups at the molecular level, free rotation will be restricted. The emission of GFPc will be enhanced by the self-restricted effect. Therefore, a series of self-restricted GFPc analogues have been synthesized in our laboratory and the optical properties have been fully characterized.25 Among these GFPc analogues, 2,5-MeOBDPI in which the 2 and 5 positions of the phenyl ring of GFPc are modified by two methoxy substituents and imidazolinone is modified with an alkynyl group shows the highest fluorescence quantum yield (∼18.2% in DMSO). Therefore, it was chosen as an optimized GFPc for the construction of thermosensitive fluorescence enhanced polymeric systems.
Stimuli-responsive polymers show great potential for applications in many fields including drug delivery26–28 and cell imaging.29,30 Among them, poly(N-isopropyl acrylamide) (PNIPAM) is one of the most widely studied thermosensitive polymers. It will transform from hydrophilic to hydrophobic when the temperature is above its low critical solution temperature (LCST).31,32 Moreover, the LCST of PNIPAM can be adjusted by the degree of polymerization or copolymer block components.33–35 Benefitting from low-cytotoxicity and long circulation, polyethylene glycol (PEG) served as a hydrophilic block to copolymerize with PNIPAM. PEG-b-PNIPAM will be a unimolecule below the LCST and aggregates above the LCST. Due to thermo-responsiveness and programmability of PNIPAM, it served as a block to construct a responsive restricted environment for GFPc. In this work, we grafted the self-restricted GFP chromophore analogue 2,5-MeOBDPI (GA) onto the middle or the terminal of PEG-b-PNIPAM via click chemistry to obtain PEG-GA-PNIPAM and PEG-PNIPAM-GA. Combined with the self-restricted effect and the self-assembled confined environment, the fluorescence intensity could be enhanced greatly (Fig. 1). By adjustment of the location of 2,5-MeOBDPI and the length of PNIPAM, we studied different self-assembly behaviors and fluorescence properties in water. The fluorescence behavior of the polymers was also studied in living cells. It has the potential to optimize the parameters for living cell imaging.
 |
| | Fig. 1 Schematic representation of polymers with the self-restricted GFP chromophore contained in different locations. | |
Experimental
Materials
2,5-Dimethylbenzaldehyde (98%), epichlorohydrin (99%), 2-chloropropionyl chloride (96%) and tris(2-aminoethyl)amine were purchased from Alfa Aesar. Sodium azide (AR) and poly(ethylene glycol) monomethyl ether (Mn = 2000) were bought from Sigma-Aldrich, 2-propynylamine was purchased from Accela ChemBio Co. Ltd, and sodium hydroxide (NaOH), dimethylformamide (DMF) and tetrahydrofuran (THF) were purchased from Lingfeng Chemical Reagent Co., Ltd. Ethanol (EtOH), anhydrous diethyl ether, ammonium chloride (NH4Cl), magnesium sulfate (MgSO4), triethylamine (TEA), CuBr and other common reagents were all provided by Sinopharm Reagent Co., Ltd.
Characterization
Fourier transform infrared (FT-IR) spectroscopy was performed using a PerkinElmer Spectrum 100 spectrophotometer in the range of 4500–400 cm−1. 1H NMR and 13C NMR spectra were recorded using a Varian MERCURY plus-400 spectrometer at 298 K. Gel permeation chromatography (GPC) was carried out on a Tosoh HLC-8320GPC system. UV-Vis absorption spectra were obtained using a PerkinElmer Lambda 35 UV-Vis spectrometer in the range of 300–650 nm. Fluorescence emission spectra were obtained using a PTI QM/TM/IM steady-stated and time-resolved fluorescence spectrofluorometer in the range of 410–750 nm. Dynamic light scattering (DLS) measurements were carried out using a Malvern Zetasizer Nano ZS90 apparatus at 45 °C. Transmission electron microscopy (TEM) was performed on a Tecnai G2 spirit BioTwin instrument. Cell imaging was performed by using a Leica TCS SP8 STED 3X microscope at an excitation wavelength of 405 nm.
Sample preparation
Synthesis of chromophore GA.
The synthetic routes of chromophore GA have been reported in our group's previous work25 (see the ESI†).
Synthesis of amphiphilic block polymer PEG-N3-PNIPAM.
With PEG-N3-Cl as a macroinitiator, atom transfer radical polymerization (ATRP) was carried out to obtain PEG-N3-PNIPAM. PEG-N3-Cl (0.4 g, 0.2 mmol, see the ESI†) and NIPAM (1.808 g, 16 mmol or 3.390 g, 30 mmol) were dissolved in DMF (4 mL) under a nitrogen protection in a 50 mL flask. Subsequently, Me6TREN (54 μL, 0.2 mmol) was added to the solution. CuCl (20 mg, 0.2 mmol) was added before degassing the solution by nitrogen purge, and polymerization was performed at 30 °C for 10 h. DMF was removed by distillation under reduced pressure. To remove the copper complex, residues were redissolved in THF and purified by aluminum oxide column chromatography. The solution was concentrated and precipitated using −20 °C diethyl ether three times. The collected product was dried at 40 °C in a vacuum for 24 h and a white solid was obtained (yield 54%, 56%). 1H NMR (400 MHz, CDCl3, 298 K): δ (ppm): 6.72–6.07 (br, –CHNHCO–), 3.99 (br, –CHNHCO–), 3.74–3.43 (br, –OCH2CH2O–), 3.37 (s, CH3O–), 2.71 (br, –CH2CHCONH–), 2.38–1.51 (br, –CH2CHCONH–), 1.13 (br, –CH(CH3)2). 13C NMR (100 MHz, CDCl3, 298 K): δ (ppm): 174.8, 77.6, 77.3, 77.0, 72.1, 70.7, 59.2, 42.6, 41.5, 35.5, 29.9, 22.8. IR (KBr): 3436, 3309, 3070, 2972, 2930, 2875, 2104, 1648, 1545, 1459, 1386, 1367, 1252, 1172, 1131, 1110, 953, 881, 840, 668 cm−1.
Synthesis of fluorescent PEG-GA-PNIPAM.
Under a nitrogen protection, PEG-N3-PNIPAM59 (400 mg, 0.05 mol) or PEG-N3-PNIPAM106 (750 mg, 0.05 mol), PMDETA (12 μL, 0.055 mmol), and the GFPc analogue (GA, 2,5-MeOBDPI) (16 mg, 0.055 mmol) were dissolved in DMF (5 mL) in a 50 mL flask. CuBr (9 mg, 0.063 mmol) was added and degassed by N2 purge, and then the polymerization was carried out at 50 °C for 24 h. DMF was distilled under reduced pressure, and then CH2Cl2 was added to the residues. The mixture was filtered. Then it was precipitated into −20 °C diethyl ether, filtered and the residue was dissolved in CH2Cl2. The above-mentioned procedure was repeated three times. Dry precipitation was carried out at 40 °C for 12 h in a vacuum oven to obtain a yellow powder solid (yield 70%). 1H NMR (400 MHz, CDCl3, 298 K): δ (ppm): 6.82–5.97 (br, –CHNHCO–), 3.99 (br, –CHNHCO–), 3.76–3.43 (br, –OCH2CH2O–), 3.37 (s, CH3O–), 2.71 (br, –CH2CHCONH–), 2.38–1.51 (br, –CH2CHCONH–), 1.13 (br, –CH(CH3)2). IR (KBr): 3436, 3305, 3079, 2972, 2925, 2875, 2856, 2106, 1647, 1549, 1460, 1386, 1368, 1244, 1172, 1131, 1111, 953, 841, 694, 519 cm−1.
Synthesis of amphiphilic block polymer PEG-PNIPAM-N3.
PEG-Cl was used as a macroinitiator for the controlled synthesis of PEG-PNIPAM-N3 through ATRP. PEG-Cl (0.2 g, 0.1 mmol, see the ESI†) and NIPAM (1.696 g, 15 mmol) were dissolved in DMF (3 mL) in a 50 mL flask. Subsequently, Me6TREN (27 μL, 0.1 mmol) and CuCl (11 mg, 0.11 mmol) were added to the solution and degassed by N2 purge. This was carried out at 50 °C for 48 h. Then, NaN3 (0.052 g, 0.8 mmol) was added. The solution was stirred continuously at 50 °C for another 48 h in the open air. DMF was removed under reduced pressure, and CH2Cl2 was added to the mixture. The mixture was filtered. Then it was precipitated in cold diethyl ether, filtered, dissolved using CH2Cl2 and condensed. The above-mentioned procedure was repeated three times. Finally, the product was dried at 40 °C for 12 h in a vacuum oven to obtain a white powder solid (yield 58%). 1H NMR (400 MHz, CDCl3, 298 K): δ (ppm): 4.08–3.92 (br, –CHNHCO–), 3.81–3.52 (br, –OCH2CH2O–), 3.37 (s, CH3O–), 2.08–1.74 (br, –CH2CHCONH–), 1.75–1.52 (br, –CH2CHCONH–), 1.14 (br, –CH(CH3)2). IR (KBr): 3436, 3298, 3076, 2934, 2877, 2126, 1650, 1548, 1387, 1368, 1280, 1250, 1172, 1153, 1131, 1111, 989, 952, 929, 884, 841, 684 cm−1.
Synthesis of fluorescent polymer PEG-PNIPAM-GA.
Under a nitrogen protection, PMDETA (12 μL, 0.055 mmol), PEG-PNIPAM-N3 (750 mg, 0.05 mol), and GA (70 mg, 0.055 mmol) were dissolved in DMF (5 mL) in a flask. CuBr (9 mg, 0.063 mmol) was added and degassed, and then the polymerization was carried out at 50 °C for 24 h. DMF was distilled under reduced pressure, and then CH2Cl2 was added to the residues. The mixture was filtered. Then it was precipitated into −20 °C diethyl ether, filtered and the residue was dissolved in CH2Cl2. The above-mentioned procedure was repeated three times. Dry precipitation was carried out at 40 °C for 12 h in a vacuum oven to obtain a yellow powder solid (yield 80%). 1H NMR (400 MHz, CDCl3, 298 K): δ (ppm): 4.08–3.92 (br, –CHNHCO–), 3.81–3.52 (br, –OCH2CH2O–), 3.37 (s, CH3O–), 2.08–1.74 (br, –CH2CHCONH–), 1.75–1.52 (br, –CH2CHCONH–), 1.14 (br, –CH(CH3)2). IR (KBr): 3435, 3293, 3079, 2973, 2929, 2876, 1648, 1550, 1460, 1386, 1368, 1282, 1249, 1172, 1155, 1131, 1108, 953, 884, 841, 661 cm−1.
Cell culture and internalization
L929 cells (mouse fibroblast cell line) and MCF-7 cells (human breast cancer cell line) were purchased from ATCC (American Type Culture Collection). L929 cells and MCF-7 cells were cultured in a culture dish at 37 °C with 5% CO2 in DMEM with 10% FBS and 1% antibiotics (100 units per mL penicillin and 100 units per mL streptomycin). After culturing for 12 h, DMEM was removed and the cells were washed with PBS buffer three times. 1 mL of PBS solution of PEG-GA-PNIPAM, PEG-PNIPAM-GA or commercial dyes with different concentrations was added to each well. The cells were incubated at 37 °C for 30 min and then the solution was removed. Cell imaging was observed by using a STED microscope.
Cytotoxicity measurements
A MTT viability assay against MCF-7 and L929 cells was performed to determine the cytotoxicity of PEG-PNIPAM74-GA. In 96-well plates, the cells were cultured with a density of 8 × 10³ cells in 200 mL DMEM in each well. After 12 h, 50 μL of PBS solution of PEG-PNIPAM74-GA with different concentrations were added to the wells and the cells were cultured for another 24 h. 20 μL MTT assay stock solution of 5 mg mL−1 was then added. 4 h later, the solution was removed and 200 μL DMSO was added. After vibrating for 10 min, a BioTek Synergy H4 instrument was used to measure the wavelength absorbance of the solution at 490 nm.
Results and discussion
GFP has been commonly applied as a bio-optical marker. But its fluorescence decreases sharply with the collapse of the β-barrel structure. Due to its special self-restricted effect, chromophore GA shows a high fluorescence quantum yield in nonpolar solvents according to our group's previous work.25 However, with the addition of water, the fluorescence decreases with red shift obviously. Inspired by the luminescence principle of GFP, chromophore GA was linked to PEG-N3-PNIPAM or PEG-PNIPAM-N3 and amphiphilic block copolymers, to improve the solubility and imitate the β-barrel structure to provide an additional confined environment when it self-assembles. In addition, the denaturation of GFP at high temperature reduces its fluorescence and limits its use under the conditions of high temperature. So PNIPAM, a widely studied thermo-sensitive polymer, was chosen as the hydrophobic segment to make the system have temperature-dependent optical properties. What's more, to increase the biocompatibility of the polymer, PEG was used as the hydrophilic segment. In consideration of the decrease of fluorescence of the chromophore GA with the addition of water to DMSO, we synthesized PEG-N3-PNIPAM as the amphiphilic block copolymer to reduce the aggregation of the chromophore when the polymer self-assembles. In the meantime, PEG-PNIPAM-N3 was synthesized as a contrast.
Synthesis and characterization of PEG-GA-PNIPAM and PEG-PNIPAM-GA
The main synthesis route for PEG-GA-PNIPAM and PEG-PNIPAM-GA is shown in Schemes S1 and S2.† Firstly, chromophore GA which has been reported25 was synthesized through 2,3-cycloaddition. Secondly, PEG-CHOCH2 was synthesized through the Williamson reaction. Then an azide group was introduced from sodium azide in order to be conjugated with the propargyl terminated chromophore GA. Next, PEG-N3-Cl was synthesized through the substitution reaction between 2-chloropropanoyl chloride and PEG-N3-OH. Subsequently, PEG-N3-PNIPAM was synthesized by ATRP. As the amount of NIPAM changed in the reaction, PEG-N3-PNIPAM with two degrees of polymerization of NIPAM was obtained. Finally, PEG-GA-PNIPAM was synthesized through the click reaction between PEG-N3-PNIPAM and GA in a CuBr/PMDETA catalyst system. As for the synthesis of PEG-PNIPAM-GA, firstly, PEG-Cl was prepared through the substitution reaction of 2-chloropropanoyl chloride and PEG. Then PEG-PNIPAM-Cl was prepared by ATRP. Having obtained the azide group from sodium azide, PEG-PNIPAM-N3 reacted with chromophore GA in a CuBr/PMDETA catalyst system to obtain PEG-PNIPAM-GA through the click reaction.
1H and 13C MNR spectra were obtained to characterize the structures of the polymers (Fig. S1–S11†). The 1H MNR spectra of PEG-N3-OH and PEG-N3-Cl were tested in DMSO-d6, while others were tested in CDCl3. For PEG-CHOCH2 (Fig. S2†), the signals at 3.82–3.39 ppm show the methylene groups of PEG, and those at 3.37 ppm are from the terminal methyl group. The signals of 2.80–2.78 and 2.61–2.59 ppm represent the methylene group of the oxirane group, of which the signals of the methine group can be detected at 3.18–3.14 ppm. For PEG-N3-OH (Fig. S3†), the signals at 5.25–5.23 ppm come from the terminal hydroxyl group, and the signals of the methylene group linked to the azide can be detected at 3.78–3.72 ppm. For PEG-N3-Cl (Fig. S4†), the signals of 5.11–5.04 ppm come from the methine group connected to the chlorine, and those at 1.67–1.53 ppm are from the methyl group. For the PEG-Cl (Fig. S9†), the signals at 5.19–5.09 ppm come from the methine group connected to the chlorine, the signals at 4.00–3.40 ppm represent the methylene groups of PEG, and those at 3.38 ppm are from the terminal methyl group. For the PEG-N3-PNIPAM and PEG-PNIPAM-Cl, the signals at about 3.99 and 1.13 ppm come from the methane and methyl groups of the PNIPAM segment, respectively, which indicate the success of the synthesis of diblock copolymers.
The number-average molecular weights (Mn) and polydispersities (PDI) were 8.9 kDa and 1.24 and 14.2 kDa and 1.22 for PEG-GA-PNIPAM by GPC measurements, respectively, and those for PEG-PNIPAM-GA were determined to be 10.4 kDa and 1.28. Mn, Mw, DPI and degree of polymerization (DP) are listed in Table 1. These three polymers are defined as PEG-GA-PNIPAM59, PEG-GA-PNIPAM106 and PEG-PNIPAM74-GA.
Table 1 Polydispersities of PEG-N3-PNIPAM and PEG-PNIPAM-N3 polymers
| Sample |
M
n/kDa |
M
w/kDa |
PDI |
DP |
| PEG-N3-PNIPAM59 |
8.9 |
11.0 |
1.24 |
59 |
| PEG-N3-PNIPAM106 |
14.1 |
17.4 |
1.22 |
106 |
| PEG-PNIPAM74-N3 |
10.4 |
13.3 |
1.28 |
74 |
Fig. 2 shows the FTIR spectra of the products. The characteristic absorption at about 2101 cm−1 represents the azide group, which confirms the successful reaction between PEG-CHOCH2, PEG-PNIPAM-Cl and NaN3. The disappearance of the absorption of the azide group in the FTIR spectra of PEG-GA-PNIPAM and PEG-PNIPAM-GA validates the successful click reaction.
 |
| | Fig. 2 FTIR spectra of (A) PEG-CHOCH2, PEG-N3-OH, PEG-N3-Cl, and PEG-N3-PNIPAM, and (B) PEG-Cl, PEG-PNIPAM-N3, and PEG-PNIPAM-GA. | |
Temperature-responsive behavior
PNIPAM shows good hydrophilicity at low temperature with hydrogen bonds in water. With increasing temperature, the hydrogen bonds break and it becomes hydrophobic. The low critical solution temperature (LCST) and the cloud point (CP) are used as the thermal phase transition temperature to describe such a thermo-responsive property. The CP defines the temperature at which the solution can be observed turbidly, which can be obtained at 50% of the transmittance change according to the heating curve. The LCST defines the temperature at which the polymer begins to aggregate, which can be obtained at 99% of the transmittance change according to the heating curve. The thermal phase transition temperature of a thermo-responsive polymer is affected by its molecular weight.
The thermal phase transitions for PEG-GA-PNIPAM59 and PEG-GA-PNIPAM106 samples are showed in Fig. 3. The transmittance of the samples was obtained at 650 nm and the heating rate is 0.5 °C min−1. According to Fig. 3, the LCST of PEG-GA-PNIPAM59, PEG-GA-PNIPAM106 and PEG-PNIPAM74-GA is 38.7 °C, 34.5 °C and 30.5 °C, while the CP values are 48.6 °C, 43.2 °C and 48.0 °C. The PEG-GA-PNIPAM106 presents lower LCST and CP values because of its longer PNIPAM chains which leads to the transformation of PEG-GA-PNIPAM from hydrophilicity to hydrophobicity occurring at lower temperature. With the hydrophobic PNIPAM chains and hydrophilic PEG chains, PEG-GA-PNIPAM starts to self-assemble into micelles at the LCST, and the transmittance decreases. Moreover, PEG-GA-PNIPAM106 collapses rapidly to micelles with a narrower temperature range due to its longer PNIPAM chains. Thus, compared with PEG-GA-PNIPAM59, PEG-GA-PNIPAM106 has a lower LCST and a narrower temperature range.
 |
| | Fig. 3 Optical transmittance for PEG-GA-PNIPAM and PEG-PNIPAM-GA solution at 650 nm. | |
Morphology of the assembly
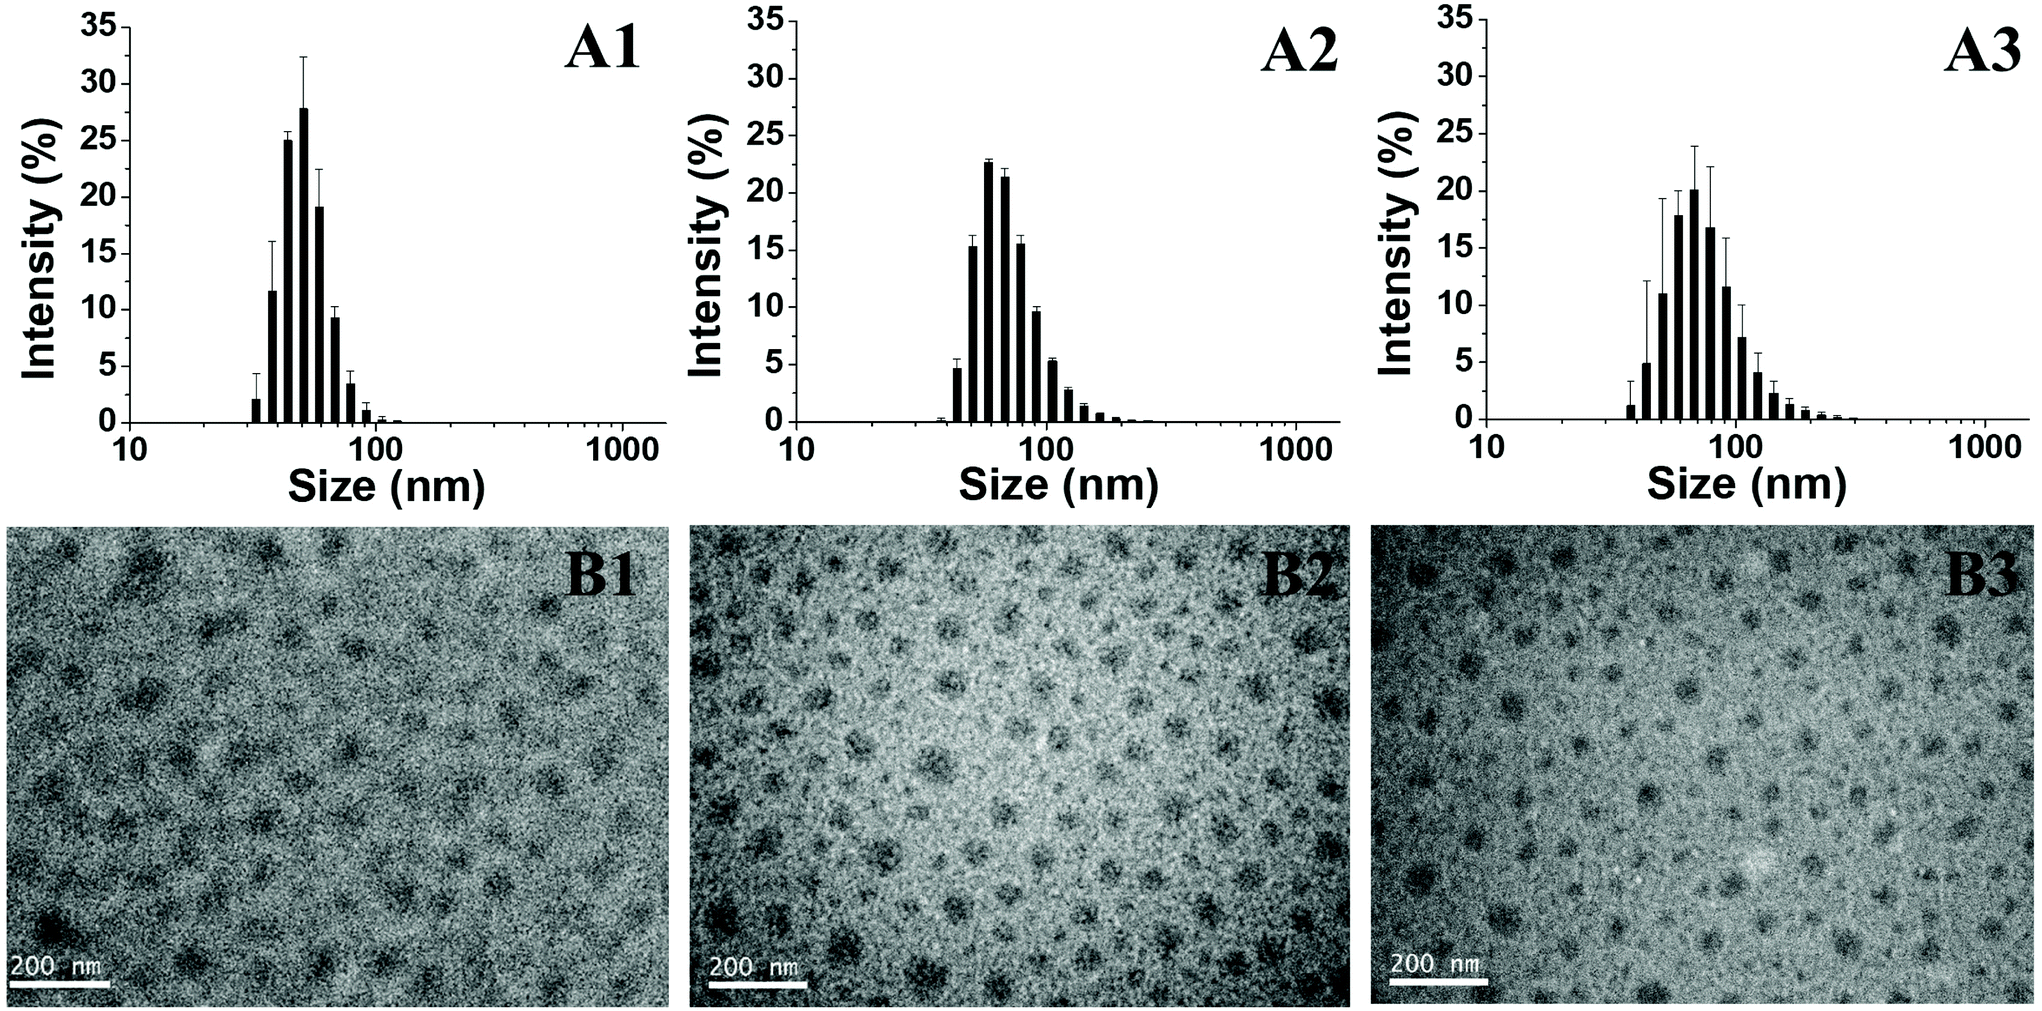
After heating at 45 °C, the block copolymer PEG-GA-PNIPAM becomes amphiphilic and aggregates to micelles. The morphology of the assemblies is analysed using DLS and TEM. The size distribution of PEG-GA-PNIPAM59 micelles’ diameters is from 33 to 122 cm, while that of PEG-GA-PNIPAM106 is from 38 to 255 nm and that of PEG-PNIPAM74-GA is from 38 to 295 nm (Fig. 4A). Obviously, the distribution becomes wider and the average diameter increases as the polymer dispersity index and the degree of polymerization of PNIPAM increase. The TEM images in Fig. 4B show that the average sizes of PEG-GA-PNIPAM59, PEG-GA-PNIPAM106 and PEG-PNIPAM74-GA are 50 nm, 65 nm and 50 nm respectively. These indicate that the micelles with a longer PNIPAM block have larger cores. The diameters of micelles detected through DLS are larger than those investigated by TEM for the reason that the samples of TEM are dried micelles, while those of DLS are aqueous solutions. Hydrodynamic diameters of the samples are much larger.
 |
| | Fig. 4 (A) The size distribution determined by DLS: (A1) PEF-GA-PNIPAM59 micelles, (A2) PEG-GA-PNIPAM106 micelles and (A3) PEG-PNIPAM74-GA micelles; (B) TEM images of polymers: (B1) PEF-GA-PNIPAM59 micelles, (B2) PEG-GA-PNIPAM106 micelles and (B3) PEG-PNIPAM74-GA micelles. | |
Optical properties of the samples
PEG-GA-PNIPAM is soluble in both THF and water, while the chromophore is not soluble in water. So PEG-GA-PNIPAM was examined in THF and water while the chromophore was measured in THF to obtain the optical properties. Fig. 5 shows their UV-vis curves.
 |
| | Fig. 5 (A) UV-vis spectra of (a) PEG-GA-PNIPAM59 and (b) PEG-GA-PNIPAM106, (c) PEG-PNIPAM74-GA in water and (d) PEG-GA-PNIPAM59, (e) PEG-GA-PNIPAM106 and the (f) chromophore in THF. The concentration of all samples was 1 mg mL−1. (B) Fluorescence emission spectra of (a) PEG-GA-PNIPAM59, (b) PEG-GA-PNIPAM106 and (c) the chromophore in THF and (d) PEG-GA-PNIPAM59 and (e) PEG-GA-PNIPAM106 in water. λex = 397 nm at room temperature. The concentration of all samples was 1 mg mL−1. | |
The main UV absorption peaks of all of the samples in water or THF are all located at about 395 nm. Each copolymer chain has exactly one chromophore, so the UV-vis curves of PEG-GA-PNIPAM and the chromophore are similar. As the chromophore was affected by the copolymer chains, it has a wider absorption in the copolymer with a larger degree of polymerization. The absorption peaks at about 350 nm become more apparent because of the hydrogen bond formed in water. Because of the change of the structure and the segment linked to the chromophore, UV-vis curves of PEG-PNIPAM-GA differ a lot from others.
Fluorescence emission curves of GA and the chromophore are shown in Fig. 5 and Fig. S14.† The fluorescence emission peaks of the chromophore, PEG-GA-PNIPAM59 and PEG-GA-PNIPAM106 are 474 nm, 479 nm and 476 nm in THF, while those of PEG-GA-PNIPAM59 and PEG-GA-PNIPAM106 are 552 nm and 549 nm in water. The interaction between the chromophore and polymer chains leads to emission red-shift. With shorter polymer chains, PEG-GA-PNIPAM59 can gather together easily, which makes PEG-GA-PNIPAM59 red-shift a little more. In water, PEG-GA-PNIPAM red-shifts more and emits yellow fluorescence rather than blue fluorescence in THF because of the solvatochromism effect caused by the existence of the strong interaction between the chromophore and water. PEG-PNIPAM-GA shows different emission peaks at 433 nm in THF and no fluorescence in water for the change of the structure linked to the chromophore. PNIPAM intends to form a hydrogen bond and affects the fluorescence of GA.
Temperature-dependent fluorescence enhancement
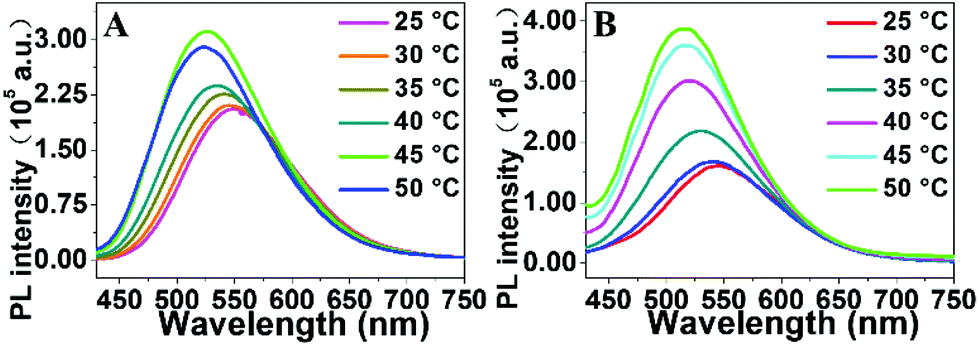
When PEG-PNIPAM was heated above the LCST, it aggregates and assembles into micelles with the hydrophilic PEG corona outside and the hydrophobic PNIPAM core inside. With the conformational space restriction of the chromophore caused by the self-assembly, PEG-GA-PNIPAM shows thermo-responsive properties of the fluorescence intensity. Fig. 6 illustrates the change of the PL intensity of PEG-GA-PNIPAM at a temperature from 25 °C to 50 °C. When the temperatures of the samples are 20 °C or 25 °C, which is below the LCST, the PL intensity increases a little for a little change of the copolymer chains. After the samples were heated above the LCST, the PL intensity increases significantly because of the conformational space restriction of the chromophore restricting the rotation caused by the self-assembly of the copolymer. On further heating, the micelles are formed almost completely and the interaction between them becomes enhanced. As a result, the PL intensity does not increase much and may even decrease at 50 °C. With a longer PNIPAM chain, PEG-GA-PNIPAM106 protects the chromophore affected by other micelles better and its PL intensity still increases at 50 °C. With the wide temperature range of self-assembly and the chromophore located at the end of the hydrophobic segment, PEG-PNIPAM-GA still exhibits an obvious change of fluorescence even when the temperature shifts from 45 °C to 50 °C. Moreover, the PEG-GA-PNIPAM blue-shifts from 549 nm to 523 nm and 547 nm to 517 nm and the PEG-PNIPAM-GA blue-shifts from 538 nm to 475 nm when the temperature changes from 25 °C to 50 °C. After the micelles formed, the interaction of the solvent and the chromophore weakens and that of the polymer chains and the chromophore is enhanced, which results in blue-shift. Compared with PEG-GA-PNIPAM59, PEG-GA-PNIPAM106 shows better thermo-sensitivity in a greater change of PL intensity and a more substantial blue-shift, which can be attributed to the longer PNIPAM chains that restrict the rotation of the chromophore more.
 |
| | Fig. 6 PL intensity of PEG-GA-PNIPAM59 (A) and PEG-GA-PNIPAM106 (B) with the temperature increasing from 25 °C to 50 °C. | |
Fig. S15 and S16† show the PL intensity of the fluorescent polymers during the heating and cooling processes. The sample was tested at 25 °C, and then heated to 50 °C. Before the temperature was adjusted to 25 °C again and a new process began, it was cooled down to 20 °C in order to ensure the collapse of micelles. The PL intensity change of PEG-GA-PNIPAM106 is reversible, while that of PEG-GA-PNIPAM106 decreases during the process. This can be explained by the fact that the long PNIPAM chains of PEG-GA-PNIPAM106 prevent the fluorescence quenching induced by the high temperature.
Detection of cell imaging
The ability of PEG-GA-PNIPAM and PEG-PNIPAM-GA for cell imaging was examined. PEG-PNIPAM-GA shows stronger fluorescence than PEG-GA-PNIPAM in living cells (Fig. 7), which is in accordance with flow cytometry (Fig. 8).
 |
| | Fig. 7 Fluorescence imaging of (1) MCF-7 cells and (2) L929 cells at room temperature with (A) PBS buffer, (B) 1 mg mL−1 PEG-GA-PNIPAM59, (C) PEG-GA-PNIPAM106, and (D) PEG-PNIPAM74-GA. λex = 405 nm. Scale bar: 100 μm. | |
 |
| | Fig. 8 Fluorescence of (A) MCF-7 and (B) L929 cells at room temperature by flow cytometry with (a) PBS buffer and 1 mg mL−1 (b) PEG-GA-PNIPAM59, (c) PEG-GA-PNIPAM106, and (d) PEG-PNIPAM74-GA after 30 min. λex = 405 nm and λem = 550 nm. | |
CellTracker™ Red CMTPX, cytomembrane-tracker wheat germ agglutinin, Alexa Fluor™ 594 Conjugate and Hoechst 33342, a nucleus specific dye, were used to perform the co-localization experiment of the polymer (Fig. 9). MCF-7 cells were treated with the dyes and PEG-PNIPAM74-GA for 30 min at room temperature before the detection. The Pearson correlation coefficient is calculated using ImageJ with the Colocalization Finder plugin. In Fig. 9A and D, the locations of the polymer's fluorescence show a high similarity to those of CellTracker™ CMTPX with Pearson correlation coefficients of 0.638 and 0.729. In Fig. 9B and E, the polymer shows low correlation with the wheat germ agglutinin, the cytomembrane-tracker, and the absolute value of the Pearson correlation coefficient is 0.174 and 0.019. As shown in Fig. 9C and F, the fluorescence of Hoechst 33342 can be observed clearly at an excitation wavelength of 406 nm. The fluorescence can be hardly observed in the centre of the cell in contrast to the nuclear-tracker Hoechst 33342 and the Pearson correlation coefficient is 0.230 and 0.260, which indicates that the polymer hardly enters the nucleus. Additionally, as Fig. 10 shows, PEG-PNIPAM74-GA exhibits good fluorescence not only in PBS buffer, but also in DMEM compared to CellTracker™ Red CMPTX. According to flow cytometry (Fig. 11), PEG-PNIPAM74-GA exhibits strong fluorescence both in MCF-7 cells and L929 cells treated with DMEM (including 10% FBS) and PBS buffer, which makes it possible to use DMEM as the solution and maintain the shape of the cells after incubating with the dye for a long time. This fact indicates that PEG-PNIPAM74-GA was mainly located in the cytoplasm. It has potential use in cell imaging and tracking of cells.
 |
| | Fig. 9 Fluorescence imaging of MCF-7 cells with 71 μM PEG-PNIPAM74-GA and (A) 0.5 μM CellTracker™ Red CMTPX, (B) 25 nM wheat germ agglutinin, and (C) 0.5 μM Hoechst 33342 and L929 cells with 71 μM PEG-PNIPAM74-GA and (D) 0.5 μM CellTracker™ Red CMTPX, (E) 25 nM wheat germ agglutinin, and (F) 0.5 μM Hoechst 33342 at 37 °C. Scale bar: 100 μm. | |
 |
| | Fig. 10 Fluorescence imaging of (A) MCF-7 cells and (B) L929 cells at room temperature with (1) 71 μM PEG-PNIPAM74-GA and (2) 0.5 μM CellTracker™ Red CMTPX for 30 min in DMEM with 10% FBS. Scale bar: 100 μm. | |
 |
| | Fig. 11 Fluorescence of (A) MCF-7 and (B) L929 cells at room temperature by flow cytometry with (a) PBS buffer and 1 mg mL−1 PEG-GA-PNIPAM106 in (b) PBS buffer and (c) DMEM with 10% FBS after 30 min. λex = 405 nm and λem = 550 nm. | |
Conclusions
In this work, thermo-sensitive diblock copolymers, PEG-N3-PNIPAM and PEG-PNIPAM-N3, inspired from GFP were prepared successfully via ATRP and linked with the self-restricted chromophore to further enhance its fluorescence and improve its solubility in water. The structure of the products was confirmed by FTIR and NMR. GPC was used to test the degree of polymerization. With the temperature increasing above the LCST, PNIPAM chains change from hydrophilicity to hydrophobicity, PEG-PNIAM self-assembles into micelles and the fluorescence is enhanced due to the restriction of the rotation of the chromophore. The emission performance of PEG-GA-PNIPAM106 shows a better reversible property than PEG-GA-PNIPAM59 during the heating and cooling cycles from 25 °C to 50 °C. PEG-PNIPAM74-GA exhibits a better fluorescence than PEG-GA-PNIPAM106, which indicates that the solvent effect has more influence than the aggregation of the self-restricted molecular GA whose fluorescence decreases with the addition of water.25 The amphiphilic polymer exhibited low cytotoxicity. Besides, it mostly enters into the cytoplasm. PEG-PNIPAM74-GA exhibits better fluorescence in cells than PEG-GA-PNIPAM106. Compared with the fluorescent dye CellTracker™ Red CMTPX, PEG-PNIPAM74-GA could more easily enter into MCF-7 cells in DMEM with 10% FBS. All of the results imply that PEG-PNIPAM74-GA can be used as a potential fluorescent probe in the near future.
Conflicts of interest
There are no conflicts to declare.
Acknowledgements
This work is financially supported by the National Natural Science Foundation of China (Grant No. 51690151, 21604055, 21805129, and 21875134), National Key Research and Development Plan of China (Grant No. 2016YFA0201500) and 2nd Innovation Fund of Precision Medicine Union Research Center of Shanghai Jiao Tong University & Southern Hospital of Sixth People's Hospital affiliated to Shanghai Jiao Tong University (Grant No. 2017B006).
References
- M. Zimmer, Chem. Rev., 2012, 102, 759–781 CrossRef.
- S. Leffel, S. Mabon and J. Steward, BioTechniques, 1997, 23, 912–918 CrossRef CAS PubMed.
- G. N. J. Phillips, Curr. Opin. Struct. Biol., 1997, 7, 821–827 CrossRef CAS PubMed.
- L. H. Naylor, Biochem. Pharmacol., 1999, 58, 749–757 CrossRef CAS PubMed.
- K. Brejc, T. K. Sixma and P. A. Kitts,
et al.
, Proc. Natl. Acad. Sci. U. S. A., 1997, 94, 2306–2311 CrossRef CAS.
- A. Baldridge, S. R. Samanta and N. Jayaraj,
et al.
, J. Am. Chem. Soc., 2010, 132, 1498–1499 CrossRef CAS PubMed.
- A. Crameri, E. A. Whitehorn, E. Tate and W. P. C. Stemmer, Nat. Biotechnol., 1996, 14, 315–319 CrossRef CAS PubMed.
- W. W. Ward and S. H. Bokman, Biochemistry, 1982, 21, 4535–4540 CrossRef CAS PubMed.
- L. X. Wu and K. J. Burgess, J. Am. Chem. Soc., 2008, 130, 4089–4096 CrossRef CAS PubMed.
- S. Olsen, M. S. Baranov and N. S. Baleeva,
et al.
, Phys. Chem. Chem. Phys., 2016, 18, 26703–26711 RSC.
- N. S. Baleeva and M. S. Baranov, Russ. J. Bioorg. Chem., 2017, 43, 612–615 CrossRef CAS.
- K. Y. Chen, Y. M. Cheng and C. H. Lai,
et al.
, J. Am. Chem. Soc., 2007, 129, 4534–4535 CrossRef CAS PubMed.
- G. Huang, J. Ho and C. Prabhakar,
et al.
, Org. Lett., 2012, 14(19), 5034–5037 CrossRef CAS PubMed.
- A. Baldridge, K. M. Solntsev and C. Song,
et al.
, Chem. Commun., 2010, 46, 5686–5688 RSC.
- M. Ikejiri, H. Kojima and Y. Fugono,
et al.
, Org. Biomol. Chem., 2018, 16, 2397–2401 RSC.
- M. S. Baranov, K. A. Lukyanov and A. O. Borissova,
et al.
, J. Am. Chem. Soc., 2012, 134, 6025–6032 CrossRef CAS PubMed.
- A. Baldridge, S. Feng and Y. Chang,
et al.
, ACS Comb. Sci., 2011, 13, 214–217 CrossRef CAS PubMed.
- J. S. Paige, K. Y. Wu and S. R. Jaffrey, Science, 2011, 333, 642–646 CrossRef CAS PubMed.
- D. E. Williams, E. A. Dolgopolova and P. J. Pellechia,
et al.
, J. Am. Chem. Soc., 2015, 137, 2223–2226 CrossRef CAS PubMed.
- E. A. Dolgopolowa, T. M. Morre and W. B. Fellows,
et al.
, Dalton Trans., 2016, 45, 9884–9891 RSC.
- H. Deng, Q. Zhu and D. Wang,
et al.
, Polym. Chem., 2012, 3, 1975–1977 RSC.
- G. Wang, Q. Zhu and H. Deng,
et al.
, Gaofenzi Xuebao, 2013, 13(5), 660–667 Search PubMed.
- Y. Zheng, G. Li and H. Deng,
et al.
, Polym. Chem., 2014, 5, 2521–2529 RSC.
- H. Deng, Y. Su and M. Hu,
et al.
, Macromolecules, 2015, 48, 5969–5979 CrossRef CAS.
- H. Deng, C. Yu, L. Gong and X. Zhu, J. Phys. Chem. Lett., 2016, 7(15), 2935–2944 CrossRef CAS PubMed.
- N. Kamaly, B. Yameen, J. Wu and O. C. Farokhzad, Chem. Rev., 2016, 116(4), 2602–2663 CrossRef CAS PubMed.
- F. Zhu, G. Tan and Y. Jiang,
et al.
, Biomater. Sci., 2018, 6, 2905–2917 RSC.
- H. Jin, M. Sun and L. Shi,
et al.
, Biomater. Sci., 2018, 6, 1403–1413 RSC.
- M. A. C. Stuart, W. T. S. Huck and J. Genzer,
et al.
, Nat. Mater., 2010, 9, 101–113 CrossRef PubMed.
- M. Jiao, P. Zhang and J. Meng,
et al.
, Biomater. Sci., 2018, 6, 726–745 RSC.
- Y. Xia, X. Yin, N. A. D. Burke and H. D. H. Stover, Macromolecules, 2005, 38, 5937–5943 CrossRef CAS.
- X. Pang, B. Cheng and S. Cui, Chin. J. Polym. Sci., 2016, 34(5), 578–584 CrossRef CAS.
- S. H. Qin, Y. Geng, D. E. Discher and S. Yang, Adv. Mater., 2006, 18, 2905–2909 CrossRef CAS.
- D. Cunliffe, C. de las Heras Alarcon, V. Peters, J. R. Smith and C. Alexander, Langmuir, 2003, 19, 2888–2899 CrossRef CAS.
- B. Matthias and L. Yan, Polymer, 2007, 48(7), 1815–1823 CrossRef.
Footnote |
| † Electronic supplementary information (ESI) available. See DOI: 10.1039/c9bm00255c |
|
| This journal is © The Royal Society of Chemistry 2019 |
Click here to see how this site uses Cookies. View our privacy policy here. 
 ,
Leilei
Shi
,
Jiapei
Yang
,
Linzhu
Zhou
,
Li
Xu
and
Xinyuan
Zhu
,
Leilei
Shi
,
Jiapei
Yang
,
Linzhu
Zhou
,
Li
Xu
and
Xinyuan
Zhu