
 Open Access Article
 This Open Access Article is licensed under a Creative Commons Attribution-Non Commercial 3.0 Unported Licence
Frontiers in electrochemical sensors for neurotransmitter detection: towards measuring neurotransmitters as chemical diagnostics for brain disorders
Yangguang
Ou
 ,
Anna Marie
Buchanan
,
Colby E.
Witt
and
Parastoo
Hashemi
*
,
Anna Marie
Buchanan
,
Colby E.
Witt
and
Parastoo
Hashemi
*
Department of Chemistry and Biochemistry, University of South Carolina, Columbia, SC, USA. E-mail: parry.hashemi@gmail.com
First published on 16th May 2019
Abstract
It is extremely challenging to chemically diagnose disorders of the brain. There is hence great interest in designing and optimizing tools for direct detection of chemical biomarkers implicated in neurological disorders to improve diagnosis and treatment. Tools that are capable of monitoring brain chemicals, neurotransmitters in particular, need to be biocompatible, perform with high spatiotemporal resolution, and ensure high selectivity and sensitivity. Recent advances in electrochemical methods are addressing these criteria; the resulting devices demonstrate great promise for in vivo neurotransmitter detection. None of these devices are currently used for diagnostic purposes, however these cutting-edge technologies are promising more sensitive, selective, faster, and less invasive measurements. Via this review we highlight significant technical advances and in vivo studies, performed in the last 5 years, that we believe will facilitate the development of diagnostic tools for brain disorders.
Introduction
Unlike illnesses of the body, such as diabetes or cancer, disorders of the brain, such as depression, do not have defined diagnostic protocols with quantifiable chemical biomarkers. The inability to definitively diagnose mental disorders means that it is also difficult to effectively treat them: antidepressants, for example, are largely ineffective for the majority of patients.1 There is, thus, enormous interest by us and others to identify chemical biomarkers of brain disorders so that illnesses of the brain can be better diagnosed and treated.Biomarkers of brain disorders have been difficult to identify for two primary reasons. First, the blood brain barrier maintains strict and different chemical climates between the brain and the periphery, such that peripheral blood does not reflect the brain's chemical microenvironment. Secondly, it is extremely difficult to probe the chemistry, namely neurotransmission, of an intact brain (in vivo). Analysis of neurotransmission necessitates micro or nano level spatial resolution, which is particularly challenging given the intricate nature of brain tissue. Additionally, the brain is chemically harsh and complex and neurotransmission is dynamic (occurring on the sub-seconds).
In the last decade, microengineering is the cutting-edge method to produce devices that are small, fast, and chemically reactive enough to meet some of the challenges of measuring neurotransmitters in vivo. There are three main categories of in vivo neurotransmitter detection devices; fluorescence probes, sampling (e.g. microdialysis), and electrochemistry. There are distinct pros and cons for each class of method, however electrochemical methods are particularly suited to in vivo sampling because they are able to perform direct chemical measurements in deep brain tissue without the need for artificial tags or sample treatment/analysis.
Via this review, we highlight the most recent advancements in the development of electrochemical microdevices over the last five years in the detection and quantitation of various important neurotransmitters to brain disorders, including glutamate (Glu), acetylcholine (ACh), dopamine (DA) and serotonin (5-HT). We focus mostly on amperometric biosensors and voltammetry in this review. While most of the literatures cited are primarily performed in vivo, we choose to highlight some in vitro and ex vivo work that further the progress of the field as well as display promising potential for future in vivo experiments.
While few of the reviewed methods have been implemented in humans and none have been used for diagnostics, we believe these devices show promise towards rapidly enabling chemical biomarker identification in the brain. Such a transition will revolutionize diagnosis and treatment of disorders of the brain.
Monitoring neurotransmission
Neurotransmitters are small molecules that relay chemical messages between brain cells via a process called neurotransmission (Fig. 1). As such, the intricacies of neurochemical signaling are of particular interest in the diagnosis and treatment of psychological disorders. Neurotransmission is rapid (milliseconds) and occurs over several general steps. First, the transmitter is synthesized via presynaptic processes. Release of neurotransmitter from the presynaptic cell into the synaptic space is via Ca2+ initiated exocytosis. Following release, the transmitter binds to receptors on the postsynaptic cell or to autoreceptors on the presynaptic cell. Finally, the signal is terminated through reuptake back into the presynaptic cell by a transporter, followed by intracellular catabolism or via direct extracellular catabolism.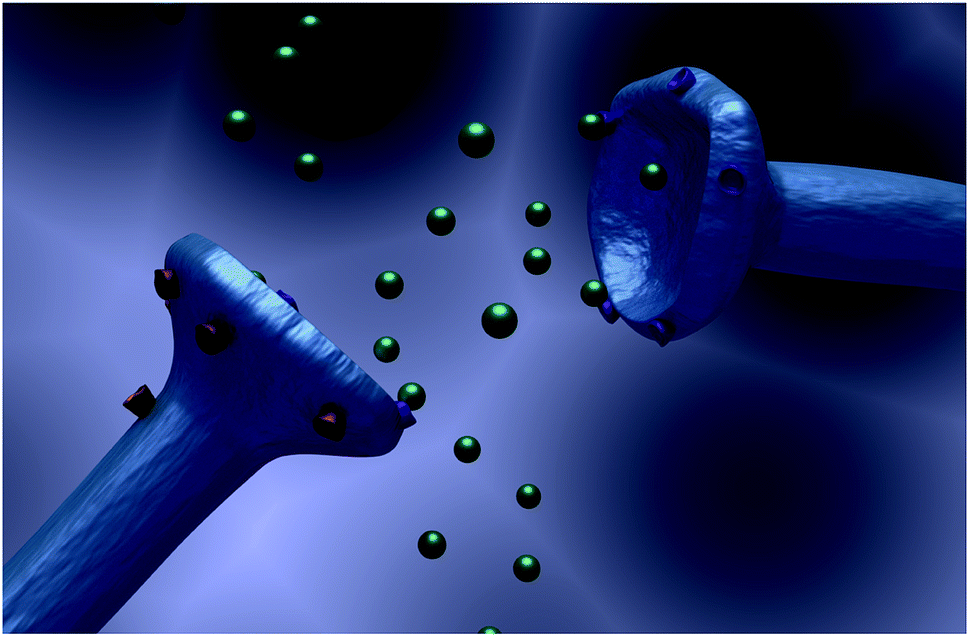 | ||
| Fig. 1 Illustration of a synapse. Presynaptic cell is on the left and postsynaptic cell is on the right. Green spheres represent neurotransmitters. Autoreceptors are shown in orange and postsynaptic receptors in purple. | ||
Classical neurotransmission is mediated by excitatory neurotransmitters such as Glu and ACh and the inhibitory neurotransmitter gamma-aminobutyric acid (GABA), which, because of their potency and cytotoxicity, are confined to the synaptic space. Neuromodulators, such as DA, 5-HT, norepinephrine, and histamine (HA), are types of neurotransmitters that signal through “volume transmission.” Unlike Glu, ACh and GABA, these molecules diffuse outside of the synapse exerting influence over many cells over a large spatial area.
This review explores electrochemical neurotransmitter measurements in the context of neurotransmission. Two categories of electrochemical techniques are of particular interest: voltammetry and biosensors.
Voltammetry
A variety of voltammetric techniques are utilized to directly detect electroactive molecules. These techniques are characterized by the application of a potential waveform to an electrode and the measurement of the resulting current.2 Because of the rapid time frame of neurotransmission, fast-scan cyclic voltammetry (FSCV) is of particular interest throughout this review. In FSCV, a waveform with a fast scan rate is applied to a microelectrode, at high frequency (typically 10 Hz), affording measurements with millisecond timescale.3 This method is coupled to carbon fiber microelectrodes (CFMs) of 5–7 μm in diameter. This small probe size promotes high spatial resolution and negligible tissue damage.4Fig. 2 shows the two electron oxidation/reduction of DA at a CFM that results in a stereotypical DA fast scan cyclic voltammogram. There are some drawbacks to FSCV measurements. Firstly, a limited number of neurotransmitters have electroactivity that lends itself to FSCV detection. This issue has made detection of neurotransmitters such as Glu, GABA, and ACh difficult. Selectivity is also a concern; the monoamines DA, 5-HT, and norepinephrine oxidize at similar potentials and are colocalized in many of the same brain regions. In many cases, waveform optimization and pharmacological manipulation are implemented to differentiate between the molecules and to reduce signals due to other interferents. This review will explore advancements made in FSCV to address existing limitations and to provide additional insight into the complexities of neurotransmission.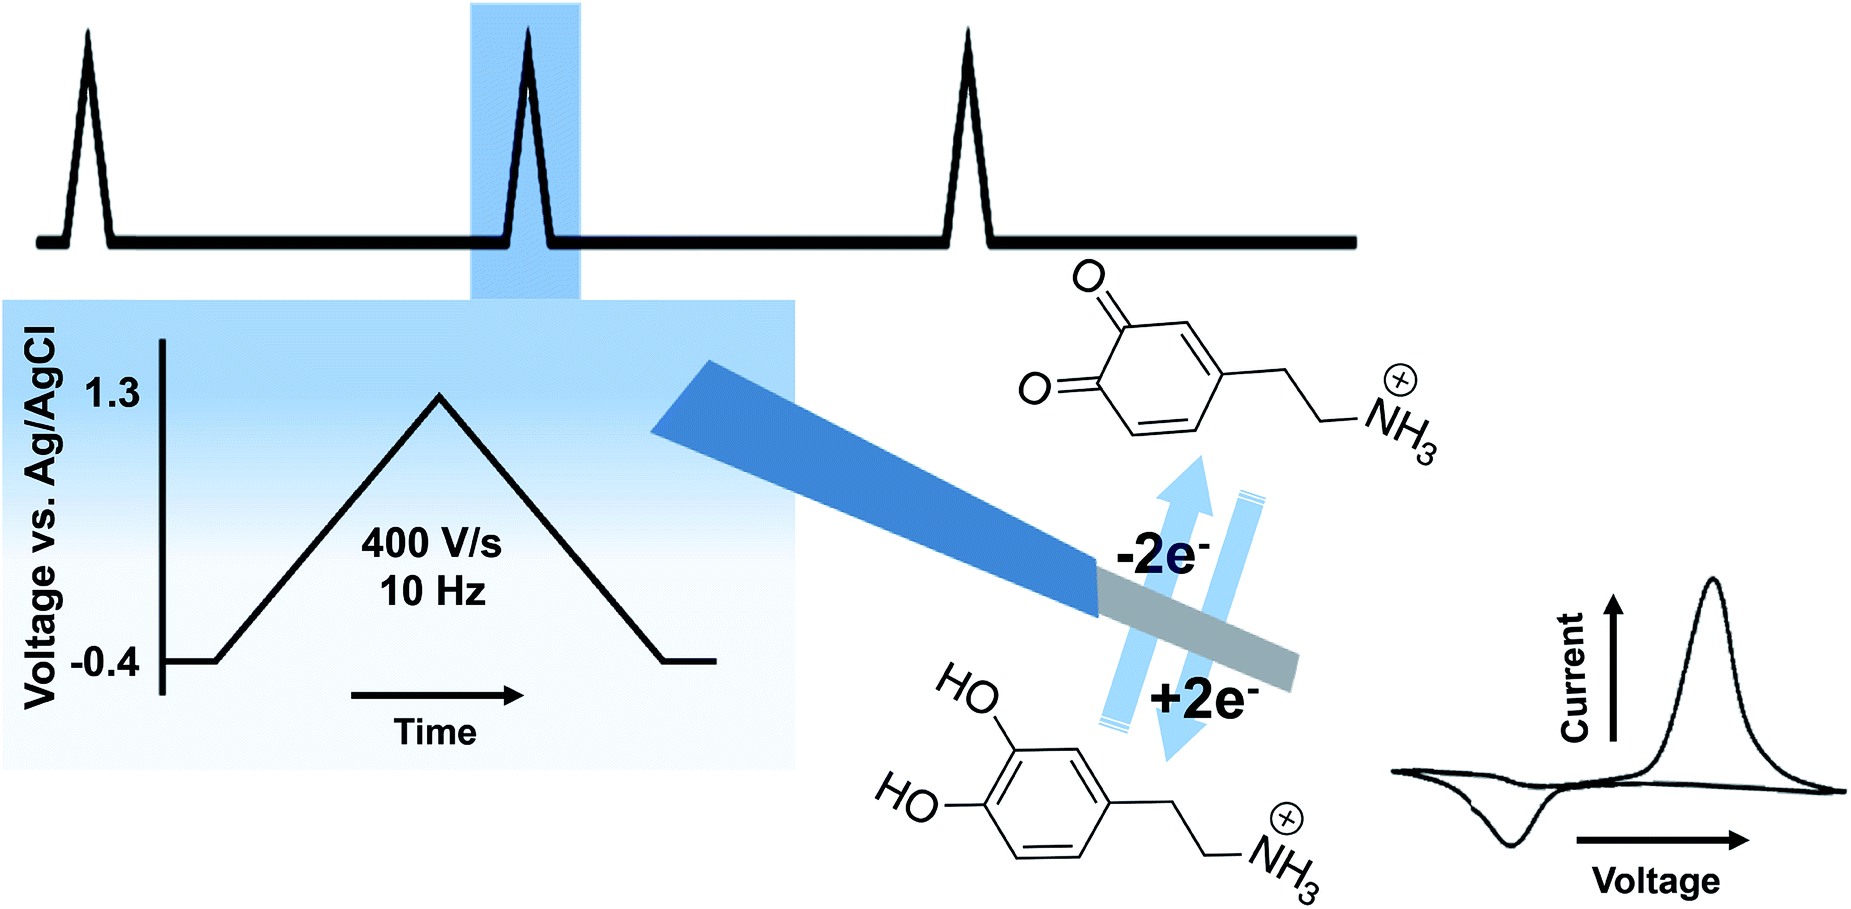 | ||
| Fig. 2 Schematic of FSCV at CFMs. The top shows the waveform. The blue box shows the parameters of the waveform. In the middle is an illustration of a CFM performing a two-electron oxidation/reduction of DA with a representative cyclic voltammogram to the right. | ||
Biosensors
When the analyte of interest is not easily electroactive, biosensors can be applied. Biosensors are devices that create an electrical signal in response to the analyte via a biocatalyst such as an enzyme, antibody or DNA.5 Electrochemical biosensors commonly involve immobilization of an enzyme at an electrode surface. This enzyme is selective for an analyte of interest. As an example, the enzyme Glu oxidase oxidizes Glu and reduces O2 to H2O2. While Glu is not readily electroactive, H2O2 can be easily oxidized. Thus amperometry (current measured at constant potential) can quantify Glu via H2O2 oxidation. A generalized biosensor scheme is shown in Fig. 3. The major advantages of biosensors are the high selectivity afforded by the biological molecule and electrochemical detection of chemicals that are not electroactive within the potential window of traditional electrode materials. However, the use of enzymes produces many challenges. Sufficient enzyme loading for high sensitivity, membranes and immobilizing matrices often necessitates large probes, which is undesirable for measurement in delicate brain tissue.6 Additionally, immobilization methods can cause conformational changes in the enzyme, lowering catalytic activity, stability and shelf-life.7 Efforts to overcome these obstacles for in vivo measurements are highlighted throughout this review.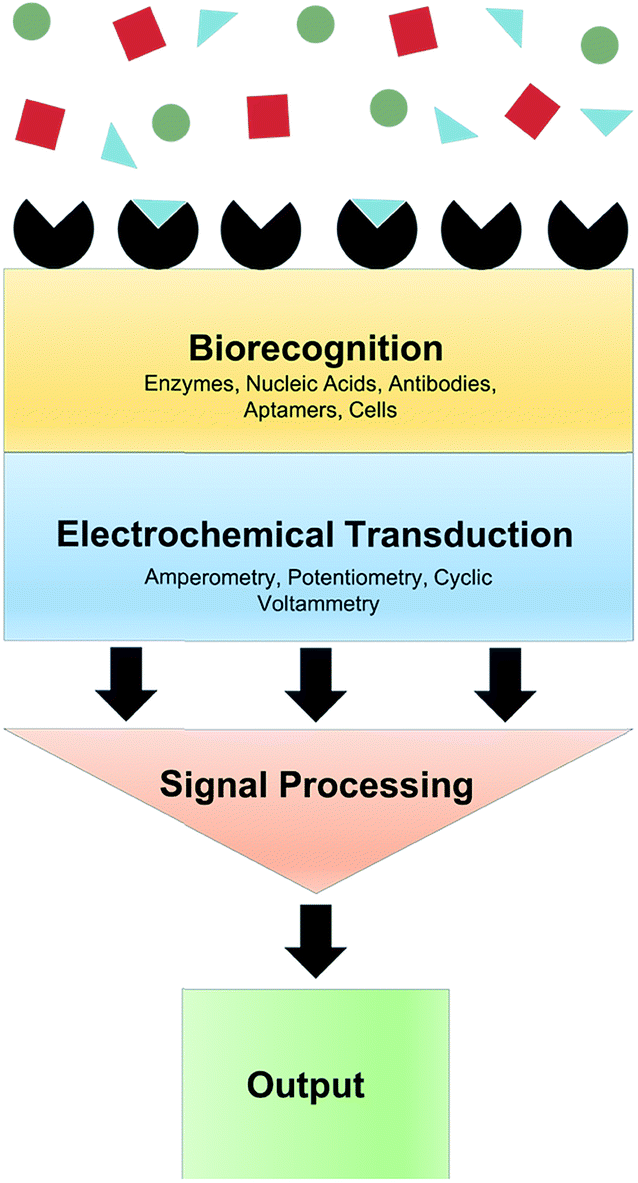 | ||
| Fig. 3 Schematic of an electrochemical biosensor. A typical biosensor consists of a biorecognition element selective for the molecule of interest (blue triangles) within a given matrix (red squares and green circles), a transducer that converts the input into a measurable signal, and signal processing and output components. | ||
Glutamate (Glu)
Introduction
Glu is one of the most ubiquitous neurotransmitters8 that binds to NMDA (N-methyl-D-aspartate), kainate, AMPA (α-amino-3-hydroxy-5-methyl-4-isoxazole-propionic acid), and metabotropic receptors.9 Because Glu is highly excitatory, this messenger can exert excitotoxic effects and is thus rapidly uptaken via excitatory amino acid transporters located on the plasma membrane of astrocytes and neurons.10,11 This high level of regulation presents difficulties for analytical Glu measurements since Glu cannot readily escape the synapse like the neuromodulators described later in this review. Additionally, Glu is not electroactive within the potential window of conventional electrode materials. These two phenomena present unique challenges for Glu detection.The extraction and purification of Glu oxidase12 enabled development of selective Glu biosensors, the frontline electrochemical Glu detection devices. Working electrodes in these sensors can be made from carbon fiber13 or diamond14 but are most commonly composed of platinum.15 Substrate materials for creating sensing platforms, including arrays, are primarily silicon or ceramic.16 Strategies for immobilizing the enzyme onto the electrode surface include direct adsorption, covalent binding, cross-linking,17 and entrapment in polymers (reviewed in Scouten et al.,18 Freire et al.,19 Putzbach et al.20 and Hughes et al.21). Immobilization of enzymes in polymeric membranes, especially electrochemically deposited polymers,22–34 gained increasing attention due to a variety of factors,23 particularly the ability to prevent interfering molecules from reaching the electrode. Self-referencing is another strategy used to reduce signals from other electrochemically active species.34–36 This approach involves a second electrode that mimics the working electrode in all respects but does not contain enzyme. This ensures that signals from any non-selective binding of species to the electrode surface can be subtracted out.
One major limitation for biosensors is poor electron transfer between the enzyme and the electrode due to the tunneling distance between the enzyme's electron transfer center and the electrode. To improve signal transduction, various functional nanomaterials37–40 and redox mediators41–43 were incorporated into the electrode design.44 Using these general strategies, Glu biosensors were utilized to investigate the dynamics of this messenger in the brain.
Glutamate in sleep/wake and reward
Electrochemical measurement of Glu could have implications for diagnosis of sleeping and addictive disorders. Glu biosensors have been used in the mouse prefrontal cortex (PFC) to investigate Glu's roles in the sleep/wake cycle. For example, Naylor et al. found that extracellular Glu levels correspond well to the sleep/wake cycle. Glu levels were higher during the awake state and lower during the sleep state with transients during periods of REM sleep.45 Further work found chronically high levels of extracellular Glu in the same brain region in animal models with Rett syndrome, which is marked by severe sleep deprivation-like symptoms.46Glu biosensors have also been utilized to investigate reward circuitry. An initial dose of nicotine induced rapid, transient Glu release in the ventral tegmental area and the nucleus accumbens, regions that make up the mesolimbic system, a neural system highly implicated in reward.47 Cocaine administration induced similar phasic Glu release in the nucleus accumbens shell.48 Repeated doses of nicotine increased tonic Glu that correlated with drug-induced hyperlocomotion.47 Repeated doses of cocaine had similar effects in the dorsal striatum49 and an interesting biphasic release profile in the nucleus accumbens shell.48 Wassum et al. measured rapid Glu transients prior to lever pressing in rodent models of reward-seeking behavior.33,50 These studies generally implied a role for Glu in cue-evoked reward behaviors; however, a 2015 study showed that Glu release from selective activation of glial cells inhibited reinstatement of cocaine seeking behavior.51 Thus, Glu's roles in reward seeking are clearly complicated and warrant more investigations.
Technological advances over the last five years include using novel materials to enhance sensitivity, stability, response time, and cost effectiveness of these sensors. There has also been a push to address the oxygen-sensitivity of glutamate sensors by replacing glutamate oxidase with other enzymes. Additionally, it is clear that other analytes and chemicals work in tandem with Glu. Thus, there is a need for multi-analyte measurements and integrated devices. We review novel technical advancements below.
Novel technical advancements for glutamate biosensors
Weltin et al. used a flexible polyimide-based substrate as the wafer for sensor design, instead of the more rigid silicon or ceramic alternatives. The authors pointed out that soft materials cause less tissue damage and demonstrated the utility of this sensor by measuring Glu in vivo.55 In a follow-up study, the same group created multiparametric devices via hybrid thin-film and laminate technology using polyimide substrates.56 The device included sensors for Glu, lactate, oxygen, and glucose detection simultaneously.
The polymers used for biosensors are also important. Clay et al. recently developed a mathematical model for optimizing conditions of electroenzymatic sensors for optimal Glu detection. The model accurately predicted the sensitivity for Glu sensors made by immobilizing Glu oxidase with various polymeric films. Simulations demonstrated that a significant amount (>95%) of H2O2 generated in the thick enzyme layers tend to diffuse back to the sample solution, suggesting that biosensors made with thinner films (1–3 μm) were optimal. In fact, the simulations showed that these films would yield several-fold improvement in both sensitivity and response time. The model was for a specifically constructed device; however, it can be used as a blueprint for optimizing other enzyme-based biosensors.57
Other notable examples of novel materials include hybrid carbon materials by Sainio et al., who demonstrated that electrodes made with tetrahedral amorphous carbon nanofibers had a larger potential window than conventional electrode materials and could measure Glu without enzymes.58 Nasr et al. developed a borosilicate micropipette-based biosensor covered with self-organized nanostructures, whose large surface area increased sensitivity for Glu detection in stem cell-derived brain organoids.59
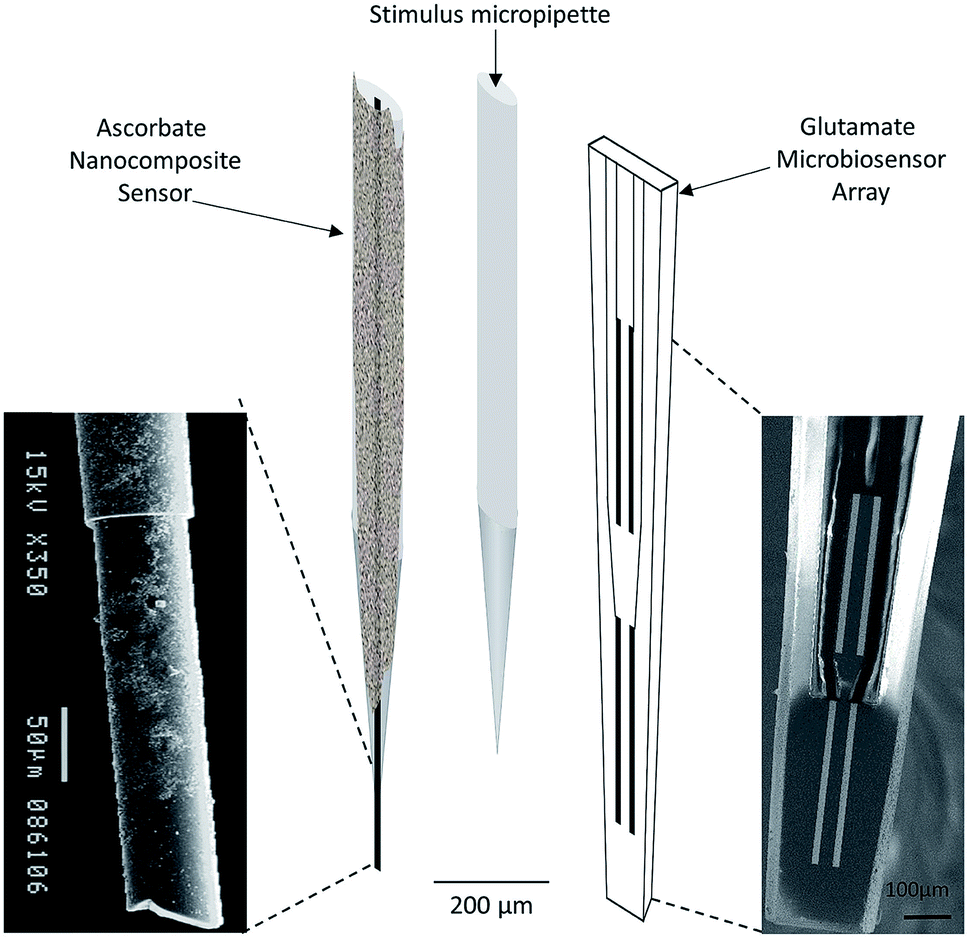 | ||
| Fig. 4 Schematic representation of array composed by ascorbate nanocomposite microsensor (left), Glu microbiosensor (right) and the micropipette (center) for local application of solutions in the extracellular space of the rat hippocampus. Reproduced from Ferreira et al. with permission.67 | ||
Electrophysiology is one of the most commonly used techniques in neuroscience and monitors neuronal activity as a function of a DC shift. Wei et al. developed silicon-based implantable microelectrode arrays with a micro-electromechanical system technology for simultaneous in vivo Glu and electrophysiological recordings in the striatum of anesthetized rats.68 In a similar approach, Fan et al. created a 16-channel silicon-based array based on micro-electromechanical system technology. Twelve of the 16 electrodes were modified with platinum black, a “spongy” electrode material with excellent catalytic properties, for electrophysiological recordings of neural firing. The remaining 4 electrodes were modified with Glu oxidase for Glu measurements in vivo. This microelectrode array was implanted into the cortex and hippocampus of mice and Glu concentrations were found to be higher in the hippocampus despite slower firing rates of neurons.69
Acetylcholine (ACh)
Introduction
ACh binds to two main classes of receptors: nicotinic and muscarinic. Ionotropic nicotinic receptors are present in relatively low abundance in the brain, with the majority of cholinergic receptors being metabotropic muscarinic receptors.70 Furthermore, ACh is unique among neurotransmitters because the ACh's signal is terminated exclusively through extracellular degradation of the molecule via acetylcholinesterase in the synapse that rapidly breaks down this molecule into choline and acetate. Choline is then taken up by the presynaptic cell. Because ACh is not electroactive within the potential window of most biocompatible materials, efforts to measure the molecule have mostly focused on the exploitation of ACh metabolism. Electrochemical enzyme-based sensors for ACh have been developed using either choline oxidase or a combination of acetylcholinesterase and choline oxidase. Enzymes are immobilized on the electrode surface via different approaches and the catalytically generated H2O2 is detected amperometrically.71Duel-enzyme biosensors measured the sum of choline and ACh signals via choline oxidase and acetylcholinesterase enzymes.72 To refine this approach, self-referencing sensors, with separate sites for ACh/choline and choline detection, allowed interfering signals to be subtracted out and independently quantify choline and ACh signals in vivo.73,74
In terms of unraveling ACh's role in the brain using biosensors, Parikh et al. were the first to use a simpler single sensor approach of measuring choline in awake, behaving animals. The electrode was modified with choline oxidase, assuming choline is a direct index of ACh.75 The keynote studies from this group laid the foundation for investigating ACh's roles in attention and memory, the most recent of the findings of which are reviewed below.
Acetylcholine's role in attention and memory
ACh measurements with electrochemical devices may prove critical in diagnosis of attention and memory disorders, including neurodegenerative diseases such Alzheimer's disease. ACh biosensors have time resolution on the order of seconds or subseconds and have been able to capture transient changes in ACh concentration.75,76 For example, cholinergic transients associated with attentional performance in cue detection behavioral tasks were measured in the PFC of rodents.77 In this experiment, animals responded to a visual light cue by pressing an assigned lever for a food reward. The evidence presented in the paper suggested that choline plays a role in switching from monitoring a response to acting upon it.77 In a follow up study, optogenetic stimulation of cholinergic transients increased the probability of correctly acting upon a response.78 The same group used combined approaches (choline measurements, electrophysiology and pharmacology) to show that cholinergic transients were concomitant with increased neuronal synchronicity across several neuronal firing frequency bands and the emergence of theta–gamma coupling (a neurophysiologic process underlying working memory).79 Thus the group revealed the important role that ACh may play in linking attention to memory.79 Synchronized release of ACh has also been observed across brain regions; Teles-Grilo Ruivo et al. used a dual-enzyme biosensor to measure coordinated ACh release in the PFC and hippocampus of freely moving mice performing a working memory task.80While there have been exciting advancements in the detection of choline and ACh, there are existing difficulties in in vivo measurements. Technological advances in the last five years attempted to address some of these, including probe size, stability, temporal resolution, and toxicity. These are addressed in the following section. Some of the papers described are designed for environmental studies but the technical innovations, we believe, can be applied to future in vivo sensor design.
Frontiers in acetylcholine biosensing
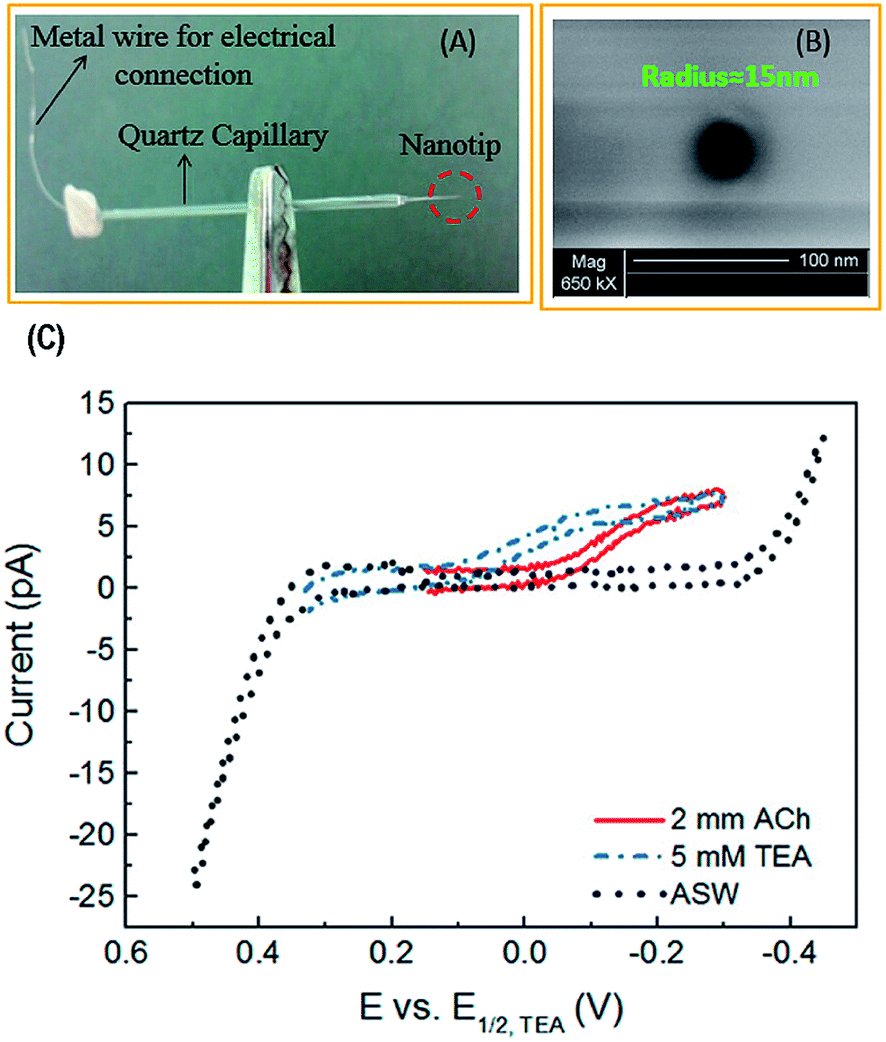 | ||
| Fig. 5 (A) Photograph and (B) scanning electron micrograph of a nanopipette prepared by a laser-pulled capillary. (C) Cyclic voltammogram of 2 mM acetylcholine (ACh), tetraethylammonium (TEA), and artificial seawater (ASW). TEA was used as an internal standard and ASW was the solvent (background signal). Adapted with permission from Colombo et al.81 | ||
Dopamine (DA)
Introduction
DA is a neuromodulator and is released, by the fusion of pre-synaptic vesicles to the cell membrane, in the extracellular space. DA exerts its effects, via volume transmission, to modulate the function of other neurotransmitters. DA has five major receptor subtypes (D1–D5) and is regulated via autoreceptors, heteroreceptors and transporters.96CFMs were discovered to be useful sensors for in vivo DA measurements due to their biological compatibility97,98 and renewable surfaces.99,100 Early days of DA measurements were plagued by interferences, particularly significant contribution from AA, which is present in much higher quantities in the brain than DA.101 However, it was demonstrated that holding the potential at −0.4 V preconcentrates the positively charged DA ion,102 and increasing scan rate allows DA oxidation (whose electron transfer kinetics are faster than that of AA) to overshadow AA oxidation.103 New instrumentation was created to simplify measurements and data analysis.104 Dopamine was measured with FSCV as evoked with electrical stimulation,105 and Rebec et al. were the first to observe DA transients during behavior.106 We know precipitously more about the functions of DA in the brain than other transmitters because of this breakthrough technique, typified by the work of Mark Wightman over the last four decades. These works have enabled routine study of DA by many members of the community.
Dopamine in cognition and reward
Electrochemical devices that measure DA have wide reaching diagnostic potential, for example in addictive and cognitive disorders and neurodegenerative diseases such Parkinson's disease (characterized by loss of DA neurons). DA FSCV technology described above culminated, among other seminal findings, in establishing DA's major roles in reward and cognition.107–115 These findings spearheaded an explosion of studies to understand these behaviors in the context of the dopaminergic system. In particular, it was found that the reward-related behaviors described above are controlled by the mesolimbic DA circuits, which are in turn modulated by endogenous factors such as hormones. Naef et al. showed that insulin administration reduced DA release in the nucleus accumbens as well as attenuated cocaine-induced DA spikes and locomotor hyperactivity.116 The hormone estradiol was found to increase the DA mediated potency of cocaine,117 a finding that could explain the sexual dimorphism in addiction vulnerability. Another interesting finding has been that the stress hormone corticosterone potentiates DA signaling via inhibition of the organic cation transporter (OCT) 3, which may explain stress-induced drug relapse behavior.118Other notable investigations involving DA FSCV include measuring this modulator in humans playing a reward based investment game during surgery for deep brain stimulation for Parkinson's disease119 and after administration of chemotherapy drugs in a zebra fish model of chemo brain.120–122 An additional recent direction is deciphering DA/5-HT modulation in the context of alcohol consumption123 and response to neutral stimuli in animal models.124
Recent technical advances in the last five years, including improvement of calibration, measurement of ambient DA levels, monitoring multiple analytes simultaneously, chronic measurements, and integrating in vivo voltammetry with other platforms are highlighted below.
Technical advancements
Via a total-background-current strategy, Roberts et al. created a quadratic model relating sensitivity to background current and switching potential.125 The group showed that the model was a good predictor of in vivo sensitivity. An alternative approach is to use principal component regression, which captured information from the shape of the background current to better provide estimates of sensitivity.126 Meunier et al. built upon this principal component regression strategy by modeling impedance changes due to electrode fouling with simple circuits, thereby improving the accuracy of predicted background current.127
One of the chief issues with chronic measurements is the loss of electrode material over time.100 Nimbalkar et al. designed and fabricated a new class of homogeneous glassy carbon neural probes with no adhesion or conducting metal layers, thereby enhancing the lifetime of the probe for long periods of electrical stimulation (for deep brain stimulation, for example).129 Interestingly, the same probe materials were capable of stimulating in addition to performing neurochemical measurements.129
Another hindrance to using traditional FSCV carbon fiber probes for chronic measurements is the size of the probe shaft, which induced inflammatory responses. While the probe tip was on the order of 5–7 μm, the probe shaft can be as large as 100 μm. Inflammatory responses can foul the electrode surface, reducing the lifetime of the electrode. Schwerdt et al. recently replaced the glass shaft of the conventional CFMs with parylene, which provides robustness in a thinly deposited layer surrounding the carbon fiber, resulting in <10 μm size probe shafts. These probes were fabricated into arrays and implanted in rodent,130 and non-human primate131 brains for successful multi-channel simultaneous DA measurements for over 100 days in vivo.
Atcherley et al. modified FSCV and coined a novel method, fast-scan controlled-adsorption voltammetry (FSCAV).133Fig. 6 shows that DA FSCAV takes place over three distinct steps: (1) the triangle waveform (−0.4 to 1.3 V, scan rate = 1200 V s−1) was applied at a high frequency of 100 Hz to minimize adsorption of DA to the electrode surface (A, purple region); (2) a fixed potential (−0.4 V) was applied to the electrode system, allowing for DA to adsorb to the electrode surface for a controlled amount of time (A, blue region); and (3) the waveform was then reapplied at the same frequency to measure the adsorbed DA (A, green region). Fig. 6B shows a representative color plot, from which the first current vs. time curve with the representative DA peak (Fig. 6C) is used to quantify the total charge underneath the peak. Total charge was then plotted against concentration (Fig. 6D) to generate a calibration curve.
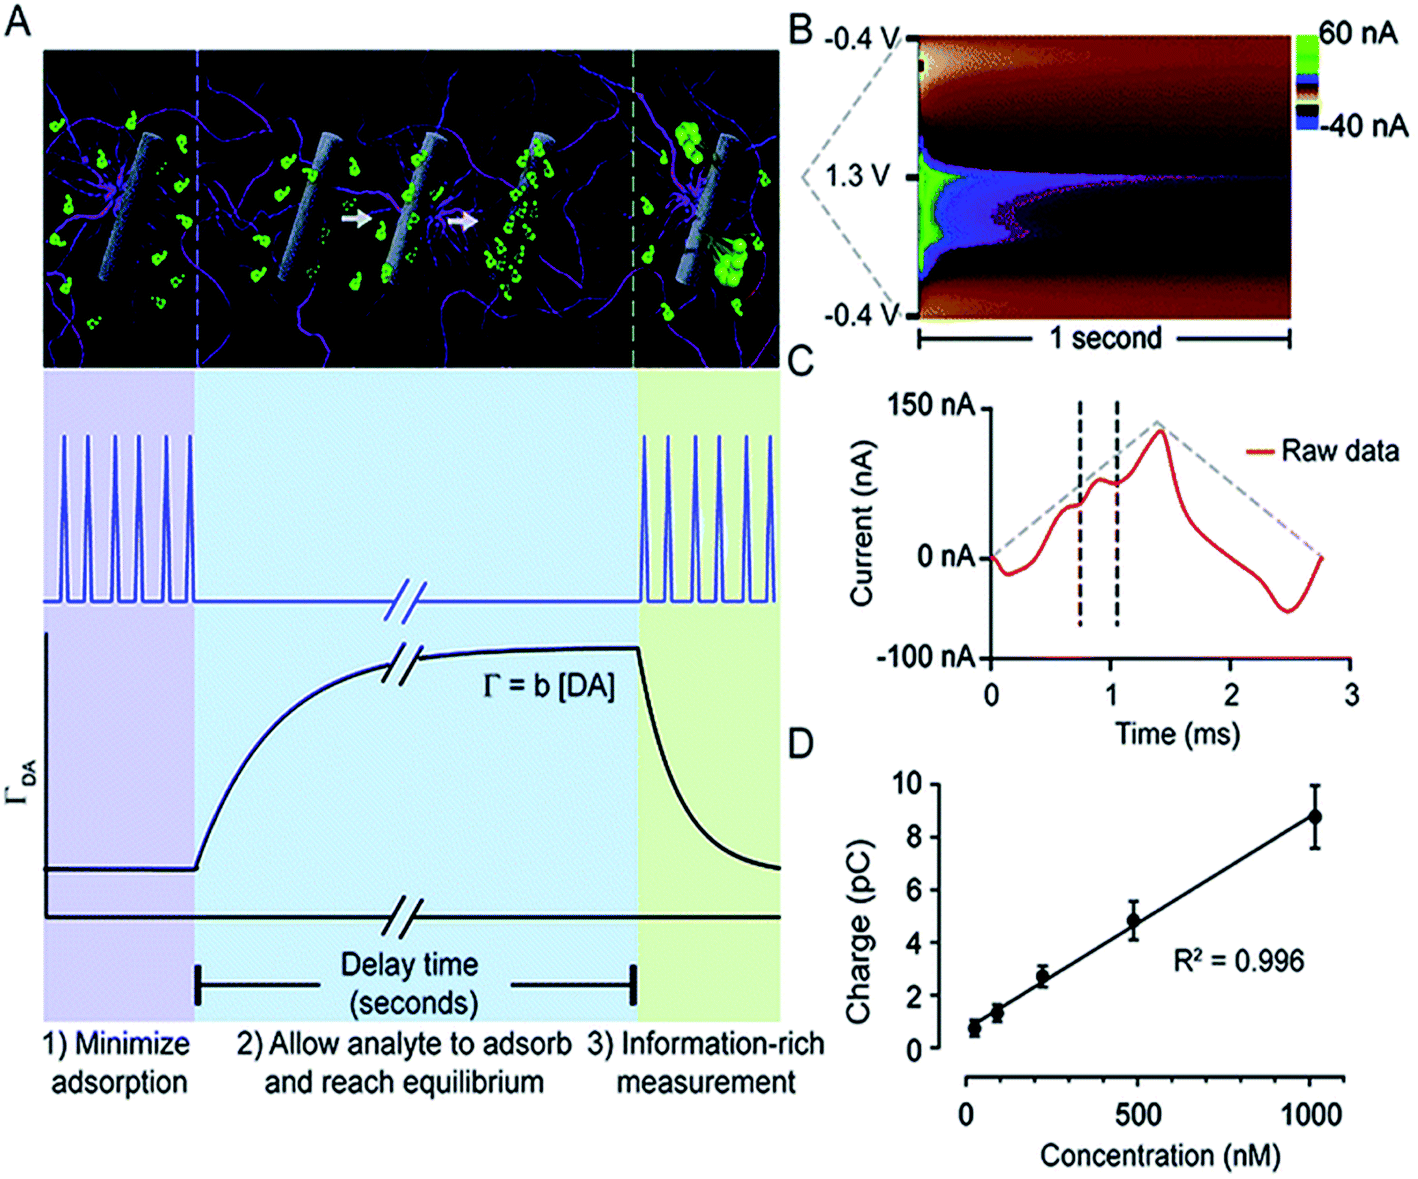 | ||
| Fig. 6 FSCAV was carried out in 3 steps (A): (1) the waveform was applied every 10 milliseconds which minimizes DA adsorption to the electrode. (2) The potential was held at −0.4 V for 10 seconds to allow DA to adsorb to the electrode and reach equilibrium. (3) The waveform was reapplied, and the adsorbed DA was measured. Surface-accumulated DA (ΓDA) is proportional to the tonic concentration [DA] by the strength of adsorption. (B) Resultant color plot from step 3, with voltage on the ordinate, time on the abscissa, and current displayed using false colors. (C) Representative current trace (red) taken 10 milliseconds after the beginning of step 3. The vertical dashed lines show the bounds for integration to quantify adsorbed DA. The grey-dashed triangles illustrate the voltage waveform applied. (D) A calibration plot obtained by FSCAV post implantation (R2 = 0.996, slope = 0.0078 ± 0.0002 pC nM−1 (n = 7 electrodes)), which when accounting for electrode area and equivalents transferred, corresponds to b = 0.0037 ± 0.0002 cm. Reproduced with permission from Atcherley et al.133 | ||
Atcherley et al. reported a tonic concentration of 90 ± 9 nM of DA in the nucleus accumbens core of an anesthetized mouse with a limit of detection of 3.4 ± 0.8 nM and a temporal resolution of 30 s.134,135 FSCAV was recently coupled to FSCV to concurrently measure both stimulated release and tonic DA in brain slices.135 In an alternate strategy, Oh et al. changed the waveform for FSCV into a “Mexican hat” waveform and introduced a dual-background subtraction protocol to measure tonic DA.136 They termed this new method charge balancing multiple waveform FSCV. In a follow up study, the group utilized multiple cyclic square wave voltammetry for measuring tonic DA, which, like FSCAV, also utilized a holding potential period to control DA adsorption onto the carbon fiber. In this method, they modeled the fast capacitive current decays using a simple exponential decay equation and subtracted it out from the raw signal.137
Other approaches used mathematics to address the issue of the large background current. Johnson and Wightman optimized an experimental protocol in order to simplify background current to those that can be mathematically explained and then used a convolution-based method to predict and remove the resistive-capacitive component of the CFM background current.138
Other surface modifications have enabled detection of other analytes with DA. Cincotto et al. modified glassy carbon electrodes with a hybrid material consisting of mesoporous silica nanoparticles, graphene, and silver nanoparticles for simultaneous electrocatalytic reduction measurements of DA and epinephrine.143 Stephen and colleagues modified glassy carbon electrodes with a poly(o-methoxyaniline)–gold nanocomposite, which reduced overpotentials and separated overlapping peaks for simultaneous folic acid and DA detection.144 Si et al. used pyrrole and o-phenylenediamine monomers to form molecularly imprinted polymers for simultaneous detection of DA, norepinephrine, and epinephrine using differential pulse voltammetry.145
Other notable multimodal technology include work done by Lee et al., who improved upon a previous generation of their multi-modal device, called WINCS (wireless instantaneous neurotransmitter concentration sensing), by making a multi-channel version called WINCS Harmoni.146Fig. 7 shows (A) a photograph of the WINCS Harmoni device, (B) schematic of the functional components, (C) the analog-to-digital converter, and (D) typical calibration curves from each of the four recording channels. The beauty of this device lies in four primary aspects: (1) the wireless component reduces instrumentation clutter, (2) the multi-channel allows for simultaneous FSCV DA recordings in up to four channels, (3) the design allows for concurrent recordings of both striatal DA and 5-HT in the substantia nigra (SNr), and (4) a closed loop paradigm that gives the user the ability to adjust deep brain stimulation parameters based on real-time monitoring of neurotransmitter release in vivo. The authors successfully demonstrated the versatility of this device in swine, rodent, and non-human primate models.147
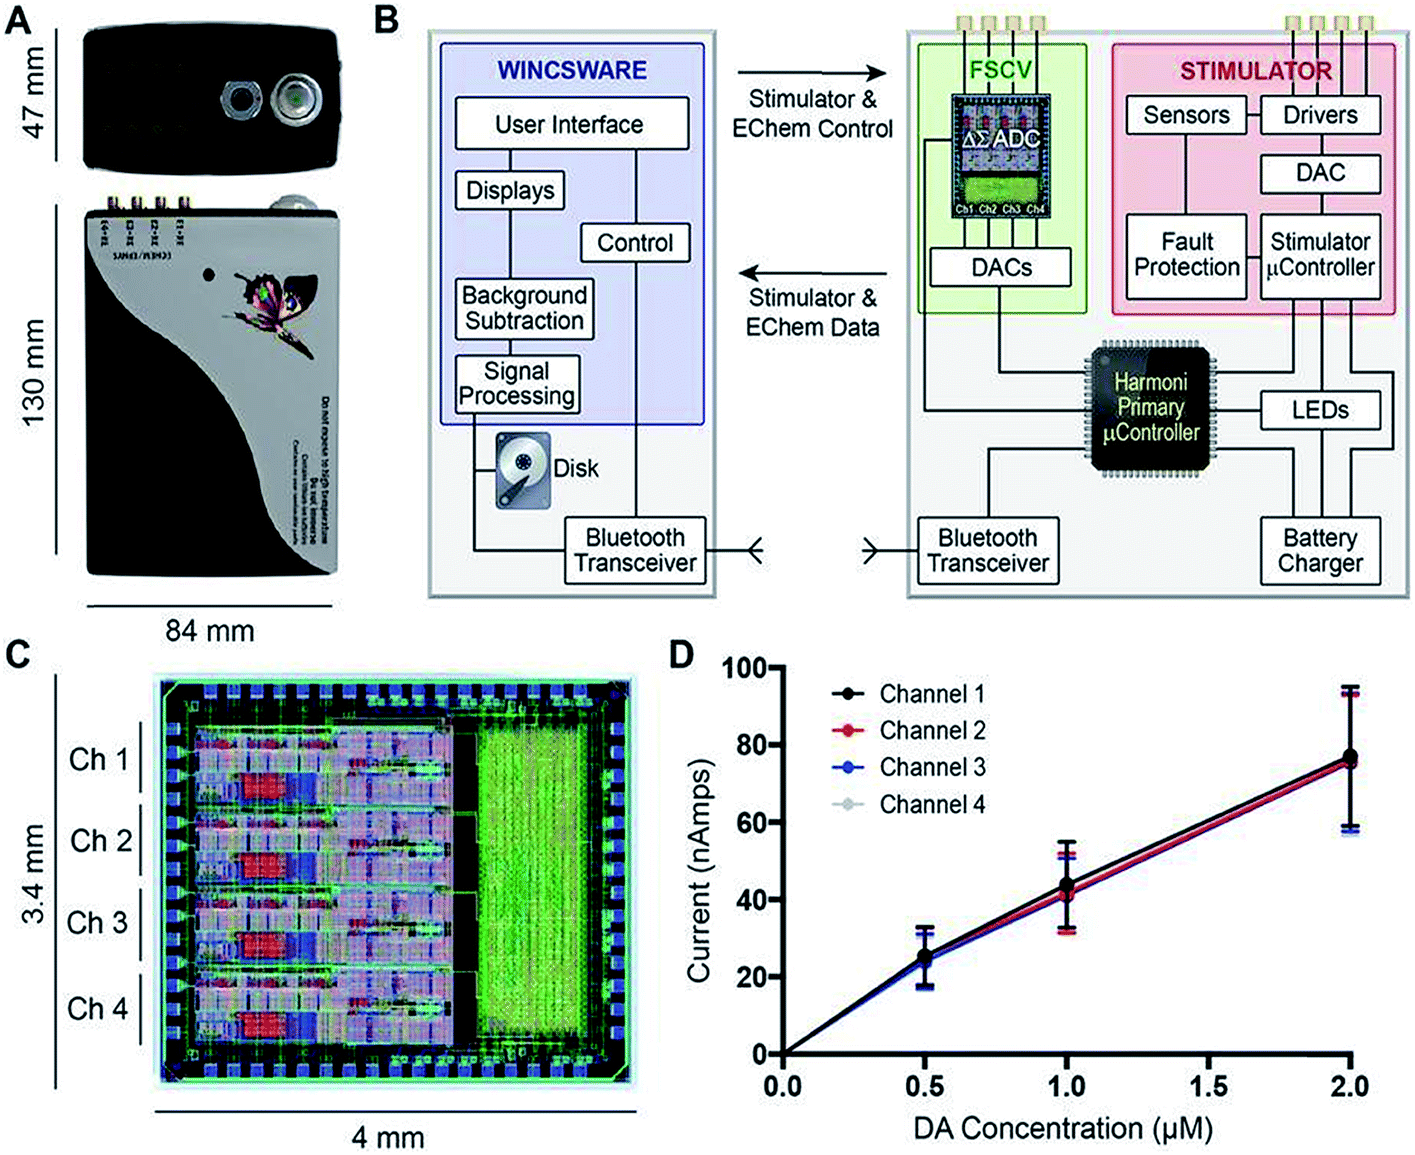 | ||
| Fig. 7 (A) Photograph of the WINCS Harmoni device; (B) schematic diagram showing the functional components in WINCS Harmoni, including the neurochemical sensing and stimulation boards, charging components, bluetooth transceiver, primary microcontroller, and control software in the base station; (C) image and dimensions of the WINCS Harmoni delta sigma (ΔΣ) analog-to-digital converter (ADC) that enables four channels of simultaneous neurochemical recordings; (D) typical calibration curves for each of the four neurochemical recording channels in WINCS Harmoni showing a linear relationship between DA oxidation current and DA concentration. Reproduced with permission from Lee et al.148 | ||
Spreading depolarization (SD) is a pathological process characterized by propagating waves of cell firing. SD waves can be diagnostic events for cell death in penumbral tissues but because of the non-specific firing associated with SD waves, multi-modal analyses are necessary for investigation of the phenomenon. Hobbs et al. created an integrated multimodal device that monitors oxygen levels (an indicator of cerebral blood flow and energy consumption) concurrently with DA and single unit recordings.151 The benefit of this microdevice is that it eliminated the need for multiple sensors, which are cumbersome but also cause significantly tissue damage. The group observed significant oxygen and DA fluctuations during spreading depolarization events.
Other notable publications include a multi-functional microelectrode array that contained nearly 60![[thin space (1/6-em)]](https://www.rsc.org/images/entities/char_2009.gif) 000 electrodes and over 2000 electrophysiology channels for stimulation, FSCV, and impedance measurements in rat cortical neurons and cerebellar slices.152
000 electrodes and over 2000 electrophysiology channels for stimulation, FSCV, and impedance measurements in rat cortical neurons and cerebellar slices.152
Serotonin (5-HT)
Introduction
5-HT is a neuromodulator with a complex receptor profile. On the postsynaptic cell, 5-HT receptors include 2 inhibitory and 11 excitatory G protein-coupled receptors (GCPRs), and a ligand-gated ion channel (5-HT3). 5-HT signals are terminated via multiple mechanisms:(a) Reuptake into presynaptic neuron and glia by 5-HT transporters (SERTs), known as Uptake 1.
(b) Reuptake into other neuron types by monoamine transporters (DATs, norepinephrine transporters (NETs) or organic cation transporters (OCTs)), known as Uptake 2.
(c) Presynaptic autoreceptor binding.
(d) Intracellular metabolism by monoamine oxidases.153,154
5-HT is electroactive like DA, however, it has been greatly challenging to apply the tools successful for DA analysis to 5-HT measurements. For many decades, electrochemical 5-HT measurements were limited to ex vivo preparations such as cerebral spinal fluid155 or tissue slice preparations.156 Direct 5-HT detection in vivo was not achieved as early as DA detection because 5-HT oxidation products rapidly polymerize and foul the electrode surface. In 1995, Jackson et al. set the groundwork for detecting exogenous 5-HT in vivo using FSCV with a novel waveform (+0.2 to +1.0 to −0.1 to +0.2 V, 1000 V s−1), that dramatically decreased electrode fouling.157 They utilized this waveform in a ‘mock’ in vivo experiment, modeled after an experiment performed by Stamford et al., where dopaminergic neurons were induced to release 5-HT via inhibition of DA synthesis and preloading with 5-hydroxytryptophan (5-HTP), the 5-HT precursor.158 In 2009, Hashemi et al. were the first to describe endogenous 5-HT measurements in mammalian models.139 They described the primary difficulty of in vivo measurements as 5-HT's highly concentrated, electroactive metabolite, 5-hydroxyindoleacetic acid (5-HIAA) (not present in tissue slice preparations). Using a combination of the Jackson waveform and electrodeposition of Nafion™, they were able to measure 5-HT in vivo in the rat SNr.139 The following section details recent keynote studies utilizing 5-HT FSCV in physiological investigations.
Serotonin's role in affective disorders
Diagnosis of affective (mood) disorders would greatly benefit from electrochemical 5-HT detection. 5-HT is thought to modulate mood; it has long been postulated that 5-HT deficiency underlies the behavioral phenotypes of affective disorders such as depression.159 However, this hypothesis (the monoamine theory of depression) has been difficult to verify because of the challenge of measuring 5-HT in vivo on neurotransmission timescales. Using FSCV it is now possible to measure 5-HT with high temporal and spatial resolution in vivo. This has strengthened our knowledge of 5-HT physiology and pharmacology, as reviewed below, and will ultimately enable characterization of 5-HT in affective disease models.In 2014, Wood et al. found that 5-HT in the mouse SNr had three uptake profiles: slow (>20 seconds), fast (<10 seconds), and hybrid (a combination of the slow and fast), with the hybrid mechanism being the most common of the uptake profile encountered in vivo.160 The ‘fast’ and ‘slow’ responses were identified as two distinct clearance mechanisms: Uptake 1 (slow), mediated by the SERTs, and Uptake 2 (fast), mediated by other monoamine transporters (DATs, NETs, and OCTs). This study also found that the electrical stimulation created autoreceptor inhibition of 5-HT that lasted tens of seconds.160 West et al. observed a “double peak” phenomenon in the mouse medial prefrontal cortex (mPFC) (Fig. 8),161 in which two 5-HT events were released upon electrical stimulation of the medial forebrain bundle (MFB). This is in contrast to the one evoked peak typically seen in other brain regions.160,162 Consistently, layers 1–3 of the mPFC produced a single evoked peak, whereas layers 5 and 6 produced a double peak.161 The authors hypothesized two types of 5-HT input to the terminal, linked to discrete reuptake domains. An example of the double peak and the discrete reuptake domains are shown in Fig. 8.
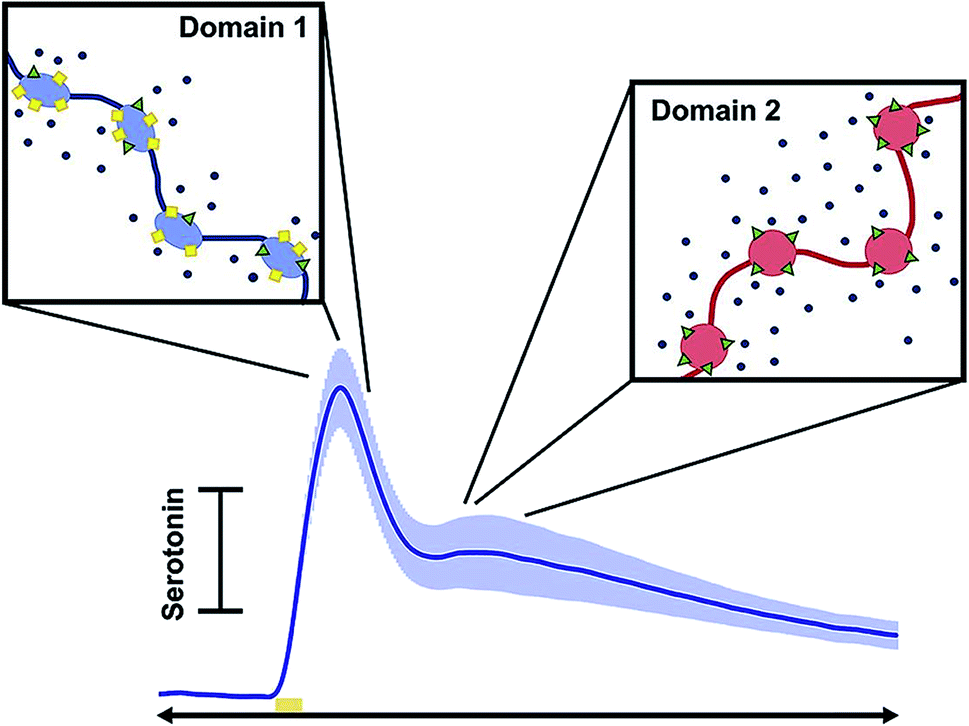 | ||
| Fig. 8 Schematic showing how each peak in the current vs. time trace corresponds to different uptake mechanisms. Reproduced with permission from West, A., et al.161 | ||
Extracellular 5-HT is thought to be lower during depression,163 therefore selective 5-HT reuptake inhibitors (SSRIs), which inhibit the SERTs (presumably increasing extracellular 5-HT levels) are a common treatment. Wood and Hashemi administered acute doses of a common SSRI, escitalopram, to mice. The group found that the effects of this drug on 5-HT were dynamic, not reaching a steady state before drug metabolism.164 This study suggested that dose–response curves should be redesigned. The Wightman group investigated the effects of SSRIs on autoreceptor-mediated inhibitory feedback and showed involvement of multiple modulatory mechanisms in response to the SSRI.165 These studies clearly show that SSRI effects on the 5-HT system are complex and in need of further study.
While in vivo 5-HT FSCV studies are ongoing recent technical advancements including spatial improvements, simultaneous detection of analytes and ambient 5-HT measurements are enriching the chemical toolbox with which 5-HT can be studied.
Novel technical advancements for serotonin measurements
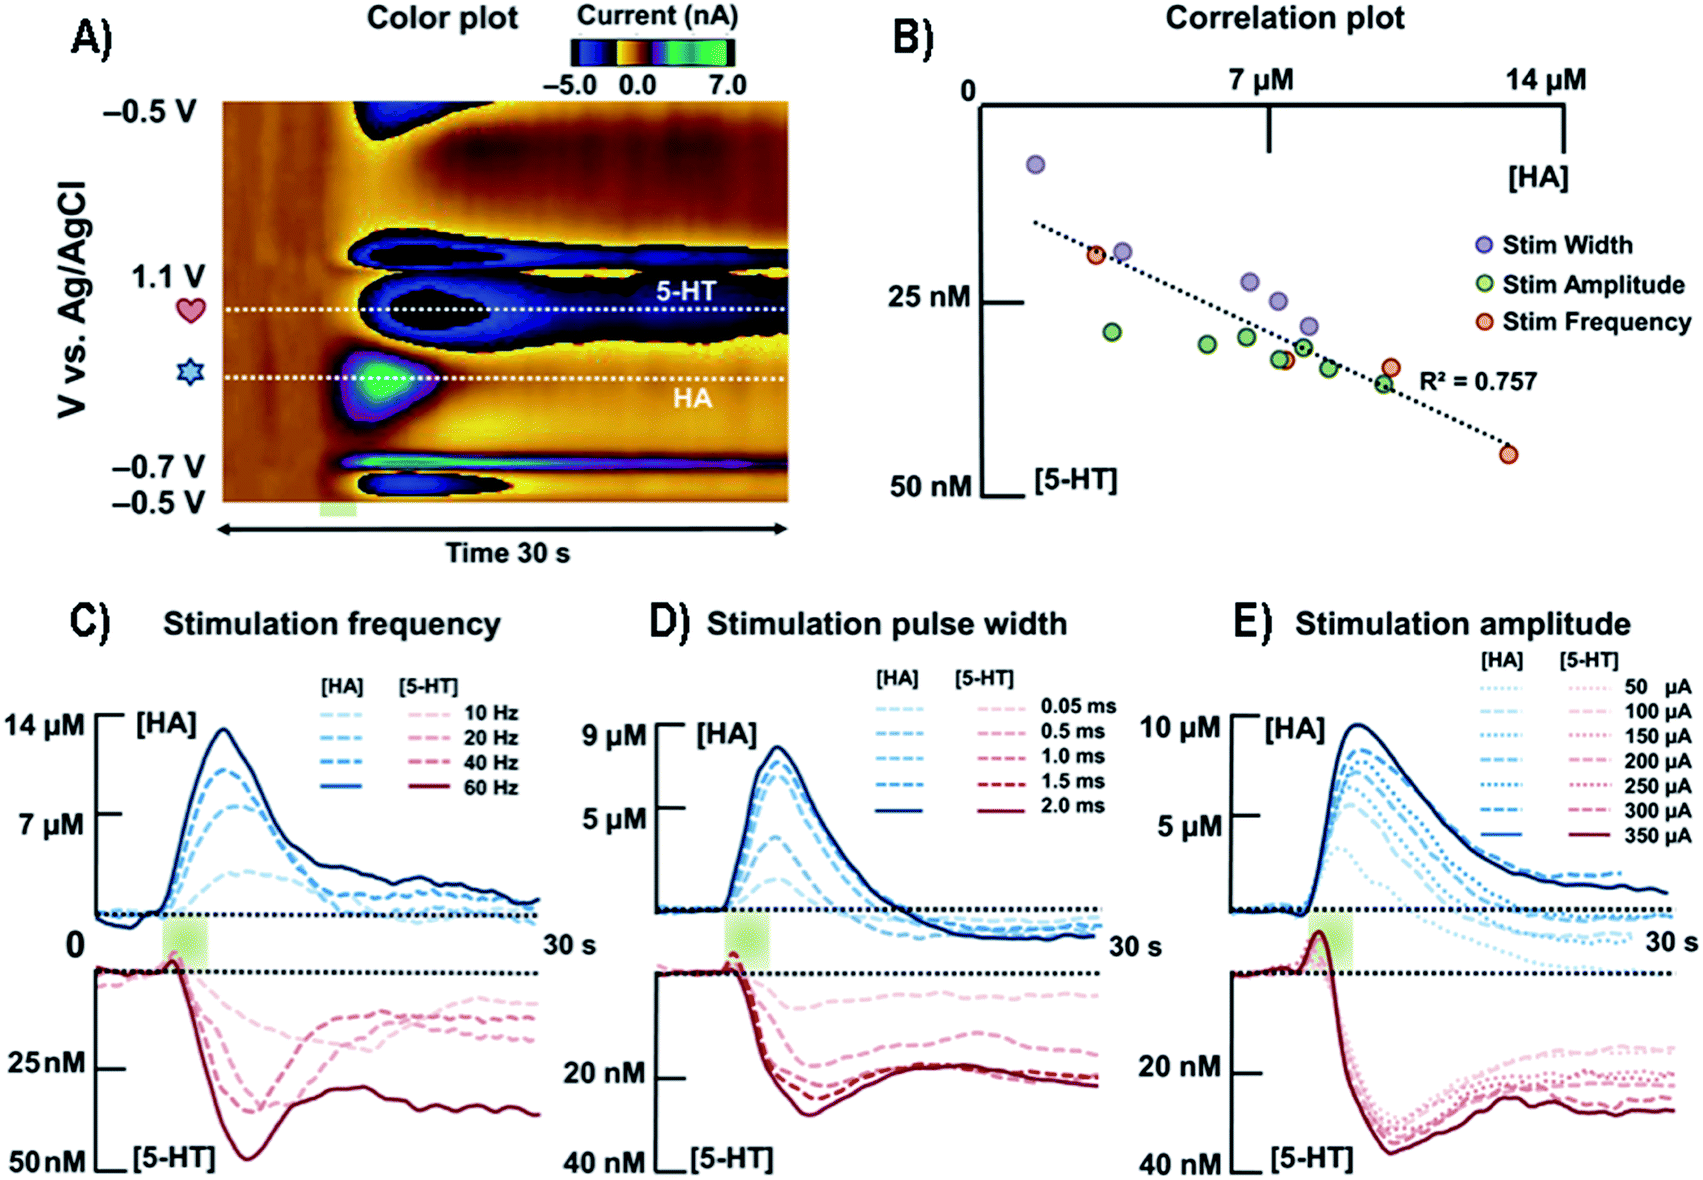 | ||
| Fig. 9 (A) Representative color plot of the stimulated release of HA and 5-HT inhibition in the premammillary nucleus. (B) Correlation plot between [HA] and [5-HT] for all stimulation parameters. (C) Averaged current versus time traces along the two horizontal dashed lines of HA and 5-HT with respect to different stimulation frequencies (n = 5). (D) Averaged current responses to various stimulation pulse widths of HA and 5-HT (n = 5). (E) Averaged current responses to various stimulation amplitudes of HA and 5-HT (n = 5). HA, HA; 5-HT, 5-HT. Reproduced from Samaranayake et al. with permission.172 | ||
Other notable studies include the WINCS Harmoni wireless device created by Lee et al.148 that simultaneously detects 5-HT in the SNr and DA in the striatum. More details on WINCS Harmoni can be found in the DA section of this review (vide supra). The Dayan lab created a mathematical algorithm capable of separating DA and 5-HT signals in humans.173 Finally, the Cai and Liu labs are working on electrochemical arrays with the capability of measuring 5-HT with other analyte and the potential for future in vivo analysis.174,175
Other neurochemicals
As the community develops better tools for defining the roles of neurotransmitters in disease, we can better focus diagnostic tests on neurotransmitters specific to distinct disorders. GABA is the most abundant inhibitory neurotransmitter.177 Because GABA is not easily redox active, electrochemical analysis of this neurotransmitter is challenging.178 The Shen lab applied their nanopipette approach to GABA.179 Unlike the analytes reviewed here, GABA is a zwitterion at neutral pH; this phenomenon makes it very difficult to partition GABA between phases. To facilitate partitioning between phases, octanoic acid was added to lower the pH along with dibenzo-18-crown-6, thus detection of protonated GABA.179 The Arumugam lab took an interesting electrochemical approach to detecting GABA simultaneously with Glu using a microarray with GABA and Glu biosensors. On site 1 of the array is a Glu biosensor and on site 2 is a GABA biosensor side-by-side with a second Glu biosensor. The group measured the current generated from H2O2 oxidation at both electrodes. The current at site 1 was due to Glu only. The current at site 2 was due to Glu and GABA, therefore subtraction of site 1 current from site 2 allowed GABA quantification.180Peptides are strings of amino acids that act as signaling molecules in the brain. The Sombers lab created a sawhorse FSCV waveform to detect Met-enkephalins. The detection scheme is shown in Fig. 10. The sawhorse FSCV waveform (Fig. 10B) is modified from the conventional one used for DA detection (Fig. 10A). Using the conventional waveform produced significant electrode fouling (Fig. 10C, asterisk), which was not observed in the color plot for modified sawhorse waveform. Their method has high selectivity, being able to distinguish Leu- and Met-enkephalin, which differ by a single amino acid.181 The group successfully measured norepinephrine and Met-enkephalin release after mild electrical stimulation in adrenal tissue slice.
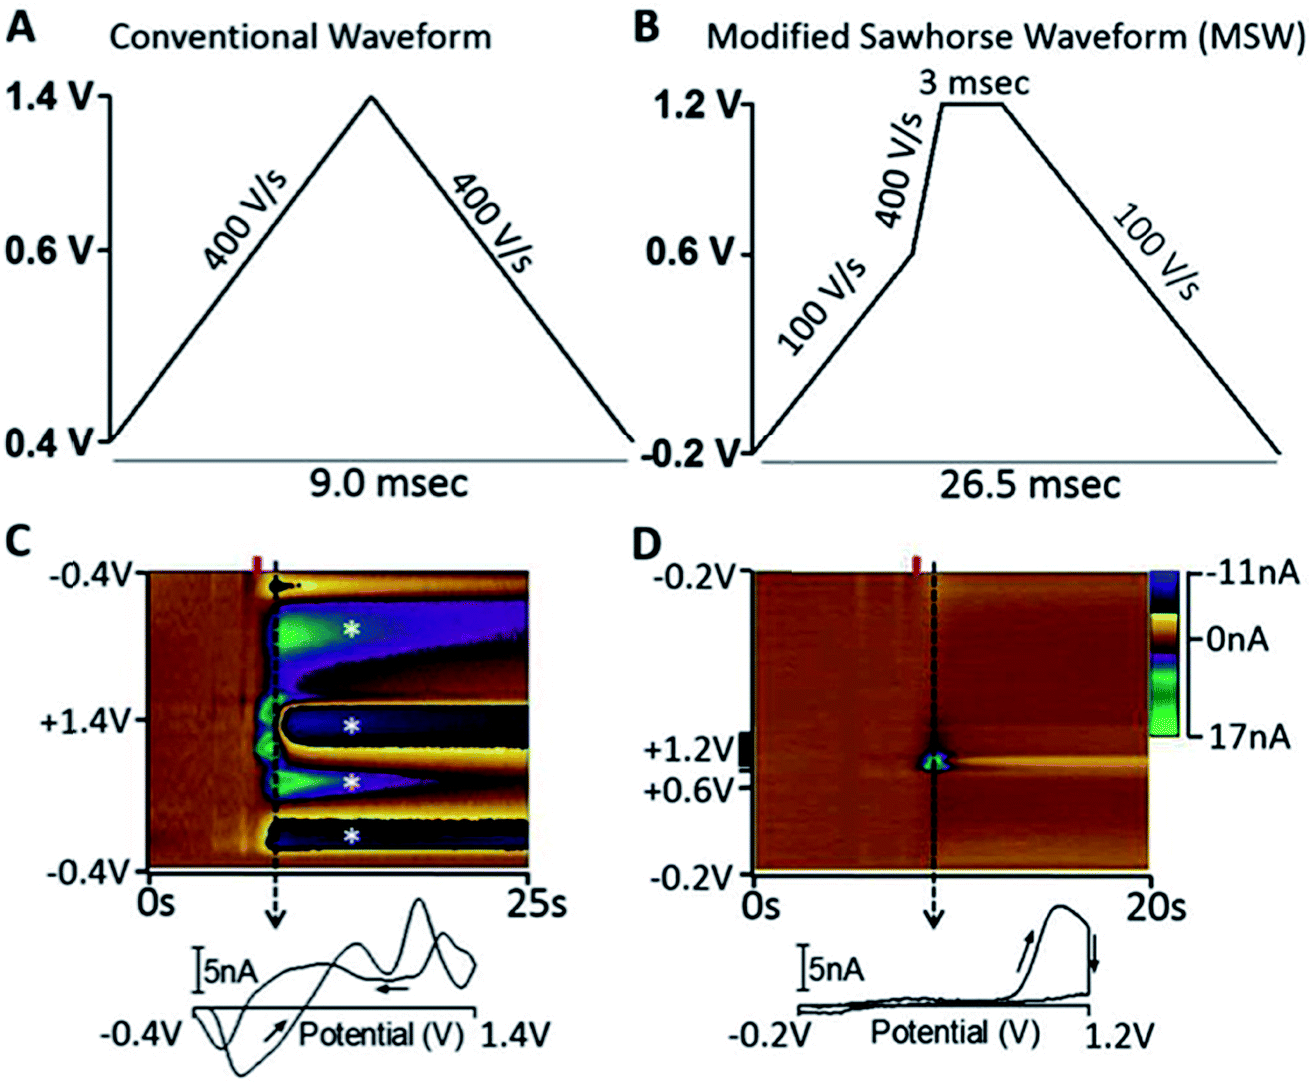 | ||
| Fig. 10 (A) Triangular waveform. (B) Modified sawhorse waveform (MSW). (C and D) Representative in vitro voltammetric data collected using the waveforms depicted in parts A and B, respectively, where the ordinate is the potential applied to the carbon-fiber electrode, the abscissa is time in seconds, and the current (nA) is depicted in false color.55 2 μM M-ENK was introduced to the microelectrode at the time indicated by the red bar. Displayed voltammograms were extracted at the time indicated by the dashed line. Asterisks indicate electrode fouling. Reproduced with permission from Schmidt et al.181 | ||
The Venton group has been successful at measuring a variety of neurotransmitters including octopamine and adenosine.182–184 Octopamine is a biogenic amine in invertebrates that regulates intracellular cyclic AMP (adenosine monophosphate) and Ca2+.185 Pyakurel et al. first measured octopamine using FSCV in the ventral nerve cord of Drosophilia melanogaster larvae.182 Octopamine was released via optogenetic red light-stimulated release with a total simulation time of 1 s or less.182 Adenosine is a nucleoside produced from the breakdown of ATP. In the central nervous system, this molecule plays an important role in many biological processes, such as regulating neurotransmission and reducing excitotoxicity.183 Nguyen and Venton developed a method for direct adenosine detection using FSCV.183 Spontaneous adenosine transients were observed in addition to electrically and mechanically stimulated release.183In vivo clearance of spontaneous adenosine was shown to occur through multiple mechanisms in the rat caudate putamen.184 These mechanisms include reuptake through the equilibrative nucleoside transport 1, as well as metabolism of adenosine by adenosine deaminase and adenosine kinase.184 Ganesana et al. examined spontaneous adenosine transients during cerebral ischemia.186 They found a 52% increase in the number of adenosine transients and a 53% increase in cumulative adenosine concentration during the early stages of cerebral ischemia as compared to normoxia control rats.186 Another group that studied adenosine developed synthetic boron-doped diamond-based electrodes for chronic in vivo measurements of adenosine in humans undergoing deep brain stimulation187 surgeries for tremor treatment. These diamond-based electrodes, showing little to no degradation even after 5.2 million cycles of FSCV experiments (144 h at 10 Hz), are two-orders of magnitude more robust than carbon fiber-based electrodes.187
Melatonin is a hormone produced by the pineal gland and lymph nodes188 and is thought to play a role in regulating circadian rhythm.189 The Ross lab developed a new waveform to selectively detect melatonin and to reduce fouling otherwise observed with conventional waveforms.190 The authors successfully used this new waveform for melatonin detection in lymph node tissue slice preparations.190 In a similar approach, the same group developed a novel waveform for detection of the neuromodulator guanosine.191 Their optimized approach was selective for guanosine over adenosine because two oxidation events were observed for guanosine at +0.8 V and +1.3 V. This method was successfully applied to measuring exogenously applied guanosine in tissue slice preparations.191
Conclusion and future direction
Neurochemical diagnosis for brain disorders is not available due to a lack of in vivo sensors capable of monitoring neurotransmitters and neuromodulators. This review highlighted advancements made in the field of electrochemical microdevices over the past five years for detection and quantification of neurochemical biomarkers of brain disorders. The potential for these analytes to act as biomarkers was discussed and novel measurement methods were highlighted. Specifically, we began each neurotransmitter section with a discussion of what we have learned thus far about the role of each of them in various applicable brain physiology using existing and emerging electrochemical techniques. We then focused on emerging biosensor technology for Glu and 5-HT detection and voltammetric methods for DA and 5-HT measurements. We ended the review with discussion about other neuromodulators of interest, e.g. peptides, adenosine, etc., and what tools were designed to measure them.Via this review we highlighted the considerable progress made thus far in the field of electrochemical sensing for in vivo neurotransmitters. However, there are still challenges that need to be addressed when moving towards diagnostic devices. First, probe size remains problematic. Implantation is a physical perturbation to brain tissue. Ongoing efforts to make probe sizes comparable to interneuron distances will minimize damage and reduce inflammation. Furthermore, ongoing miniaturization to nanometer scales will allow synaptic measurements. Second, electrochemical sensing is limited to a few electroactive species. Peptides and proteins still evade detection via electrochemical sensors and thus cannot be measured with the same spatiotemporal resolution as smaller, more classical neuromodulators. Future horizons for this type of work may include aptamer modifications to electrodes. Lastly, and perhaps the most significant, there exist no clinical measurements in humans but we are confident, due to the rapid progress in the field reviewed here, that such measurements will be facilitated in the near future.
List of abbreviations
| Glu | Glutamate |
| DA | Dopamine |
| Ach | Acetylcholine |
| 5-HT | Serotonin |
| HA | Histamine |
| GABA | Gamma-aminobutyric acid |
| DNA | Deoxyribonucleic acid |
| NDMA | N-Methyl-D-aspartate |
| AMPA | α-Amino-3-hydroxy-5-methyl-4-isoxazole-propionic acid |
| PFC | Prefrontal cortex |
| mPFC | Medial prefrontal cortex |
| AA | Ascorbic acid |
| ITIES | Interface between two immiscible electrolyte solutions |
| CFMs | Carbon fiber microelectrodes |
| FSCV | Fast scan cyclic voltammetry |
| FSCAV | Fast scan controlled adsorption voltammetry |
| WINCS | Wireless instantaneous neurotransmitter concentration sensing |
| SNr | Substantia nigra pars reticulata |
| DANA | Dopamine and neural activity |
| SD | Spreading depolarization |
| 5-HTP | 5-Hydroxytryptophan |
| 5-HIAA | 5-Hydroxyindoleacetic acid |
| SERTs | Selective serotonin reuptake inhibitors |
| DATs | Dopamine transporters |
| NETs | Norepinephrine transporters |
| OCTs | Organic cation transporters |
Conflicts of interest
There are no conflicts to declare.Acknowledgements
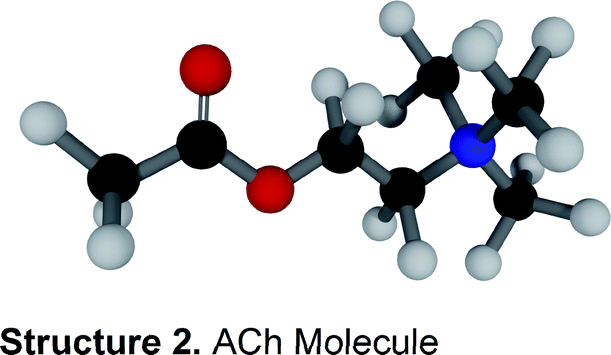
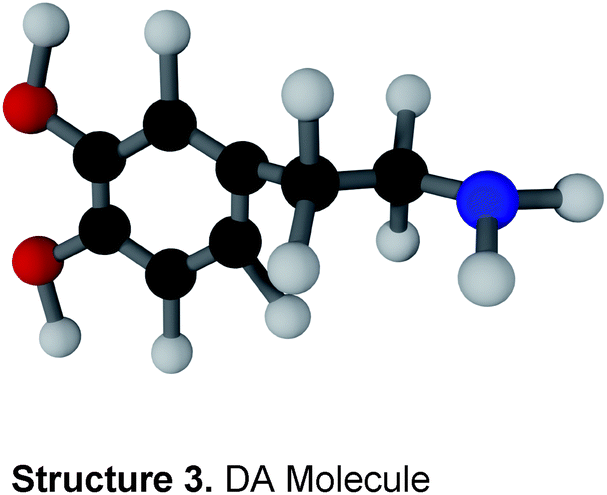
The authors would like to thank Jordan Holmes for making the neurotransmitter molecules and both Jordan Holmes and Shane Berger for their contributions to the TOC image. The National Institutes of Health (R01 MH106563 for P. H.) funded this work.References
- M. Oaklander, Time Magazine, 2017, 190, 38–45 Search PubMed.
- F. A. Settle, Handbook of instrumental techniques for analytical chemistry, Prentice Hall PTR, Upper Saddle River, NJ, 1997 Search PubMed.
- E. Dankoski and R. Wightman, Front. Integr. Neurosci., 2013, 7, 44 CrossRef CAS PubMed.
- A. Jaquins-Gerstl and A. C. Michael, Analyst, 2015, 140, 3696–3708 RSC.
- S. V. Dzyadevych, V. N. Arkhypova, A. P. Soldatkin, A. V. El'skaya, C. Martelet and N. Jaffrezic-Renault, IRBM, 2008, 29, 171–180 CrossRef.
- T. D. Y. Kozai, A. S. Jaquins-Gerstl, A. L. Vazquez, A. C. Michael and X. T. Cui, ACS Chem. Neurosci., 2015, 6, 48–67 CrossRef CAS PubMed.
- W. Putzbach and J. N. Ronkainen, Sensors, 2013, 13, 4811–4840 CrossRef CAS PubMed.
- D. C. Javitt, Mol. Psychiatry, 2004, 9, 984 CrossRef CAS PubMed.
- B. S. Meldrum, J. Nutr., 2000, 130, 1007S–1015S CrossRef CAS PubMed.
- E. E. Benarroch, Neurology, 2010, 74, 259 CrossRef PubMed.
- Y. Zhou and N. C. Danbolt, J. Neural Transm., 2014, 121, 799–817 CrossRef CAS PubMed.
- H. Kusakabe, Y. Midorikawa, T. Fujishima, A. Kuninaka and H. Yoshino, Agric. Biol. Chem., 1983, 47, 1323–1328 CAS.
- N. V. Kulagina, L. Shankar and A. C. Michael, Anal. Chem., 1999, 71, 5093–5100 CrossRef CAS PubMed.
- J. Hu, S. Wisetsuwannaphum and J. S. Foord, Faraday Discuss., 2014, 172, 457–472 RSC.
- O. Frey, T. Holtzman, R. M. McNamara, D. E. H. Theobald, P. D. van der Wal, N. F. de Rooij, J. W. Dalley and M. Koudelka-Hep, Biosens. Bioelectron., 2010, 26, 477–484 CrossRef CAS PubMed.
- A. Weltin, J. Kieninger and G. A. Urban, Anal. Bioanal. Chem., 2016, 408, 4503–4521 CrossRef CAS PubMed.
- N. Vasylieva, C. Maucler, A. Meiller, H. Viscogliosi, T. Lieutaud, D. Barbier and S. Marinesco, Anal. Chem., 2013, 85, 2507–2515 CrossRef CAS PubMed.
- W. H. Scouten, J. H. T. Luong and R. Stephen Brown, Trends Biotechnol., 1995, 13, 178–185 CrossRef CAS.
- R. S. Freire, C. A. Pessoa, L. D. Mello and L. T. Kubota, J. Braz. Chem. Soc., 2003, 14, 230–243 CrossRef CAS.
- W. Putzbach and N. J. Ronkainen, Sensors, 2013, 13, 4811–4840 CrossRef CAS PubMed.
- G. Hughes, R. M. Pemberton, P. R. Fielden and J. P. Hart, TrAC, Trends Anal. Chem., 2016, 79, 106–113 CrossRef CAS.
- G. Bidan, Sens. Actuators, B, 1992, 6, 45–56 CrossRef CAS.
- P. N. Bartlett and J. M. Cooper, J. Electroanal. Chem., 1993, 362, 1–12 CrossRef CAS.
- F. Palmisano, D. Centonze, A. Guerrieri and P. G. Zambonin, Biosens. Bioelectron., 1993, 8, 393–399 CrossRef CAS.
- S. A. Emr and A. M. Yacynych, Electroanalysis, 1995, 7, 913–923 CrossRef CAS.
- M. Trojanowicz and T. K. vel Krawczyk, Microchim. Acta, 1995, 121, 167–181 CrossRef CAS.
- N. Wahono, S. Qin, P. Oomen, T. I. F. Cremers, M. G. de Vries and B. H. C. Westerink, Biosens. Bioelectron., 2012, 33, 260–266 CrossRef CAS PubMed.
- A. Witkowski and A. Brajter-Toth, Anal. Chem., 1992, 64, 635–641 CrossRef CAS PubMed.
- N. Hamdi, J. Wang, E. Walker, N. T. Maidment and H. G. Monbouquette, J. Electroanal. Chem., 2006, 591, 33–40 CrossRef CAS.
- N. Hamdi, J. Wang and H. G. Monbouquette, J. Electroanal. Chem., 2005, 581, 258–264 CrossRef CAS.
- A. Morales-Villagrán, L. Medina-Ceja and S. J. López-Pérez, J. Neurosci. Methods, 2008, 168, 48–53 CrossRef PubMed.
- K. M. Wassum, V. M. Tolosa, J. Wang, E. Walker, H. G. Monbouquette and N. T. Maidment, Sensors, 2008, 8, 5023–5036 CrossRef CAS PubMed.
- K. M. Wassum, V. M. Tolosa, T. C. Tseng, B. W. Balleine, H. G. Monbouquette and N. T. Maidment, J. Neurosci., 2012, 32, 2734 CrossRef CAS PubMed.
- V. M. Tolosa, K. M. Wassum, N. T. Maidment and H. G. Monbouquette, Biosens. Bioelectron., 2013, 42, 256–260 CrossRef CAS PubMed.
- J. J. Burmeister and G. A. Gerhardt, Anal. Chem., 2001, 73, 1037–1042 CrossRef CAS PubMed.
- E. S. McLamore, S. Mohanty, J. Shi, J. Claussen, S. S. Jedlicka, J. L. Rickus and D. M. Porterfield, J. Neurosci. Methods, 2010, 189, 14–22 CrossRef CAS PubMed.
- H. Boo, R.-A. Jeong, S. Park, K. S. Kim, K. H. An, Y. H. Lee, J. H. Han, H. C. Kim and T. D. Chung, Anal. Chem., 2006, 78, 617–620 CrossRef CAS PubMed.
- A. Gholizadeh, S. Shahrokhian, A. Iraji zad, S. Mohajerzadeh, M. Vosoughi, S. Darbari and Z. Sanaee, Biosens. Bioelectron., 2012, 31, 110–115 CrossRef CAS PubMed.
- A. Gholizadeh, S. Shahrokhian, A. Iraji zad, S. Mohajerzadeh, M. Vosoughi, S. Darbari, J. Koohsorkhi and M. Mehran, Anal. Chem., 2012, 84, 5932–5938 CrossRef CAS PubMed.
- R. S. Dey, R. K. Bera and C. R. Raj, Anal. Bioanal. Chem., 2013, 405, 3431–3448 CrossRef CAS PubMed.
- F. Ricci and G. Palleschi, Biosens. Bioelectron., 2005, 21, 389–407 CrossRef CAS PubMed.
- F. Ricci, A. Amine, D. Moscone and G. Palleschi, Biosens. Bioelectron., 2007, 22, 854–862 CrossRef CAS PubMed.
- S. Qin, M. Van der Zeyden, H. W. Oldenziel, I. T. Cremers and H. B. Westerink, Sensors, 2008, 8, 6860–6884 CrossRef CAS PubMed.
- S. K. Hamdan and A. Mohd Zain, Malays. J. Med. Sci., 2014, 21, 12–26 Search PubMed.
- E. Naylor, D. V. Aillon, S. Gabbert, H. Harmon, D. A. Johnson, G. S. Wilson and P. A. Petillo, J. Electroanal. Chem., 2011, 656, 106–113 CrossRef CAS PubMed.
- M. V. Johnston, S. Ammanuel, C. O'Driscoll, A. Wozniak, S. Naidu and S. D. Kadam, Front. Syst. Neurosci., 2014, 8, 118 Search PubMed.
- M. Lenoir and E. A. Kiyatkin, J. Neurochem., 2013, 127, 541–551 CrossRef CAS PubMed.
- K. T. Wakabayashi and E. A. Kiyatkin, J. Neurophysiol., 2012, 108, 285–299 CrossRef CAS PubMed.
- M. A. Rahman, N.-H. Kwon, M.-S. Won, E. S. Choe and Y.-B. Shim, Anal. Chem., 2005, 77, 4854–4860 CrossRef CAS PubMed.
- M. Malvaez, V. Y. Greenfield, A. S. Wang, A. M. Yorita, L. Feng, K. E. Linker, H. G. Monbouquette and K. M. Wassum, Sci. Rep., 2015, 5, 12511 CrossRef CAS PubMed.
- M. D. Scofield, H. A. Boger, R. J. Smith, H. Li, P. G. Haydon and P. W. Kalivas, Biol. Psychiatry, 2015, 78, 441–451 CrossRef CAS PubMed.
- R. E. Özel, C. Ispas, M. Ganesana, J. C. Leiter and S. Andreescu, Biosens. Bioelectron., 2014, 52, 397–402 CrossRef PubMed.
- W. Shi, N. Lin, Y. Song, C. Liu, S. Zhou and X. Cai, Biosens. Bioelectron., 2014, 51, 244–248 CrossRef CAS PubMed.
- T. T. Tseng, C.-F. Chang and W.-C. Chan, Molecules, 2014, 19, 7341–7355 CrossRef PubMed.
- A. Weltin, J. Kieninger, B. Enderle, A.-K. Gellner, B. Fritsch and G. A. Urban, Biosens. Bioelectron., 2014, 61, 192–199 CrossRef CAS PubMed.
- A. Weltin, B. Enderle, J. Kieninger and G. A. Urban, IEEE Sens. J., 2014, 14, 3345–3351 CAS.
- M. Clay and H. G. Monbouquette, ACS Chem. Neurosci., 2018, 9, 241–251 CrossRef CAS PubMed.
- S. Sainio, T. Palomäki, N. Tujunen, V. Protopopova, J. Koehne, K. Kordas, J. Koskinen, M. Meyyappan and T. Laurila, Mol. Neurobiol., 2015, 52, 859–866 CrossRef CAS PubMed.
- B. Nasr, R. Chatterton, J. H. M. Yong, P. Jamshidi, G. M. D'Abaco, A. R. Bjorksten, O. Kavehei, G. Chana, M. Dottori and E. Skafidas, Biosensors, 2018, 8, 14 CrossRef PubMed.
- M. Jamal, S. Chakrabarty, M. A. Yousuf, A. Khosla and K. M. Razeeb, Microsyst. Technol., 2018, 24, 4193–4206 CrossRef CAS.
- H. Yu, Z. Ma and Z. Wu, Anal. Chim. Acta, 2015, 896, 137–142 CrossRef CAS PubMed.
- B. Liang, S. Zhang, Q. Lang, J. Song, L. Han and A. Liu, Anal. Chim. Acta, 2015, 884, 83–89 CrossRef CAS PubMed.
- G. Hughes, R. M. Pemberton, P. R. Fielden and J. P. Hart, Sens. Actuators, B, 2015, 216, 614–621 CrossRef CAS.
- F. Wu, P. Yu, X. Yang, Z. Han, M. Wang and L. Mao, J. Am. Chem. Soc., 2018, 140, 12700–12704 CrossRef CAS PubMed.
- K. M. Moore, B. T. Himmler, B. A. Teplitzky, M. D. Johnson and R. L. Meisel, J. Visualized Exp., 2017, 56135, DOI:10.3791/56135.
- G. Massicotte, S. Carrara, G. Di Micheli and M. Sawan, IEEE Trans. Biomed. Circuits Syst., 2016, 10, 731–741 Search PubMed.
- N. R. Ferreira, A. Ledo, J. Laranjinha, G. A. Gerhardt and R. M. Barbosa, Bioelectrochemistry, 2018, 121, 142–150 CrossRef CAS PubMed.
- W. Wei, Y. Song, L. Wang, S. Zhang, J. Luo, S. Xu and X. Cai, Microsyst. Nanoeng., 2015, 1, 15002 CrossRef.
- X. Fan, Y. Song, Y. Ma, S. Zhang, G. Xiao, L. Yang, H. Xu, D. Zhang and X. Cai, Sensors, 2016, 17, 61 CrossRef PubMed.
- M. R. Picciotto, M. J. Higley and Y. S. Mineur, Neuron, 2012, 76, 116–129 CrossRef CAS PubMed.
- M. G. Garguilo and A. C. Michael, TrAC, Trends Anal. Chem., 1995, 14, 164–169 CAS.
- K. M. Mitchell, Anal. Chem., 2004, 76, 1098–1106 CrossRef CAS PubMed.
- J. P. Bruno, C. Gash, B. Martin, A. Zmarowski, F. Pomerleau, J. Burmeister, P. Huettl and G. A. Gerhardt, Eur. J. Neurosci., 2006, 24, 2749–2757 CrossRef PubMed.
- J. J. Burmeister, F. Pomerleau, P. Huettl, C. R. Gash, C. E. Werner, J. P. Bruno and G. A. Gerhardt, Biosens. Bioelectron., 2008, 23, 1382–1389 CrossRef CAS PubMed.
- V. Parikh, F. Pomerleau, P. Huettl, G. A. Gerhardt, M. Sarter and J. P. Bruno, Eur. J. Neurosci., 2004, 20, 1545–1554 CrossRef PubMed.
- J. J. Burmeister, M. Palmer and G. A. Gerhardt, Anal. Chim. Acta, 2003, 481, 65–74 CrossRef CAS.
- W. M. Howe, A. S. Berry, J. Francois, G. Gilmour, J. M. Carp, M. Tricklebank, C. Lustig and M. Sarter, J. Neurosci., 2013, 33, 8742 CrossRef CAS PubMed.
- H. J. Gritton, W. M. Howe, C. S. Mallory, V. L. Hetrick, J. D. Berke and M. Sarter, Proc. Natl. Acad. Sci. U. S. A., 2016, 113, E1089–E1097 CrossRef CAS PubMed.
- W. M. Howe, H. J. Gritton, N. A. Lusk, E. A. Roberts, V. L. Hetrick, J. D. Berke and M. Sarter, J. Neurosci., 2017, 37, 3215–3230 CrossRef CAS PubMed.
- L. M. Teles-Grilo Ruivo, K. L. Baker, M. W. Conway, P. J. Kinsley, G. Gilmour, K. G. Phillips, J. T. R. Isaac, J. P. Lowry and J. R. Mellor, Cell Rep., 2017, 18, 905–917 CrossRef CAS PubMed.
- M. L. Colombo, J. V. Sweedler and M. Shen, Anal. Chem., 2015, 87, 5095–5100 CrossRef CAS PubMed.
- T. M. Welle, K. Alanis, M. L. Colombo, J. V. Sweedler and M. Shen, Chem. Sci., 2018, 9, 4937–4941 RSC.
- M. Shen, Z. Qu, J. T. DesLaurier, T. M. Welle, J. V. Sweedler and R. Chen, J. Am. Chem. Soc., 2018, 140, 7764–7768 CrossRef CAS PubMed.
- K. L. Baker, F. B. Bolger and J. P. Lowry, Analyst, 2015, 140, 3738–3745 RSC.
- F. E. Kanik, M. Kolb, S. Timur, M. Bahadir and L. Toppare, Int. J. Biol. Macromol., 2013, 59, 111–118 CrossRef CAS PubMed.
- J.-R. Cai, L.-N. Zhou and E. Han, Anal. Sci., 2014, 30, 669–673 CrossRef CAS PubMed.
- T. Itoh, T. Shimomura, A. Hayashi, A. Yamaguchi, N. Teramae, M. Ono, T. Tsunoda, F. Mizukami, G. D. Stucky and T.-a. Hanaoka, Analyst, 2014, 139, 4654–4660 RSC.
- N. Chauhan, J. Narang and U. Jain, Analyst, 2015, 140, 1988–1994 RSC.
- R. M. Santos, J. Laranjinha, R. M. Barbosa and A. Sirota, Biosens. Bioelectron., 2015, 69, 83–94 CrossRef CAS PubMed.
- M. P. S. Mousavi, M. K. Abd El-Rahman, A. M. Mahmoud, R. M. Abdelsalam and P. Bühlmann, ACS Sens., 2018, 3, 2581–2589 CrossRef CAS PubMed.
- J. D. Keighron, J. Wigström, M. E. Kurczy, J. Bergman, Y. Wang and A.-S. Cans, ACS Chem. Neurosci., 2015, 6, 181–188 CrossRef CAS PubMed.
- Y. Zhang, M. A. Arugula, J. S. Kirsch, X. Yang, E. Olsen and A. L. Simonian, Langmuir, 2015, 31, 1462–1468 CrossRef CAS PubMed.
- P. Monti, G. Calia, S. Marceddu, M. A. Dettori, D. Fabbri, S. Jaoua, R. D. O'Neill, Q. Migheli, G. Delogu and P. A. Serra, Talanta, 2017, 162, 151–158 CrossRef CAS PubMed.
- N. Chauhan and C. S. Pundir, Biosens. Bioelectron., 2014, 61, 1–8 CrossRef CAS PubMed.
- N. Chauhan, S. Chawla, C. S. Pundir and U. Jain, Biosens. Bioelectron., 2017, 89, 377–383 CrossRef CAS PubMed.
- D. Sulzer, S. J. Cragg and M. E. Rice, Basal Ganglia, 2016, 6, 123–148 CrossRef PubMed.
- A. G. Ewing, R. M. Wightman and M. A. Dayton, Brain Res., 1982, 249, 361–370 CrossRef CAS PubMed.
- R. M. Wightman, L. J. May and A. C. Michael, Anal. Chem., 1988, 60, 769A–793A CrossRef CAS PubMed.
- M. L. A. V. Heien, P. E. M. Phillips, G. D. Stuber, A. T. Seipel and R. M. Wightman, Analyst, 2003, 128, 1413–1419 RSC.
- P. Takmakov, M. K. Zachek, R. B. Keithley, P. L. Walsh, C. Donley, G. S. McCarty and R. M. Wightman, Anal. Chem., 2010, 82, 2020–2028 CrossRef CAS PubMed.
- J. O. Schenk, E. Miller, M. E. Rice and R. N. Adams, Brain Res., 1983, 277, 1–8 CrossRef CAS PubMed.
- B. J. Venton and R. M. Wightman, Anal. Chem., 2003, 75, 414A–421A CrossRef CAS.
- P. M. Kovach, A. G. Ewing, R. L. Wilson and R. M. Wightman, J. Neurosci. Methods, 1984, 10, 215–227 CrossRef CAS PubMed.
- J. O. Howell, W. G. Kuhr, R. E. Ensman and R. M. Wightman, J. Electroanal. Chem. Interfacial Electrochem., 1986, 209, 77–90 CrossRef CAS.
- W. G. Kuhr and R. M. Wightman, Brain Res., 1986, 381, 168–171 CrossRef CAS PubMed.
- G. V. Rebec, J. R. C. Christensen, C. Guerra and M. T. Bardo, Brain Res., 1997, 776, 61–67 CrossRef CAS PubMed.
- P. E. M. Phillips, G. D. Stuber, M. L. A. V. Heien, R. M. Wightman and R. M. Carelli, Nature, 2003, 422, 614 CrossRef CAS PubMed.
- C. A. Owesson-White, J. F. Cheer, M. Beyene, R. M. Carelli and R. M. Wightman, Proc. Natl. Acad. Sci. U. S. A., 2008, 105, 11957 CrossRef CAS PubMed.
- S. B. Flagel, J. J. Clark, T. E. Robinson, L. Mayo, A. Czuj, I. Willuhn, C. A. Akers, S. M. Clinton, P. E. M. Phillips and H. Akil, Nature, 2010, 469, 53 CrossRef PubMed.
- M. W. Howe, P. L. Tierney, S. G. Sandberg, P. E. M. Phillips and A. M. Graybiel, Nature, 2013, 500, 575 CrossRef CAS PubMed.
- C. M. Cameron, R. M. Wightman and R. M. Carelli, Neuropharmacology, 2016, 111, 223–230 CrossRef CAS PubMed.
- A. K. Radke, A. Kocharian, D. P. Covey, D. M. Lovinger, J. F. Cheer, Y. Mateo and A. Holmes, Eur. J. Neurosci., 2018 DOI:10.1111/ejn.14152.
- K. J. Pultorak, S. A. Schelp, D. P. Isaacs, G. Krzystyniak and E. B. Oleson, eNeuro, 2018, 5 DOI:10.1523/ENEURO.0058-1518.2018.
- J. M. Wenzel, E. B. Oleson, W. N. Gove, A. B. Cole, U. Gyawali, H. M. Dantrassy, R. J. Bluett, D. I. Dryanovski, G. D. Stuber and K. Deisseroth, Curr. Biol., 2018, 28, 1392–1404 CrossRef CAS PubMed.
- R. N. Gentry, D. R. Schuweiler and M. R. Roesch, Brain Res., 2018 DOI:10.1016/j.brainres.2018.1010.1008..
- L. Naef, L. Seabrook, J. Hsiao, C. Li and S. L. Borgland, Eur. J. Neurosci., 2018 DOI:10.1111/ejn.14291.
- E. S. Calipari, B. Juarez, C. Morel, D. M. Walker, M. E. Cahill, E. Ribeiro, C. Roman-Ortiz, C. Ramakrishnan, K. Deisseroth, M.-H. Han and E. J. Nestler, Nat. Commun., 2017, 8, 13877 CrossRef CAS PubMed.
- E. N. Graf, R. A. Wheeler, D. A. Baker, A. L. Ebben, J. E. Hill, J. R. McReynolds, M. A. Robble, O. Vranjkovic, D. S. Wheeler, J. R. Mantsch and P. J. Gasser, J. Neurosci., 2013, 33, 11800 CrossRef CAS PubMed.
- K. T. Kishida, I. Saez, T. Lohrenz, M. R. Witcher, A. W. Laxton, S. B. Tatter, J. P. White, T. L. Ellis, P. E. M. Phillips and P. R. Montague, Proc. Natl. Acad. Sci. U. S. A., 2016, 113, 200 CrossRef CAS PubMed.
- M. Shin, T. M. Field, C. S. Stucky, M. N. Furgurson and M. A. Johnson, ACS Chem. Neurosci., 2017, 8, 1880–1888 CrossRef CAS PubMed.
- S. V. Kaplan, R. A. Limbocker, R. C. Gehringer, J. L. Divis, G. L. Osterhaus, M. D. Newby, M. J. Sofis, D. P. Jarmolowicz, B. D. Newman and T. A. Mathews, ACS Chem. Neurosci., 2016, 7, 689–699 CrossRef CAS PubMed.
- T. M. Field, M. Shin, C. S. Stucky, J. Loomis and M. A. Johnson, ChemPhysChem, 2018, 19, 1192–1196 CrossRef CAS PubMed.
- A. A. Feduccia, J. A. Simms, D. Mill, H. Y. Yi and S. E. Bartlett, Br. J. Pharmacol., 2014, 171, 3420–3431 CrossRef CAS PubMed.
- M. Spanos, X. Xie, J. Gras-Najjar, S. C. White and L. A. Sombers, ACS Chem. Neurosci., 2019, 10, 1497–1505 CrossRef CAS PubMed.
- J. G. Roberts, J. V. Toups, E. Eyualem, G. S. McCarty and L. A. Sombers, Anal. Chem., 2013, 85, 11568–11575 CrossRef CAS PubMed.
- D. R. Schuweiler, C. D. Howard, E. S. Ramsson and P. A. Garris, Anal. Chem., 2018, 90, 13434–13442 CrossRef CAS PubMed.
- C. J. Meunier, J. G. Roberts, G. S. McCarty and L. A. Sombers, ACS Chem. Neurosci., 2017, 8, 411–419 CrossRef CAS PubMed.
- N. T. Rodeberg, S. G. Sandberg, J. A. Johnson, P. E. M. Phillips and R. M. Wightman, ACS Chem. Neurosci., 2017, 8, 221–234 CrossRef CAS PubMed.
- S. Nimbalkar, E. Castagnola, A. Balasubramani, A. Scarpellini, S. Samejima, A. Khorasani, A. Boissenin, S. Thongpang, C. Moritz and S. Kassegne, Sci. Rep., 2018, 8, 6958 CrossRef PubMed.
- H. N. Schwerdt, M. Kim, E. Karasan, S. Amemori, D. Homma, H. Shimazu, T. Yoshida, R. Langer, A. M. Graybiel and M. J. Cima, In 2017 IEEE 30th International Conference on Micro Electro Mechanical Systems (MEMS), IEEE, 2017, pp. 549–552 Search PubMed.
- H. N. Schwerdt, H. Shimazu, K.-i. Amemori, S. Amemori, P. L. Tierney, D. J. Gibson, S. Hong, T. Yoshida, R. Langer and M. J. Cima, Proc. Natl. Acad. Sci. U. S. A., 2017, 201713756 Search PubMed.
- C. A. Owesson-White, M. F. Roitman, L. A. Sombers, A. M. Belle, R. B. Keithley, J. L. Peele, R. M. Carelli and R. M. Wightman, J. Neurochem., 2012, 121, 252–262 CrossRef CAS PubMed.
- C. W. Atcherley, N. D. Laude, E. B. Monroe, K. M. Wood, P. Hashemi and M. L. Heien, ACS Chem. Neurosci., 2015, 6, 1509–1516 CrossRef CAS PubMed.
- C. W. Atcherley, K. M. Wood, K. L. Parent, P. Hashemi and M. L. Heien, Chem. Commun., 2015, 51, 2235–2238 RSC.
- M. H. Burrell, C. W. Atcherley, M. L. Heien and J. Lipski, ACS Chem. Neurosci., 2015, 6, 1802–1812 CrossRef CAS PubMed.
- Y. Oh, C. Park, D. H. Kim, H. Shin, Y. M. Kang, M. DeWaele, J. Lee, H.-K. Min, C. D. Blaha, K. E. Bennet, I. Y. Kim, K. H. Lee and D. P. Jang, Anal. Chem., 2016, 88, 10962–10970 CrossRef CAS PubMed.
- Y. Oh, M. L. Heien, C. Park, Y. M. Kang, J. Kim, S. L. Boschen, H. Shin, H. U. Cho, C. D. Blaha, K. E. Bennet, H. K. Lee, S. J. Jung, I. Y. Kim, K. H. Lee and D. P. Jang, Biosens. Bioelectron., 2018, 121, 174–182 CrossRef CAS PubMed.
- J. A. Johnson and R. M. Wightman, Electrochem. Soc. Interface, 2017, 26, 53–57 CrossRef CAS.
- P. Hashemi, E. C. Dankoski, J. Petrovic, R. B. Keithley and R. M. Wightman, Anal. Chem., 2009, 81, 9462–9471 CrossRef CAS PubMed.
- M. Spanos, J. Gras-Najjar, J. M. Letchworth, A. L. Sanford, J. V. Toups and L. A. Sombers, ACS Chem. Neurosci., 2013, 4, 782–789 CrossRef CAS PubMed.
- S. K. Smith, C. A. Lee, M. E. Dausch, B. M. Horman, H. B. Patisaul, G. S. McCarty and L. A. Sombers, ACS Chem. Neurosci., 2017, 8, 272–280 CrossRef CAS PubMed.
- J. Bergman, L. Mellander, Y. Wang and A.-S. Cans, Catalysts, 2018, 8, 34 CrossRef.
- F. H. Cincotto, T. C. Canevari, A. M. Campos, R. Landers and S. A. S. Machado, Analyst, 2014, 139, 4634–4640 RSC.
- D. Sangamithirai, S. Munusamy, V. Narayanan and A. Stephen, Mater. Sci. Eng., C, 2018, 91, 512–523 CrossRef CAS PubMed.
- B. Si and E. Song, Microelectron. Eng., 2018, 187–188, 58–65 CrossRef CAS.
- C. J. Kimble, D. M. Johnson, B. A. Winter, S. V. Whitlock, K. R. Kressin, A. E. Horne, J. C. Robinson, J. M. Bledsoe, S. J. Tye, S.-Y. Chang, F. Agnesi, C. J. Griessenauer, D. Covey, Y.-M. Shon, K. E. Bennet, P. A. Garris and K. H. Lee, Conference proceedings Annual International Conference of the IEEE Engineering in Medicine and Biology Society, Annual Conference, 2009IEEE Engineering in Medicine and Biology Society, 2009, pp. 4856–4859 Search PubMed.
- K. H. Lee, S.-Y. Chang, D.-P. Jang, I. Kim, S. Goerss, J. Van Gompel, P. Min, K. Arora, M. Marsh, S. C. Hwang, C. J. Kimble, P. Garris, C. Blaha and K. E. Bennet, Conference proceedings Annual International Conference of the IEEE Engineering in Medicine and Biology Society, Annual Conference, 2009IEEE Engineering in Medicine and Biology Society, 2011, pp. 677–680 Search PubMed.
- K. H. Lee, J. L. Lujan, J. K. Trevathan, E. K. Ross, J. J. Bartoletta, H. O. Park, S. B. Paek, E. N. Nicolai, J. H. Lee, H.-K. Min, C. J. Kimble, C. D. Blaha and K. E. Bennet, Sci. Rep., 2017, 7, 46675 CrossRef PubMed.
- K. L. Parent, D. F. Hill, L. M. Crown, J.-P. Wiegand, K. F. Gies, M. A. Miller, C. W. Atcherley, M. L. Heien and S. L. Cowen, Anal. Chem., 2017, 89, 2790–2799 CrossRef CAS PubMed.
- E. Castagnola, N. W. Vahidi, S. Nimbalkar, S. Rudraraju, M. Thielk, E. Zucchini, C. Cea, S. Carli, T. Q. Gentner, D. Ricci, L. Fadiga and S. Kassegne, MRS Adv., 2018, 3, 1629–1634 CrossRef CAS PubMed.
- C. N. Hobbs, J. A. Johnson, M. D. Verber and R. M. Wightman, Analyst, 2017, 142, 2912–2920 RSC.
- J. Dragas, V. Viswam, A. Shadmani, Y. Chen, R. Bounik, A. Stettler, M. Radivojevic, S. Geissler, M. E. J. Obien and J. Müller, IEEE J. Solid-State Circuits, 2017, 52, 1576–1590 Search PubMed.
- L. F. Mohammad-Zadeh, L. Moses and S. M. Gwaltney-Brant, J. Vet. Pharmacol. Ther., 2008, 31, 187–199 CrossRef CAS PubMed.
- M. Berger, J. A. Gray and B. L. Roth, Annu. Rev. Med., 2009, 60, 355–366 CrossRef CAS PubMed.
- K. N. Huggins, T. A. Mathews, J. L. Locke, K. T. Szeliga, D. P. Friedman, A. J. Bennett and S. R. Jones, Alcohol, 2012, 46, 371–376 CrossRef CAS PubMed.
- C. E. John and S. R. Jones, in Electrochemical Methods for Neuroscience,CRC Press/Taylor & Francis, 2007 Search PubMed.
- B. P. Jackson, S. M. Dietz and R. M. Wightman, Anal. Chem., 1995, 67, 1115–1120 CrossRef CAS PubMed.
- J. A. Stamford, Z. L. Kruk, J. Millar and R. M. Wightman, Neurosci. Lett., 1984, 51, 133–138 CrossRef CAS PubMed.
- O. Gonzalez, J. T. Berry, L. R. Mcknight-Eily, T. Strine, K. W. Edwards and J. B. Croft, Current Depression Among Adults – United States, 2006 and 2008, Center for Disease Control and Prevention, Hyattsville, MD, 2010 Search PubMed.
- K. M. Wood, A. Zeqja, H. F. Nijhout, M. C. Reed, J. Best and P. Hashemi, J. Neurochem., 2014, 130, 351–359 CrossRef CAS PubMed.
- A. West, J. Best, A. Abdalla, F. Nijhout, M. Reed and P. Hashemi, Neurochem. Int., 2018, 123, 50–58 CrossRef PubMed.
- A. Abdalla, C. W. Atcherley, P. Pathirathna, S. Samaranayake, B. Qiang, E. Peña, S. L. Morgan, M. L. Heien and P. Hashemi, Anal. Chem., 2017, 89, 9703–9711 CrossRef CAS PubMed.
- I. M. Anderson and B. M. Tomenson, J. Psychopharmacol., 1994, 8, 238–249 CrossRef CAS PubMed.
- K. M. Wood and P. Hashemi, ACS Chem. Neurosci., 2013, 4, 715–720 CrossRef CAS PubMed.
- E. C. Dankoski, S. Carroll and R. M. Wightman, J. Neurochem., 2016, 136, 1131–1141 CrossRef CAS PubMed.
- D. Sames, M. Dunn, R. J. Karpowicz Jr and D. Sulzer, ACS Chem. Neurosci., 2013, 4, 648–651 CrossRef CAS PubMed.
- R. E. Brown, D. R. Stevens and H. L. Haas, Prog. Neurobiol., 2001, 63, 637–672 CrossRef CAS PubMed.
- H. L. Haas, O. A. Sergeeva and O. Selbach, Physiol. Rev., 2008, 88, 1183–1241 CrossRef CAS PubMed.
- K. Pihel, S. Hsieh, J. W. Jorgenson and R. M. Wightman, Anal. Chem., 1995, 67, 4514–4521 CrossRef CAS PubMed.
- S. Threlfell, S. J. Cragg, I. Kalló, G. F. Turi, C. W. Coen and S. A. Greenfield, J. Neurosci., 2004, 24, 8704–8710 CrossRef CAS PubMed.
- S. Threlfell, R. Exley, S. J. Cragg and S. A. Greenfield, J. Neurochem., 2008, 107, 745–755 CrossRef CAS PubMed.
- S. Samaranayake, A. Abdalla, R. Robke, H. F. Nijhout, M. C. Reed, J. Best and P. Hashemi, J. Neurochem., 2016, 138, 374–383 CrossRef CAS PubMed.
- R. J. Moran, K. T. Kishida, T. Lohrenz, I. Saez, A. W. Laxton, M. R. Witcher, S. B. Tatter, T. L. Ellis, P. E. M. Phillips and P. Dayan, Neuropsychopharmacology, 2018, 43, 1425 CrossRef CAS PubMed.
- H. Xu, L. Wang, J. Luo, Y. Song, J. Liu, S. Zhang and X. Cai, Sensors, 2015, 15, 1008–1021 CrossRef CAS PubMed.
- M. Z. H. Khan, X. Liu, Y. Tang, J. Zhu, W. Hu and X. Liu, Microchim. Acta, 2018, 185, 439 CrossRef PubMed.
- R. Robke, P. Hashemi and E. Ramsson, HardwareX, 2018, e00051, DOI:10.1016/j.ohx.2018.e00051.
- H. L. Rowley, K. F. Martin and C. A. Marsden, Neuroscience, 1995, 68, 415–422 CrossRef CAS PubMed.
- N. J. Reinhoud, H.-J. Brouwer, L. M. van Heerwaarden and G. A. H. Korte-Bouws, ACS Chem. Neurosci., 2013, 4, 888–894 CrossRef CAS PubMed.
- N. T. Iwai, M. Kramaric, D. Crabbe, Y. Wei, R. Chen and M. Shen, Anal. Chem., 2018, 90, 3067–3072 CrossRef CAS PubMed.
- I. Hossain, C. Tan, P. T. Doughty, G. Dutta, T. A. Murray, S. Siddiqui, L. Iasemidis and P. U. Arumugam, Front. Neurosci., 2018, 12, 500 CrossRef PubMed.
- A. C. Schmidt, L. E. Dunaway, J. G. Roberts, G. S. McCarty and L. A. Sombers, Anal. Chem., 2014, 86, 7806–7812 CrossRef CAS PubMed.
- P. Pyakurel, E. Privman Champaloux and B. J. Venton, ACS Chem. Neurosci., 2016, 7, 1112–1119 CrossRef CAS PubMed.
- M. D. Nguyen and B. J. Venton, Comput. Struct. Biotechnol. J., 2015, 13, 47–54 CrossRef CAS PubMed.
- M. D. Nguyen, A. E. Ross, M. Ryals, S. T. Lee and B. J. Venton, Pharmacol. Res. Perspect., 2015, 3, e00189 CrossRef PubMed.
- S. Balfanz, T. Strünker, S. Frings and A. Baumann, J. Neurochem., 2005, 94, 1168 CrossRef CAS.
- M. Ganesana and B. J. Venton, PLoS One, 2018, 13, e0196932 CrossRef PubMed.
- K. E. Bennet, J. R. Tomshine, H.-K. Min, F. S. Manciu, M. P. Marsh, S. B. Paek, M. L. Settell, E. N. Nicolai, C. D. Blaha, A. Z. Kouzani, S.-Y. Chang and K. H. Lee, Front. Hum. Neurosci., 2016, 10, 102 CrossRef PubMed.
- L. Naji, A. Carrillo-Vico, J. M. Guerrero and J. R. Calvo, Life Sci., 2004, 74, 2227–2236 CrossRef CAS PubMed.
- R. J. Reiter, Experientia, 1993, 49, 654–664 CrossRef CAS PubMed.
- A. L. Hensley, A. R. Colley and A. E. Ross, Anal. Chem., 2018, 90, 8642–8650 CrossRef CAS PubMed.
- M. T. Cryan and A. E. Ross, Analyst, 2019, 144, 249–257 RSC.
| This journal is © The Royal Society of Chemistry 2019 |