 Open Access Article
Creative Commons Attribution 3.0 Unported Licence
A synchrotron-based infrared microspectroscopy study on the cellular response induced by gold nanoparticles combined with X-ray irradiations on F98 and U87-MG glioma cell lines
I.
Martínez-Rovira
 *a,
O.
Seksek
 bc and
I.
Yousef
 a
a
aMIRAS Beamline BL01, ALBA-CELLS Synchrotron, Carrer de la Llum 2–26, 08290 Cerdanyola del Vallès, Spain. E-mail: immamartinez@gmail.com
bLaboratoire d'Imagerie et Modélisation en Neurobiologie et Cancérologie (IMNC), Centre National de la Recherche Scientifique (CNRS); Université Paris Sud, Université Paris-Saclay, Campus Universitaire, Bât. 440, 15 rue Georges Clemenceau, F-91400 Orsay, France
cUniversité de Paris, IMNC, F-91400 Orsay, France
First published on 16th September 2019
Abstract
The inclusion of nanoparticles (NP) in radiotherapy has been shown to increase the damaging effect on tumor cells. However, the mechanisms of action of NP combined with radiotherapy, and the influence of NP parameters and cell type on their radiosensitization capability at molecular and cellular levels still remain unclear. Gold NP (AuNP) have become particularly popular due to their multiple advantages. Within this context, our research work aimed to study the biochemical radiosensitization capacity of F98 and U87-MG glioma cell lines to 1.9 nm AuNP combined with X-ray irradiation. For this purpose, synchrotron-based infrared microspectroscopy (SR-FTIRM) was used as a powerful tool for biochemical composition and treatment response assessment of cells at a single-cell level. SR-FTIRM data, supported by multivariate analysis, revealed clear AuNP-induced changes in the DNA, protein and lipid spectral regions. The AuNP-related biochemical alterations appear prior to the irradiation, which gave us a first indication on the AuNP radiosensitization action. Biochemical modifications induced by the AuNP in the presence of radiotherapy irradiations include enhanced conformational changes in the protein secondary structures, variations in the intensity and position in the phosphodiester bands, and changes in the CH2 and CH3 stretching modes. These changes are better manifested at 24 hours post-irradiation time. SR-FTIRM results showed a clear heterogeneity in the biochemical cell response, probably due to the distinct cell–NP interactions and thus, to different DNA damage and cell death processes.
1. Introduction
The radiosensitization potential of nanoparticles (NP) has been previously reported in many biological studies (in vitro and in vivo) in the past years (see, for instance ref. 1–5). Typical radiosensitizers include metallic high-atomic number (Z) materials that can augment the effectiveness of radiotherapy by inducing dose enhancement effects specifically in the tumor site. This leads to an increase in the therapeutic index. The use of NP over the conventional contrast agents resulted in a larger NP accumulation in the tumor due to the enhanced permeability and retention (EPR) effects.6 In addition, previous studies reported that toxicity is highly reduced when using very small NP (<5 nm).7Among all types of NP, gold (Z = 79) nanoparticles (AuNP) are particularly attractive since they are inert, highly biocompatible, relatively easy to synthesize and functionalise, and they have an increased cross section for photoelectric photon absorption (specially for low X-ray energies).1,4,5,8,9 The latter enhances the secondary electron production (short-range photoelectrons and Auger electrons) and the local dose deposition near the NP.10 At the same time, these electrons can further increase the generation of reactive oxygen species (ROS) and electron emission from nearby NP. Besides the pure physical effects, the presence of NP itself can also increase the ROS production, and thus, the cellular damage.4,11
However, the radiosensitization mechanisms at molecular and cellular levels still remain unclear. Results from the previous biological studies indicated that radiosensitization effects might be driven by biological mechanisms induced by the NP rather than by physical (dose enhancement) effects. These mechanisms include oxidative stress, DNA damage induction, cell cycle effects and potential interference with cell communication.12–16 This, along with the influence of many other parameters like NP size, shape and coating, which at the same time influence the NP distribution inside the cells, as well as the distinct cellular responses, largely complicates research on radiosensitization effects of NP.4
Fourier transform infrared microspectroscopy (FTIRM) can shed some light on the mechanisms involved in the radiosensitization effects of NP. FTIRM is a non-destructive vibrational technique for the analysis of biological samples.17 IR active molecular bonds of the main cell biomolecules change the dipole moment as a result of the vibration that occurs when infrared light is absorbed. The mid infrared spectral region is the most important for studying biological specimens since it includes the so-called ‘fingerprint region’ and the ‘lipids region’, which provides nucleic acid, protein, lipid, carbohydrate composition and/or conformational changes. This information enables the assessment of cell functionality, cell division, differentiation, growth and metabolism.17–21
Within this context, the objective of this study is to use synchrotron-based FTIRM (SR-FTIRM) to disentangle radiosensitization effects of gold NP (1.9 nm AuroVist™)22 in glioma cells. Despite the current treatment options, high grade glioma has poor prognosis in humans and thus, patient outcome could benefit from the enhanced therapeutic index of combined RT-NP modalities. Gaining new insights into the radiosensitization effects of AuNP in glioma cells is essential to progress on the development of NP-based therapeutics. In this work, we present SR-FTIRM data on F98 and U87-MG glioma cell lines to assess distinct cellular responses as a function of the cell type. The highly brilliant infrared source used in SR-FTIRM provided high spatial resolution and high quality information required for the single-cell analysis of our work. To the best of our knowledge, this is the first study that evaluates cell radiosensitization to AuNP by using SR-FTIRM.
2. Materials and methods
2.1. Cell culture: F98 and U87-MG
The response of the two glioma cell lines, F98 (rat, ATCC® CRL-2397) and U87-MG (human, ATCC® HTB-14), was studied. The F98 glioma rat cell line simulates the behavior of glioblastoma tumors due to its highly invasive pattern of growth within the brain and low immunogenicity; it is commonly used to evaluate the effectiveness of several therapeutic agents.23 The U87-MG human tumor model presents a non-diffusely infiltrative growth pattern and it is one of the most widely used cell lines, especially for anti-angiogenic therapy studies.24Both cell lines were purchased from LGC Standards (Molsheim, France). They were maintained and passaged in a high glucose (4.5 g L−1) Gibco™ DMEM medium (Life Technologies SAS, Courtaboeuf, France) supplemented with 1 mM GlutaMAX™, 1 mM sodium pyruvate, 10% fetal calf serum and 1% penicillin-streptomycin (10![[thin space (1/6-em)]](https://www.rsc.org/images/entities/char_2009.gif) 000 U each), at 37 °C and 5% CO2. On the day prior to the treatments, 105 cells per well were seeded in 6-well plates and incubated overnight.
000 U each), at 37 °C and 5% CO2. On the day prior to the treatments, 105 cells per well were seeded in 6-well plates and incubated overnight.
2.2. Gold nanoparticles
Gold NP (1.9 nm AuroVist™) were purchased from Nanoprobes (Yaphank, NY, USA). The potential of these NP has been proved in previous biological studies.1,4,25,26A stock solution was extemporaneously prepared by mixing the AuNP (40 mg of gold) with 1 mL ultrapure water (Millipore Direct Q8). After rapid dissolution, the solution was filtered through a 0.2 μm centrifugal filter at 15![[thin space (1/6-em)]](https://www.rsc.org/images/entities/char_2009.gif) 000g for 8 minutes and kept at 4 °C. For cell treatment, the AuNP solution was diluted in fresh supplemented cell medium at a final concentration of 12 μM (500 μg mL−1).25 The cells were then incubated at 37 °C and 5% CO2 for 24 hours.25 Before the irradiation protocol, the AuNP-containing medium was discarded and replaced by 3 mL of fresh medium.
000g for 8 minutes and kept at 4 °C. For cell treatment, the AuNP solution was diluted in fresh supplemented cell medium at a final concentration of 12 μM (500 μg mL−1).25 The cells were then incubated at 37 °C and 5% CO2 for 24 hours.25 Before the irradiation protocol, the AuNP-containing medium was discarded and replaced by 3 mL of fresh medium.
2.3. X-ray irradiation
Kilovoltage irradiations were performed at the Curie Institute (Orsay, France) with an X-ray unit (XRAD 320, Cegelec). The mean energy of this X-ray generator is 90 keV and the dose rate is 1.1 Gy min−1. Each well plate was irradiated separately at 5, 10 and 20 Gy, respectively, for both cell lines, with and without AuNP. Two non-irradiated wells (0 Gy, without and with AuNP) were kept for controls. Just after irradiation, the medium was replaced by fresh medium.2.4. SR-FTIRM sample preparation
For SR-FTIRM measurements, samples had to undergo a specific preparation protocol, i.e. cell fixation and deposition on infrared transparent calcium fluoride (CaF2) cover glasses.21,27 The cells were fixed at two post-irradiation times: after the irradiation (T0h) to evaluate immediate treatment-induced effects, and after 24 hours (T24h) to assess the cellular response from the treatment.For both fixation times (T0h and T24h), the medium was removed and kept in order to collect floating cells. Then, 100 μL of 0.05% trypsin–EDTA solution was added into each well and incubated for 5 min. After cell detachment, the medium with floating cells was added back to the trypsinized cells, and 500 μL of fresh supplemented medium was added. The cell suspension was then centrifuged at 1500 rpm for 5 min at 4 °C. The cellular pellet was rinsed with PBS, and resuspended in 10% formalin neutral buffered solution (Sigma-Aldrich). After 1 hour at room temperature, the samples were centrifuged at 1500 rpm for 5 min and the pellet was washed 3 times in Millipore water. The final cell suspensions in water were kept at 4 °C until cytospinned down onto 0.5 mm thick infrared transparent CaF2 slides using a Cytospin 4 centrifuge (ThermoFisher; 700 rpm for 5 min). Dried cells were then analyzed by SR-FTIRM.
2.5. SR-FTIRM at ALBA Synchrotron
SR-FTIRM experiments were performed at the infrared beamline MIRAS of the ALBA-CELLS synchrotron light source using the Hyperion 3000 microscope coupled to a Vertex 70 spectrometer (Bruker Optik GmbH, Germany). The measurements were performed in the transmission mode of operation of the FTIR microscope. This microscope is operating with a 36× Schwarzschild magnification objective (NA = 0.65) coupled to a 36× magnification condenser. The microscope is furnished with a liquid nitrogen cooled 50 μm mercury cadmium telluride (MCT) detector. Around 70–100 cells were randomly collected from each sample condition. Single point maps of individual cells were collected in the 3800–900 cm−1 mid infrared range at 4 cm−1 spectral resolution with 256 co-added scans per spectrum. All spectra were obtained using a single masking aperture size of 8 μm × 8 μm. Reference or background spectra were collected under the same acquisition parameters of the sample. In particular, measurement in an empty region on the CaF2 slides (without cells) was repeated every 10 cell measurements, in order to take into account the differences under the ambient conditions along the measurements. The final cell absorbance spectrum was obtained by subtracting the reference spectrum from the raw cell spectra. The subtraction was done directly (automatically) using OPUS 7.5 software (Bruker Optik GmbH, Germany).2.6. SR-FTIRM data analysis
Differences in the spectral features were evaluated by Principal Component Analysis (PCA) using Unscrambler X (CAMO Software AS, Norway). PCA was performed on vector normalized second derivative spectra (Savitzky–Golay algorithm; 3rd polynomial order). Vector normalization and PCA were separately applied in the 3100–2800 and 1800–1000 cm−1 spectral regions.Raw spectra were corrected following the rubber band method (32 baseline points) using OPUS 7.5 (Bruker Optik GmbH, Germany) in order to assess the area under several spectral bands reported hereafter and represented in Fig. 1.
• Methyl asymmetric stretching: 2980–2945 cm−1 (CH3).
• Methylene asymmetric stretching: 2945–2900 cm−1 (CH2).
• Amide I: 1710–1598 cm−1 (AI).
• Amide II: 1590–1483 cm−1 (AII).
• Phosphate I: 1270–1186 cm−1 (PhI).
• Phosphate II: 1146–1004 cm−1 (PhII).
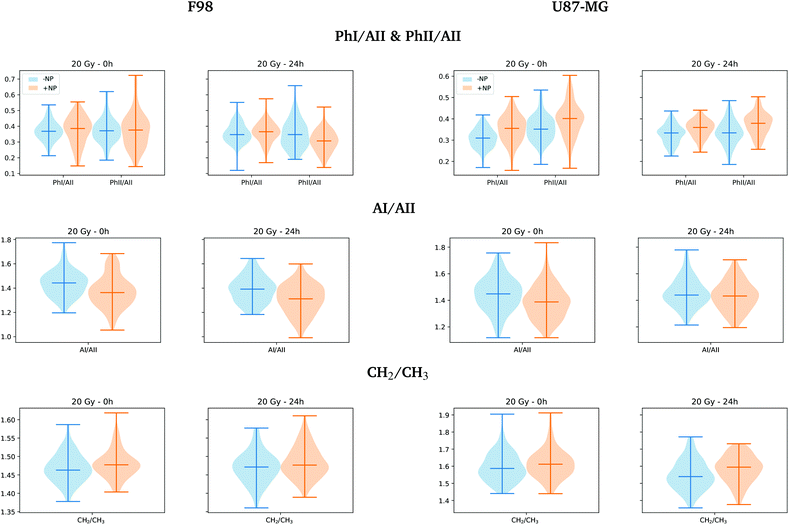
The total area under the spectra (except the 2800–1800 cm−1 region) was associated with the total cell biomass (Cell) following previous studies.28,29 Violin plots showing the probability density of the data for PhI/AII, PhII/AII, AI/AII and CH2/CH3 ratios were generated, since these ratios have been reported to provide valuable information on cell response after treatments.28,30,31
2.7. Microphotography
F98 and U87-MG cells were seeded in a 35 mm polystyrene Petri dishes using the same NP concentration and NP incubation time as for SR-FTIRM measurements. After treatment, the cells were washed in fresh medium and microscopy image acquisition was performed using a 10× Nikon water-immersion DIC objective placed on an Eclipse 80i Nikon microscope (Scop Pro, Marolles-en-Hurepoix, France), which is equipped with a Zyla 5.5 MPX Andor SCMOS cooled camera (Scop Pro, France) and MetaMorph acquisition software (Molecular Devices, Sunnyvale, CA).2.8. Cell viability assay
Metabolic activity was evaluated using the resazurin–resorufin cytotoxicity assay.32,33 Briefly, after irradiation treatment, the cells were harvested in each well of the 6-well plate by using the usual trypsin-EDTA procedure. The cells were counted and 100 μL of 105 cells per mL were seeded in 96-well microplates and incubated for 24 hours at 37 °C. After 24 hours, the medium was discarded and replaced by fresh medium containing 30 μg mL−1 of resazurin (from a filtered 1.2 mg mL−1 stock solution in PBS). The cells were incubated for 3 hours at 37 °C, and the fluorescence intensity measurement of each well was performed using a Fluoroskan Ascent FL microplate reader (Thermo Fisher Scientific, Illkirch, France) at 530 and 590 nm for excitation and emission, respectively. The percentage of the metabolic activity of the cell populations was evaluated as the ratio of the fluorescence intensity after treatment to the control fluorescence intensity.3. Results and discussion
Microphotography images for the qualitative assessment of intracellular NP localization are shown in section 3.1. Then, the results of SR-FTIRM analysis and cell viability assays are presented for both cell lines (F98 and U87-MG) and several irradiation doses (from 0 to 20 Gy) in the presence (+NP) and absence (−NP) of AuNP and two post-irradiation fixation times (T0h and T24h). SR-FTIRM details on the biochemical effects induced by the AuNP without (0 Gy) and with radiation are presented in sections 3.2 and 3.3, respectively. The results of cell viability assays are reported in section 3.4.3.1. Microphotography for intracellular NP localization assessment
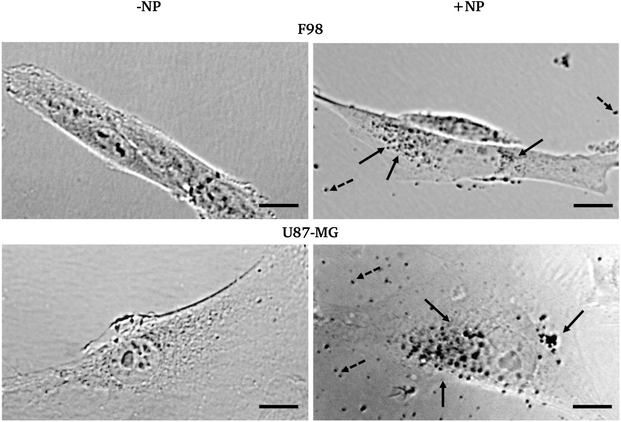
Fig. 2 shows the bright field micrographs of F98 and U87-MG cells, respectively, with and without AuNP. While both cell lines show different morphologies (F98 is elongated and U87-MG is flatter and more spread on the cell support), nuclei can be easily distinguished as well as cell boundaries. After AuNP treatment and washing with fresh medium, free NP or NP aggregates can still be clearly seen in the cell surroundings (black dots). An unambiguous punctuated pattern inside the cell cytoplasm can also reproducibly be shown, especially in perinuclear areas. This strongly suggests an internalization process.Whether this process is active (endocytosis) or passive (permeation) could not be addressed by this microscopy experiment. However, it has been shown elsewhere and on different cell types that the majority of 1.9 nm particles are endocytosed.25 While on F98 cells, the size of the dots was quite the same inside and outside of the cells, on U87-MG cells, the size of the black dots seems to indicate that the AuNP are aggregated. This might occur due to the intrinsic differences between the endocytosis processes in both cell lines.
3.2. Biochemical effects induced by the AuNP without irradiation (0 Gy)
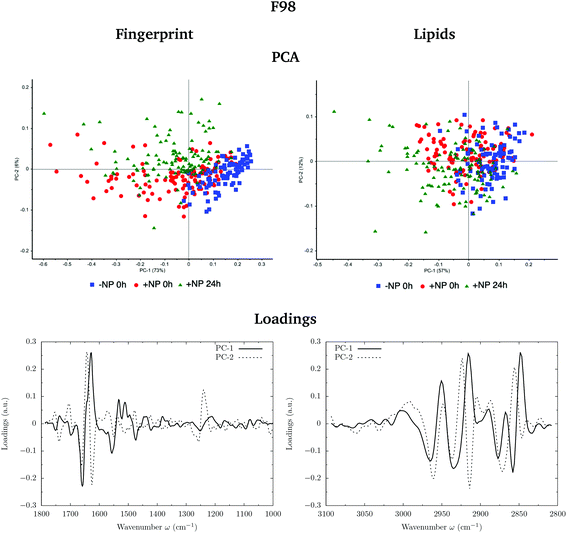
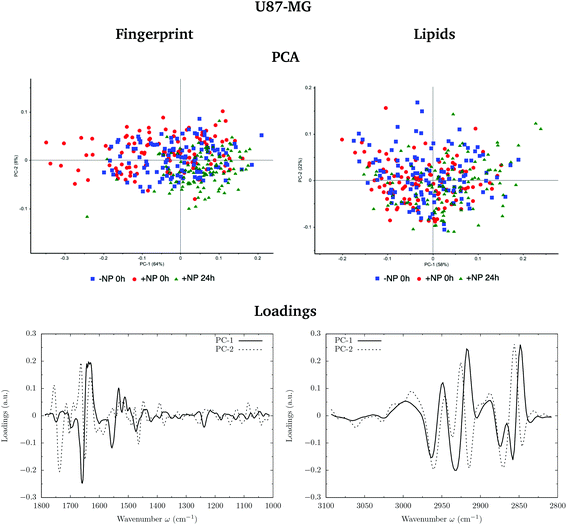
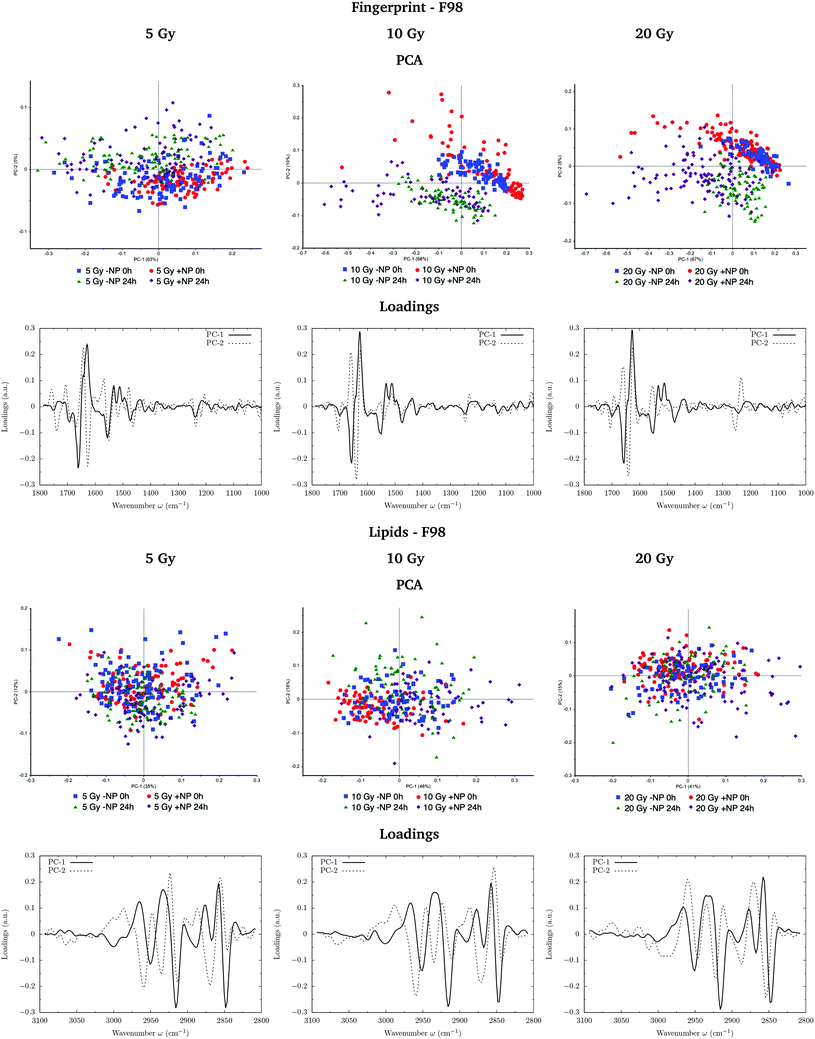
Fig. 3 and 4 show the PCA scores and the corresponding loading plots on second derivative spectra for both F98 and U87-MG cell lines, respectively. PCA allows the reduction of the dimensionality of features in order to assess the similarities and differences between spectra. In the PCA score plot, each single point represents a cell spectrum. Loading plots express the influence of the variables that are responsible for each principal component as a function of the wavenumber. PCA analysis was performed separately in the fingerprint (1800–1000 cm−1) and lipid (3100–2800 cm−1) regions.For the F98 glioma cell line, and prior to the radiotherapy irradiation (0 Gy), the PC1–PC2 plot in the fingerprint region shows a clear separation between NP-treated groups and the control group (−NP), mostly along PC-1, which explains 73% of the variance. PC-1 shows more variance for the NP-treated groups. Fingerprint modifications are already observed at T0h, which gives us a first indication of the AuNP action. For the U87-MG cell line, there is also some separation along PC-1 in the score plot between the control and NP-treated cells in the fingerprint region mainly at T0h.
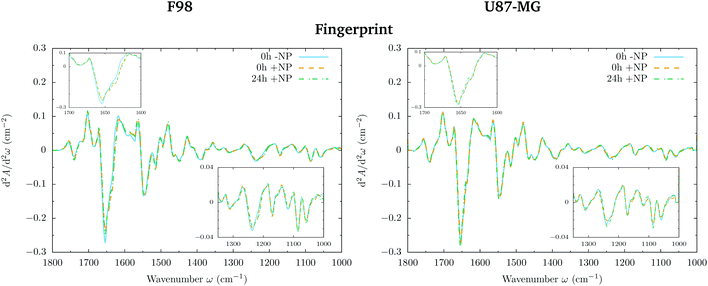
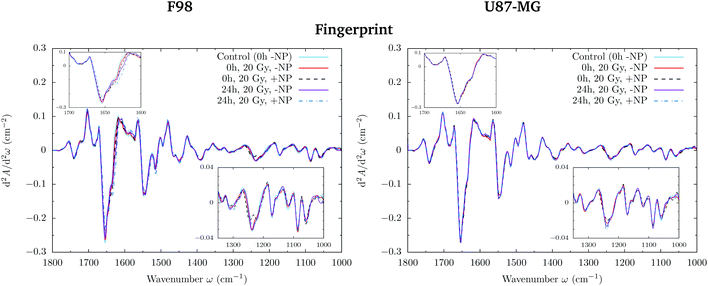
The loading plots in the fingerprint region indicate that the largest biochemical changes induced by the NP are associated with protein modifications in the region of 1700–1500 cm−1 for both F98 and U87-MG cell lines. The vector normalized Savitzky–Golay second derivative calculated in the averaged absorbance spectra (Fig. 5) shows NP-induced changes in the protein conformational structures in the amide I and amide II bands, especially in the F98 glioma cell line. These bands are characteristic of peptide bonds of cell peptides and proteins. More precisely, there is a more explicit β-type secondary structure inside the NP-treated cells,34–36 which could be related to an initial apoptotic response of the cells, since previous studies have reported changes in the expression of pre-apoptotic proteins using the same type of NP.25
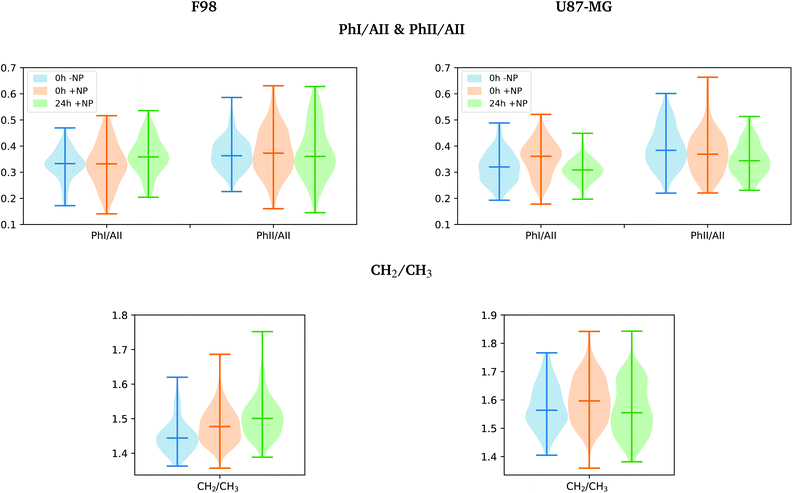
The separation of the NP-treated group at T24h along PC-2 also has some contribution of the asymmetric phosphodiester band of the DNA (1238 cm−1), particularly in the case of the F98 cell line. We observe a shift towards the low frequency region for NP-treated cells (see Fig. 5). This shift has been observed in our previous work using gadolinium NP.21,27 We also observe changes in the distribution of the relative intensities of several DNA spectral bands (PhI/AII, PhII/AII), as shown in Fig. 6 (top). At T24h, there is a slight decrease in the PhII/AII ratio in the case of U87-MG cells, which might be correlated to cell cycle changes and, particularly, to an increase in the sub G1 cell population induced by these AuNP.25 Previous studies have reported similar changes in the DNA region of the infrared spectra due to cell cycle modifications.36,37 Finally, it is important to note that we clearly observe an increase in the variance of the DNA biochemical content in NP-treated cells with respect to controls (−NP) both at T0h and T24h and for both cell lines, as a result of different NP–cell interaction mechanisms.
In the region of 3000–2800 cm−1, mostly representative of fatty acids encountered in the membranes, there is a separation between the scores of control cells and NP-treated cells in F98 glioma line (Fig. 3). NP-treated cells are correlated with peaks at 2848 cm−1 and 2915 cm−1, while control cells are correlated with peaks at 2935 cm−1 and 2858 cm−1. This corresponds to changes in the asymmetric and symmetric vibrations of CH2 stretching groups.38 Changes in these peaks were previously related to the changes in the lipid structure and chain length due to oxidative stress and membrane peroxidation.38–41 The separation in the PCA scores between −NP and +NP groups is less clear in the case of U87-MG cells (Fig. 4).
The violin plots in Fig. 6 (bottom) show a clear increase in the CH2/CH3 ratio distribution for F98 cells (both at T0h and T24h), which might indicate evidences of oxidative stress.39,40 There are also indications of oxidative stress in the U87-MG cells after NP-treatment (T0h), which seems to be reduced at T24h. The induction of AuNP-related oxidative stress has been previously reported using the same type of NP via increased production of endogenous reactive oxygen species and depletion of intracellular antioxidants.25,42
Our findings evidence a different biochemical response depending on the tumor cell model, which could be related to a different radiosensitization capability according to NP localization, NP-cell interaction processes or degree of sensitivity to oxidative damage or others.5,25,26 This could explain the differences in NP internalization relative to the cell type shown in the microscopy pictures (see Fig. 2) and might be related to the subsequent variations in the biochemical effects observed by SR-FTIRM.
3.3. SR-FTIRM study on the radiosensitization effects at several radiation doses
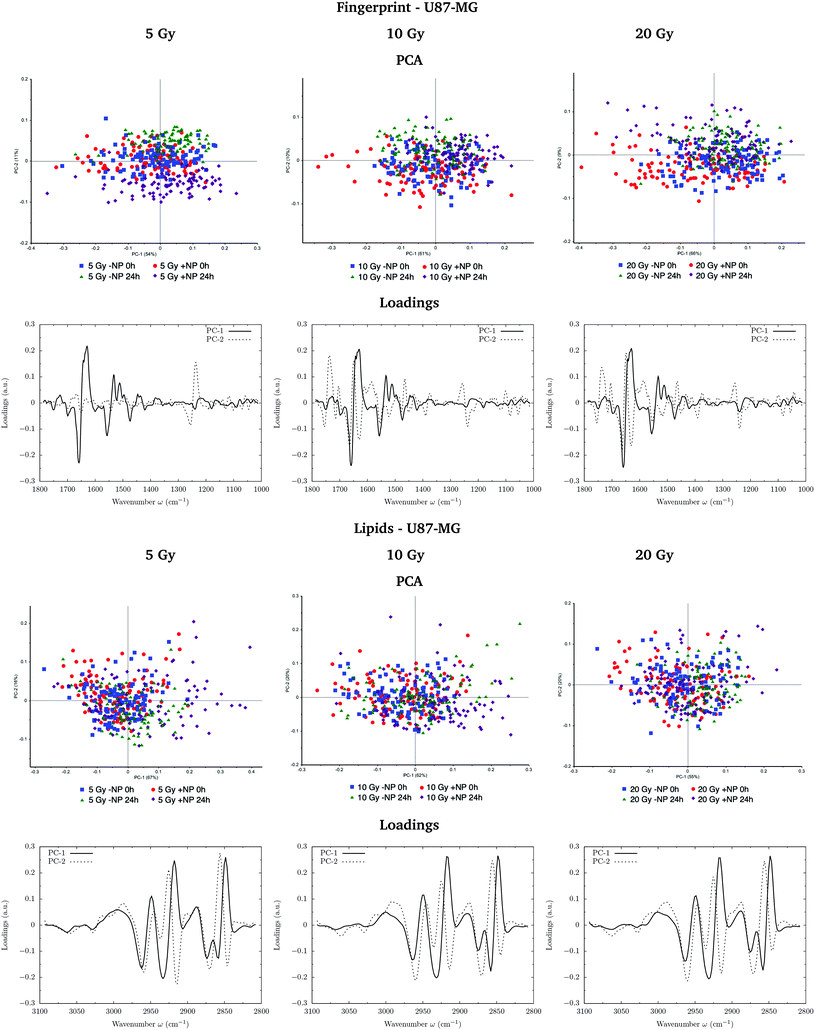
Fig. 7 and 8 show the PCA scores and the corresponding loading plots on second derivative spectra for both F98 and U87-MG cell lines, respectively, and several configurations: doses (from 5 to 20 Gy), with/without NP (−NP/+NP) and post-irradiation times (T0h/T24h). PCA scores were separated as a function of the dose to assess the effect of AuNP for the same irradiation conditions. The two fixation times are compared in the same PCA scores to assess cell response to the treatments as a function of time.In F98 glioma cells, the protein region of the fingerprint spectral range (1700–1500 cm−1) is the main factor responsible for PCA score separation. PC1–PC2 score plots display clearly separated clusters (−NP/NP and T0h/T24h), particularly for 10 Gy and 20 Gy and in the case of T24h. PC-1 and PC-2 take into account around 70% and 10% of the variance, respectively, for all doses. The loading plots show that wavenumbers around 1628 cm−1 are highly correlated to NP-treated groups, while wavenumbers around 1660−1 are correlated to irradiated groups without AuNP. This correlation is better manifested at T24h. While the first is attributed to the β-sheet conformation of the amide I band, the second one is assigned to the α-helix form.34 This indicates a shift towards lower wavenumbers in the amide for irradiated cells in the presence of AuNP, as can be seen in Fig. 9 (left). Previous studies correlated this shift to an increase in disordered structures due to protein denaturation.43 In our case, the secondary protein structure changes inside the cells correlated with protein unfolding and/or denaturation might be related to cell death under treatment-induced stress.36,44 This stress could be enhanced by the increased generation of ROS due to the presence of AuNP, which has been associated with changes in the amide I and II bands.44–46 An amplification in the apoptotic response of irradiated cells in the presence of AuNP is in accordance with our previous FTIRM study using gadolinium NP.21,27 The protein modifications as a function of the treatment are clearly shown on the vector normalized Savitzky–Golay second derivative plot (Fig. 9, left).
In the case of U87-MG cells, the effect is less clear since the PC1–PC2 scores in the fingerprint region show more overlapping between ‘−NP’ and ‘+NP’ groups. For 20 Gy, we observe a slight separation of the NP-treated group for both fixation times. Loading plots mainly correlate this separation with secondary protein structure changes and modifications in the asymmetric phosphodiester bands. These changes, amplified in the presence of NP, are probably related to an enhanced cell death response due to the combination of radiation damage and AuNP-induced biochemical modifications. However, we observed a reduced biochemical response to AuNP with respect to F98 cells in the presence of radiation, since secondary structure protein changes are less clear in the Savitzky–Golay second derivative plot (Fig. 9, right).
Fig. 10 shows the distribution of the relative intensities of several spectral band ratios (PhI/AII, PhII/AII, AI/AII and CH2/CH3) defined in section 2.6. For the F98 cell line, we observe a decrease in the absorbance of the AI/AII ratio in NP-treated cells. Changes in the amide I and amide II absorbance were previously related to DNA repair processes, which involves many enzymes to repair the damage produced by the ionizing radiation.47,48 The changes in relative intensity between the areas in amide I and amide II bands have also been correlated with the biochemical changes of cellular proteins following apoptosis, which affects the overall protein folding and localization and thus, the infrared absorption of peptide bonds.30,31
By looking into the DNA region (1350–1000 cm−1) in the vector normalized Savitzky–Golay second derivative plot (Fig. 9), which is assigned to phosphodiester groups mostly found in nucleic acids, we observe several changes in the intensity and position (shifts) of several peaks. This probably implies a number of different variations in DNA organization or local conformation as a result of radiation damage, which is amplified in the presence of AuNP. The investigation of the loadings shows a slight variance emerging from the asymmetric phosphodiester band of the DNA at 1238 cm−1 for NP-treated groups at T24h. The differential biochemical response to AuNP in the DNA region is more visible in the case of F98 than in the case of U87-MG cells.
For F98 glioma cells, the violin plots of Fig. 10 show a slight reduction in the PhII/AII ratio for NP-treated cells at T24h, which has been previously correlated with chromatin fragmentation and apoptotic DNA condensation in previous studies.28,30,49 Previous studies have reported similar variations as a result of radiation damage.31,44,47,49 Instead, U87-MG cells exhibit a clear increase in the PhI/AII and PhII/AII ratios at T24h in NP-treated cells. An increase in the phosphodiester bands was already observed in the work of Lipiec and collaborators for PC-3 (human prostate adenocarcinoma) cells following proton irradiation.47 The increase in the intensity of the DNA backbone was correlated with multiple DNA breakages.47,50
When comparing NP-treated cells in the lipid region (3100–2800 cm−1), the score plots do not display clear separated clusters, despite the fact that the NP-treated groups at T24h seem to be slightly separated towards positive PC-1 in both cell lines from the other groups (T0h and T24h without AuNP). Fig. 10 shows some increase in CH2/CH3 ratio distribution (defined in section 2.6) at T24h, which is more marked for U87-MG cells. The higher absorbance in the CH2 asymmetric stretching mode with respect to the CH3 asymmetric stretching has been reported with cell death processes in previous studies.28 Indeed, a higher CH2/CH3 ratio has been determined for apoptotic cells by proton nuclear magnetic resonance spectroscopy in previous studies.51–53
Finally, it is important to remark that we observe a higher intra-cellular variation in treated cells, demonstrating the heterogeneity in the biochemical cell response among the same cell population and also among cell lines. This is probably due to different NP–cell interaction processes, and degree of sensitivity to oxidative/radiation damage or others. The radiosensitization potential dependence as a function of the cell type has also been reported in previous studies using the same type of NP.5,25,26,54 The distinct cellular responses of different cell lines are a key point for the study of radiosensitization effects of NP. Within this context, SR-FTIRM can provide new insights into the molecular and cellular levels for understanding the complex radiosensitization processes involving nanoparticles and radiotherapy, as shown in this work.
3.4. Cell viability assay
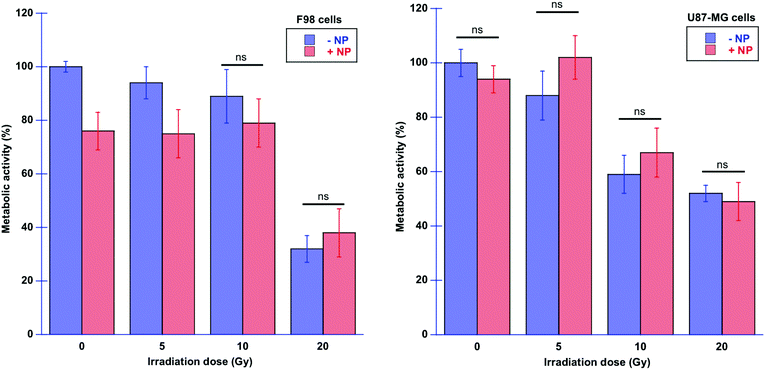
Fig. 11 shows the results of the resazurin–resorufin proliferation assay performed on treated cells, with or without AuNP, and with or without X-ray irradiations at 24 hours post-irradiation time, to correlate with respect to the infrared data at T24h.F98 glioma cells seem to be more sensitive to AuNP, already in the absence of radiation. Also, in the presence of radiation, U87-MG cells seem to be less sensitive to AuNP compared to F98 cells since the metabolic activity is not significantly different in the presence of AuNP. In F98 glioma cells, we can observe significant changes for the lowest dose (5 Gy), since the F98 metabolic activity is decreased in the presence of AuNP. It is interesting to note that the macroscopical measurement of the metabolic activity through the proliferation assay does not allow the differentiation of the effect of AuNP on both cell lines in all configurations, whereas SR-FTIRM shows more detailed events occurring at the molecular level. In this study, the choice of performing the proliferation test at 24 hours post-irradiation was to be able to correlate with the SR-FTIRM data and early biological events. Larger effects might be expected at larger post-irradiation times, as reported in previous studies using the same type of NP.25
4. Conclusions
Despite significant evidence on the radiosensitization effects of AuNP, the exact mechanisms of radiosensitization are not clear. This work constitutes the first study of the radiosensitization effects of 1.9 nm AuNP in the F98 and U87-MG glioma cell lines by synchrotron-based infrared microspectroscopy at the single-cell scale. SR-FTIRM is a powerful tool for monitoring biochemical changes induced by AuNP combined with radiotherapy for assessing different cell responses to the treatments.Cell–NP interactions differ in both cell lines. Prior to irradiation, AuNP induced spectral variations were observed both in the fingerprint and in the lipid regions. In particular, initial conformational changes in the protein secondary structures (F98, U87-MG), an increase in the CH2/CH3 ratio (F98 cells), and absorbance intensity variations in the phosphodiester vibrations of the DNA (U87-MG) are detected. The biochemical alterations induced by the AuNP on both cell lines give us a first indication on the AuNP action.
PCA analysis reveals clear NP-induced changes when AuNP are combined with radiotherapy. The main spectral variations include a shift toward the low wavenumber in the protein bands (F98), changes in amide I/II relative intensity (F98), and relative amplitude changes in the CH2 and CH3 stretching modes (U87-MG), along with several DNA organization or local conformation modifications (F98, U87-MG) due to the presence of AuNP. These changes are better manifested at T24h and they are probably related to an initial cell death response of the cells, which is amplified in the presence of AuNP. SR-FTIRM results showed the heterogeneity in the biochemical cell response among different cell lines (and among the same cell population), probably due to the different NP–cell interaction processes, degree of sensitivity to oxidative/radiation damage, etc., which implies different radiosensitization capabilities as a function of the cell line.
Despite the fact that SR-FTIRM provides a deeper understanding of the NP-induced molecular and cellular response at a biochemical level, further biological studies are required to assess the role of different (physical and biochemical) radiosensitization mechanisms as a function of NP and cell type. Comprehensive characterization studies of cellular responses to AuNP are required for the further development of this promising technique towards potential clinical translation.
Conflicts of interest
There are no conflicts to declare.Acknowledgements
The authors acknowledge the granted beamtime at ALBA-CELLS Synchrotron. We also thank Dr S. Heinrich, Dr F. Pouzoulet (Institut Curie, France) and Dr F. Gaudin (Institut Paris-Sud d'Innovation Thérapeutique, France) for their technical support.This project has received funding from the European Union Horizon 2020 Framework Programme under the Marie Sklodowska-Curie grant agreement number 748889.
References
- J. F. Hainfeld, D. N. Slatkin and H. M. Smilowitz, Phys. Med. Biol., 2004, 49, 309–315 CrossRef PubMed.
- D. Kwatra, A. Venugopal and S. Anant, Transl. Cancer Res., 2013, 2, 330–342 CAS.
- M. Babaei and M. Ganjalikhani, BioImpacts, 2014, 4, 15–20 CAS.
- K. Haume, S. Rosa, S. Grellet, M. A. Smialek, K. T. Butterworth, A. V. Solovyov, K. M. Prise, J. Golding and N. J. Mason, Cancer Nanotechnol., 2016, 7, 1–20 CrossRef PubMed.
- S. Her, D. A. Jaffray and C. Allen, Adv. Drug Delivery Rev., 2017, 109, 84–101 CrossRef CAS PubMed.
- Y. Matsumura and H. Maeda, Cancer Res., 1986, 46, 6387–6392 CAS.
- S. Akhter, M. Z. Ahmad, F. J. Ahmad, G. Storm and R. J. Kok, Expert Opin. Drug Delivery, 2012, 9, 1225–1243 CrossRef CAS PubMed.
- S. Jain, D. Hirst and J. O'Sullivan, Br. J. Radiol., 2009, 85, 101–113 CrossRef PubMed.
- W. Ngwa, R. Kumar, S. Sridhar, H. Korideck, P. Zygmanski, R. A. Cormack, R. Berbeco and G. M. Makrigiorgos, Nanomedicine, 2014, 9, 1063–1082 CrossRef CAS PubMed.
- I. Martínez-Rovira and Y. Prezado, Med. Phys., 2011, 38, 4430–4439 CrossRef PubMed.
- Y. Pan, A. Leifert, D. Ruau, S. Neuss, J. Bornemann, G. Schmid, W. Brandau, U. Simon and W. Jahnen-Dechent, Small, 2009, 5, 2067–2076 CrossRef CAS PubMed.
- K. Butterworth, S. McMahon, F. Currel and K. Prise, Nanoscale, 2012, 4, 4830–4838 RSC.
- S. Rosa, C. Connolly, G. Schettino, K. T. Butterworth and K. M. Prise, Cancer Nanotechnol., 2017, 8, 1–25 CrossRef PubMed.
- D. Choudhury, P. Xavier, K. Chaudhari, R. John, A. Dasgupta, T. Pradeep and G. Chakrabarti, Nanoscale, 2013, 5, 4476–4489 RSC.
- F. Taupin, M. Flaender, R. Delorme, T. Brochard, J.-F. Mayol, J. Arnaud, P. Perriat, L. Sancey, F. Lux, R. Barth, M. Carriere, J.-L. Ravanat and H. Elleaume, Phys. Med. Biol., 2015, 60, 4449–4464 CrossRef PubMed.
- I. Martínez-Rovira and Y. Prezado, Med. Phys., 2015, 42, 6703 CrossRef PubMed.
- M. J. Baker, J. Trevisan, P. Bassan, R. Bhargava, H. J. Butler, K. M. Dorling, P. R. Fielden, S. W. Fogarty, N. J. Fullwood, K. A. Heys, C. Hughes, P. Lasch, P. L. Martin-Hirsch, B. Obinaju, G. D. Sockalingum, J. Sulé-Suso, R. J. Strong, M. J. Walsh, B. R. Wood, P. Gardner and F. L. Martin, Nat. Protoc., 2014, 9, 1771–1791 CrossRef CAS PubMed.
- M. Diem, P. Griffiths and J. Chalmers, Vibrational spectroscopy for medical diagnosis, John Wiley & Sons, New York, 2008 Search PubMed.
- I. Yousef, J. Breard, N. SidAhmed-Adrar, A. Maamer-Azzabi, C. Marchal, P. Dumas and F. Le Naour, Analyst, 2011, 136, 5162–5168 RSC.
- L. Buriankova, Z. Nadova, D. Jancura, M. Refregiers, I. Yousef, J. Mikes and P. Miskovsky, Laser Phys. Lett., 2010, 7, 613 CrossRef CAS.
- I. Yousef, O. Seksek, Y. Prezado, J. Sulé-Suso and I. Martínez-Rovira, Analyst, 2016, 141, 2238–2249 RSC.
- Nanoprobes, http://www.nanoprobes.com/.
- R. Barth and B. Kaur, J. Neurooncol., 2009, 94, 299–312 CrossRef PubMed.
- V. L. Jacobs, P. A. Valdes, W. F. Hickey and J. A. De Leo, ASN Neuro, 2015, 3, e00063 Search PubMed.
- J. A. Coulter, S. Jain, K. T. Butterworth, L. E. Taggart, G. R. Dickson, S. J. McMahon, W. B. Hyland, M. F. Muir, C. Trainor, A. R. Hounsell, J. M. O'Sullivan, G. Schettino, F. J. Currell, D. G. Hirst and K. M. Prise, Int. J. Nanomed., 2012, 7, 2673–2685 CrossRef CAS PubMed.
- K. T. Butterworth, J. A. Coulter, S. Jain, J. Forker, S. J. McMahon, G. Schettino, K. M. Prise, F. J. Currell and D. G. Hirst, Nanotechnology, 2010, 21, 2673–2685 CrossRef PubMed.
- I. Martínez-Rovira, O. Seksek, J. Puxeu, J. Gómez, M. Kreuzer, T. Ducic, M. J. Ferreres, M. Artigues and I. Yousef, Analyst, 2019, 144, 5511–5520 RSC.
- G. Birarda, D. E. Bedolla, E. Mitri, S. Pacor, G. Grenci and L. Vaccari, Analyst, 2014, 139, 3097 RSC.
- A. Kretlow, Q. Wang, M. Beekes, D. Naumann and L. M. Miller, Biochim. Biophys. Acta, Mol. Basis Dis., 2008, 1782, 559–565 CrossRef CAS PubMed.
- F. Gasparri and M. Muzio, Biochem. J., 2003, 369, 239–248 CrossRef CAS PubMed.
- N. Gault and J. Lefaix, Radiat. Res., 2003, 160, 238–250 CrossRef CAS PubMed.
- Mammalian Cell Viability - Methods and Protocols, ed. M. J. Stoddart, Humana Press, 2011 Search PubMed.
- S. Anoopkumar-Dukie, J. B. Carey, T. Conere, E. O'Sullivan, F. N. van Pelt and A. Allshire, Br. J. Radiol., 2005, 78, 945–947 CrossRef CAS PubMed.
- A. Barth, Biochim. Biophys. Acta, 2007, 1767, 1073–1101 CrossRef CAS PubMed.
- J. Sulé-Suso, D. Skingsleyc, G. Sockalingumd, A. Kohlere, G. Kegelaerd, M. Manfaitd and A. El Hajb, Vib. Spectrosc., 2005, 38, 179–184 CrossRef.
- H. Holman, M. Martin, E. Blakely, K. Bjornstad and W. McKinney, Biopolymers, 2000, 57, 329–335 CrossRef CAS PubMed.
- D. E. Bedolla, S. Kenig, E. Mitri, P. Storici and L. Vaccari, Vib. Spectrosc., 2014, 75, 127–135 CrossRef CAS.
- C. Saulou, F. Jamme, L. Girbal, C. Maranges, I. Fourquaux, M. Cocaign-Bousquet, P. Dumas and M. Mercier-Bonin, Anal. Bioanal. Chem., 2013, 405, 2685–2697 CrossRef CAS PubMed.
- F. S. Ruggeri, C. Marcott, S. Dinarelli, G. Longo, M. Girasole, G. Dietler and T. P. J. Knowles, Int. J. Mol. Sci., 2018, 19, 2582 CrossRef PubMed.
- A. Derenne, T. Claessens, C. Conus and E. Goormaghtigh, Infrared spectroscopy of membrane lipids, in Encyclopedia of Biophysics, ed. G. C. K. Roberts, Springer, Berlin/Heidelberg, Germany, 2013 Search PubMed.
- C. Petibois and G. Deleris, Analyst, 2004, 129, 912–916 RSC.
- Y. Pan, A. Leifert, D. Ruau, S. Neuss, J. Bornemann, G. Schmid, W. Brandau, U. Simon and W. Jahnen-Dechent, Small, 2009, 5, 2067–2076 CrossRef CAS PubMed.
- A. Bouhekka and T. Burgi, Appl. Surf. Sci., 2012, 261, 369–374 CrossRef CAS.
- N. Gault, O. Rigaud, J. Poncy and J. Lefaix, Int. J. Radiat. Biol., 2005, 81, 767–779 CrossRef CAS PubMed.
- N. Gault, O. Rigaud, J. Poncy and J. Lefaix, Radiat. Res., 2007, 167, 551–562 CrossRef PubMed.
- M. Sharma, J. C. Crosbie, L. Puskar and P. Rogers, Int. J. Radiat. Biol., 2013, 89, 79–87 CrossRef CAS PubMed.
- E. Lipiec, K. Bambery, P. Heraud, C. Hirschmugl, J. Lekki, W. Kwiatek, M. Tobin, C. Vogel, D. Whelan and B. Wood, J. Mol. Struct., 2014, 1073, 134–141 CrossRef CAS.
- A. Sancar and G. B. Sancar, Annu. Rev. Biochem., 1988, 57, 29–67 CrossRef CAS PubMed.
- A. Meade, C. Clarke, H. Byrne and F. Lyng, Radiat. Res., 2010, 173, 225–237 CrossRef CAS PubMed.
- K. Sailer, Int. J. Radiat. Biol., 1996, 69, 601–613 CrossRef CAS PubMed.
- G. Zhang, R. Zhu, Y. Xu, Y. Yan and Y. Dai, Acta Bot. Sin., 2004, 46, 711–718 CAS.
- G. Blankenberg, P. Katsikis, R. Storrs, C. Beaulieu, D. Spielman, J. Chen, L. Naumovski and J. Tait, Blood, 1997, 89, 3778–3786 Search PubMed.
- N. M. S. Al-Saffar, J. C. Titley, D. Robertson, P. A. Clarke, L. E. Jackson, M. O. Leach and S. M. Ronen, Br. J. Cancer, 2002, 86, 963–970 CrossRef CAS PubMed.
- J. R. Nicol, E. Harrison, S. M. O'Neill, D. Dixon, H. O. McCarthy and J. A. Coulter, Nanomedicine, 2018, 14, 439–449 CrossRef CAS PubMed.
| This journal is © The Royal Society of Chemistry 2019 |


