Görkem
Bakir
a,
Benoit E.
Girouard
a,
Robert W.
Johns
b,
Catherine R.-J.
Findlay
a,
Hans A.
Bechtel
b,
Max
Eisele
c,
Susan G. W.
Kaminskyj
d,
Tanya E. S.
Dahms
e and
Kathleen M.
Gough
*a
aDepartment of Chemistry, University of Manitoba, R3 T 2N2, Winnipeg, Canada. E-mail: Kathleen.Gough@umanitoba.ca
bAdvanced Light Source Division, Lawrence Berkeley National Lab, 94720, Berkeley, USA
cNeaspec GmbH, Bunsenstrasse 5, 82512 Martinsried, Germany
dDepartment of Biology, University of Saskatchewan, S7N 5E2 Saskatoon, Canada
eDepartment of Chemistry and Biochemistry, University of Regina, S4S 0A2, Regina, Canada
First published on 1st November 2018
With lethal opportunistic fungal infections on the rise, it is imperative to explore new methods to examine virulence mechanisms. The fungal cell wall is crucial for both the virulence and viability of Aspergillus nidulans. One wall component, Galf, has been shown to contribute to important fungal processes, integrity of the cell wall and pathogenesis. Here, we explore gene deletion strains lacking the penultimate enzyme in Galf biosynthesis (ugmAΔ) and the protein that transports Galf for incorporation into the cell wall (ugtAΔ). In applying gene deletion technology to the problem of cell wall integrity, we have employed multiple micro- and nano-scale imaging tools, including confocal fluorescence microscopy, electron microscopy, X-Ray fluorescence and atomic force microscopy. Atomic force microscopy allows quantification of ultrastructural cell wall architecture while near-field infrared spectroscopy provides spatially resolved chemical signatures, both at the nanoscale. Here, for the first time, we demonstrate correlative data collection with these two emerging modalities for the multiplexed in situ study of the nanoscale architecture and chemical composition of fungal cell walls.
The virulence and viability of opportunistic fungal pathogens is directly dependent on the biosynthesis, architecture, composition, and integrity of their fungal cell walls, which surround, support, and protect the cell and mediate interactions with the environment. The cell wall integrity (CWI) signalling pathway regulates cell wall biosynthesis as well as the cell division cycle, allowing fungal cells to coordinate responses to a diverse set of adverse conditions.5,6 Accordingly, these walls and pathways have long been prime targets for the development of antifungal drugs.7,8
Like all fungi, Aspergillus cell walls are a complex matrix of chitin fibrils, α- and β-glucans, galactomannans, other sugars, proteins and glycoproteins.2,9 Galactofuranose (Galf), a polysaccharide and glycoconjugate component, is a minor component of the cell wall by weight. Nonetheless, Galf is important for fungal growth, adhesion, morphogenesis, wall architecture, spore development and pathogenesis. It is often found in Aspergillus fungal-type galactomannan9 and glycoproteins (e.g. O-mannose glycans, N-glycans) which modify extracellular enzymes and cell wall proteins.10–12 UDP-galactopyranose mutase catalyzes the final step in UDP-Galf biosynthesis while the UDP-galactofuranose transporter moves Galf out of the cell for incorporation into the cell wall. Gene deletion strains ugmAΔ13 and ugtAΔ,14 which lack the mutase catalyst and transporter enzymes, respectively, were developed to explore the possible role of Galf in CWI. Interestingly, whole cell ELISA quantification and total immunofluorescence intensity of ugmAΔ showed higher levels of α-glucan, controlled by CWI pathways, and lower levels of β-glucan compared to wild type.15 Both gene deletion strains were more susceptible to caspofungin (which inhibits β-glucan synthesis), while the sensitivity to Calcofluor and Congo red (which bind to chitin) was similar to that of wild type.14–16
We have imaged fungi and their cell walls in multiple ways, including confocal fluorescence microscopy, scanning and transmission electron microscopy (SEM, TEM),13–17 atomic force microscopy (AFM), force spectroscopy (FS),17 and X-Ray fluorescence.18 We next sought spatially-resolved chemical imaging of the cell wall using vibrational spectra of hyphae, in situ. Information obtained from vibrational spectroscopy (Infrared and Raman) has enabled us to clarify distinctions among species, including differing effects of pH and temperature stress on mature hypha.19,20 Growing tips and sporulating hyphae have been characterized,21 along with the identification and spatial location of secondary metabolites.22,23 Our efforts to obtain vibrational spectroscopic signatures from cell walls have proved challenging, as the wall is typically only tens of nm thick, with a composition that changes along the length behind the growing tip during maturation. Neither whole cell Fourier-transform infrared (FTIR) imaging19–21 nor surface enhanced Raman spectroscopy24,25 were successful. To address this problem, we chose a novel correlative approach that would allow us to probe morphology and cell wall ultrastructure via AFM, and explore the spectrochemical composition of the cell wall at nano-scale spatial resolution, viz. near-field IR.
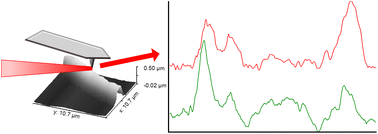
Synchrotron infrared nanospectroscopy (SINS) at the Advanced Light Source (ALS) illuminates an AFM tip with synchrotron infrared radiation which is used to probe a target.26 Thus, SINS enables AFM imaging and near-field broadband infrared spectroscopy with a tip-limited spatial resolution of <30 nm, to simultaneously examine spatially-resolved envelope ultrastructure and chemical composition at high resolution. This is a proven technique; however, the majority of studies have been on hard, mostly inorganic materials, with only a few focussing on biological targets, and most of the latter are on purified nano-size components.28–32 The tip–substrate coupling required to obtain scatter is weaker for soft organic materials.33
Here we report the first near-field infrared study of chemical differences in the cell walls of wild type A. nidulans and the two gene deletion strains, ugmAΔ and ugtAΔ. Our results illustrate how the combined results of AFM (and potentially AFM-FS) data with the spectrochemical information obtained from near-field infrared spectroscopy can open new avenues for the exploration of cell wall function and composition, in situ, at the nanoscale.
Fresh samples of A1149 and ugmAΔ were prepared for each of three SINS experiments at ALS; ugtAΔ was analysed during the final data collection session. Multiple points on several hyphae were analysed each time. Similar spectra were acquired at Neaspec, Germany, using their Neaspec nano-FTIR spectroscopy system on one sample of each strain, at points very close to those initially examined with SINS at ALS.
σ2(ν) = A2(ν)ei{φ(ν)} | (1) |
The SINS infrared absorbance spectrum was obtained by taking a ratio of this term against a background signal, collected at a near-by clean surface on the gold-coated wafer, and then extracting the imaginary component according to eqn (2):
![]() | (2) |
The most recent background spectrum was used in each case. Where two backgrounds (one before and one after) were available, both were evaluated and the better spectrum (good signal to noise, flat baseline) was selected.
Post-processing of Neaspec data was done with neaPLOTTER software (Neaspec GmbH, Germany), which effectively performs the same mathematical procedures as above to yield near-field IR absorbance spectra.
![]() | ||
Fig. 1 Images of hyphae, right to left, A1149, ugmAΔ and ugtAΔ, respectively. (A) Bright-field images of strains on AuSi wafers for AFM and SINS data collection, photographs at 50×. (B) TEM of cell walls (adapted from ref. 13 and 14). Arrows denote dark outer edge of walls. Scale bars in B = 100 nm. |
TEM images (Fig. 1B) have shown that A1149 walls are ∼50 nm thick, whereas those of ugmAΔ and ugtAΔ are three to four times thicker.13–17 Edges of the walls (arrows in Fig. 1B) are delineated by electron-dense material. The ugmAΔ and ugtAΔ cytoplasm appeared to be wild type, but the lack of Galf altered the cell wall and, presumably, its composition.13,14 The ugmAΔ cell wall appeared to be less well organized than wild type; the dark outer layer that defined the wall edge was broken and uneven. Total lack of dark layering within the wall of the ugtAΔ strain indicated significantly altered internal composition. A plausible explanation is that this strain has less protein and more carbohydrate, which does not stain strongly;15 alternatively, there could be some protein, albeit more thinly dispersed in a less well ordered wall. TEM images provide high spatial resolution information on cross sections, but minimal morphological and chemical analyses.
AFM images of typical targets for near field IR recorded with the SINS instrument showed that wild type hyphae had retained a cylindrical, tubular form, with a maximum height of 400–500 nm along the centre (Fig. 2A). SINS spectra were acquired from the centre of the mature hyphal wall, some 50–100 μm behind the growing tips, from multiple hyphae (Fig. 2B). Spectra in this and other figures were displayed on common scale, and offset for clarity. Note that total intensities of different spectra depend in part on the strength of the tip–substrate coupling, so that the absolute intensities cannot be quantified. However, relative intensities within spectra depend on amounts of the individual functional groups present in the probed volume.
Though individual spectra were noisy, the profiles were very similar to each other and unlike those from far field FTIR experiments.19–21 In far-field, the amide I and II bands around 1650 and 1545 cm−1 were much more intense than those of the carbohydrate region (900–1200 cm−1). The latter region always presents as a group of overlapping bands, but the number and relative intensity of bands in the SINS spectra were different, vide infra. Since the fungal cell wall is rich in carbohydrates, the increased carbohydrate signal was good evidence that the SINS method was indeed probing the surface, with an estimated voxel edge of 30–40 nm.
Fungi interact with their surroundings bidirectionally, exuding materials to test for nutrients, and imbibing nutrients. AFM of this wild type hyphae showed what appeared to be minute droplets of dried liquid, which were tentatively ascribed to dried exudate. Spectra recorded at random spots were similar, showing both amide and carbohydrate bands. However, this phenomenon was only observed for one hypha out of three different sample preparations and several hyphae observed in each case. Detailed band assignments were not attempted; we concluded that this was a sample preparation issue, possibly due to cell rupture, which we will investigate in future.
In an AFM-FS study of surface architecture, the ugmAΔ strain was previously found to be less rough (subunit size ∼3× greater than in wild type), and less well ordered, with an elastic modulus one tenth that of normal wild type hyphae.17 This fact, and the loss of viscoelasticity, indicated that, despite being a minor wall component, Galf likely has a role in cross-linking.
The first obvious difference between the spectra of wild type and ugmAΔ and ugtAΔ gene deletion strains is in the relative intensities of the amide (I & II) and carbohydrate bands (Table 1). The amide bands are the most prominent in the wild type spectra, and much weaker in those of the ugmAΔ and ugtAΔ. The TEM images showed that the cell walls of the gene deletion strains are 3 to 5 times thicker than the wild type (Fig. 1); decreased staining had been interpreted as a decrease in protein content of the cell walls, with ugtAΔ having the least. Reduction of protein content in these strains could explain the reduction in the amide band intensities; however, the N-acetyl groups in chitin also absorb in this region, with band maxima reported to be ∼1640 and 1540 cm−1 (Table 1). In fungal cell walls, chitin is located at the base of the wall, adjacent to the lipid membrane of the encapsulated cells.1–3 The thin wall of wild type hyphae (estimated to be 25–50 nm) could potentially allow chitin acetamide bands to appear in the SINS spectra but most likely at longer wavelengths than protein. The amide I band maximum in A1149 is observed at 1655 cm−1, best assigned as α-helical protein rather than chitin. In contrast, the increased wall thickness would preclude detection of the underlying chitin layer in ugmAΔ and ugtAΔ. The significant loss of intensity at this region in spectra of the gene deletion strains is therefore attributed to lack of protein within cell wall itself. This spectrochemical result is consistent with the physical structure, and further confirms that the SINS spectra are probing the surface of the hyphae.
A1149 | ugmAΔ | ugtAΔ | Assignment |
---|---|---|---|
a Ref. 34. b Ref. 35. c Ref. 36. d Ref. 37. | |||
1049 | 1020–1040 | 1020–1040 | α,β-glucana,b |
1079 | ν(CO), β-glucana | ||
1116–1130 | 1113–1125 | ν(CC), C–O–C chitin, β-glucana,c | |
1157 | 1153 | 1157 | ν(COC), ν(CC) α-glucana |
1546 | 1549 | 1550 | Amide II, β-glucanb,d |
1630 | 1623 |
ν(C![]() |
|
1655 | 1650 | 1650 | Amide Ia,b,d |
Overall, spectra of both gene deletion strains exhibit much higher relative intensity than wild type in the 1150 to 900 cm−1 region, variously attributed to carboxymethyl groups of glucans.34–37 Amide and chitin bands are well known; however, literature assignments for glucan bands are hampered by problems with sample consistency. Literature values reported for these compounds are often based on partially refined extracts from various natural sources, ranging from shellfish and insects to fungi and yeasts. Our analyses of the spectra in the 1150–900 cm−1 region are based on peak assignments from spectra of chitin and α- and β-glucans, purified from A. Niger,34S. cerevisiae,34,35,37 a moth (Ephestia kuehniella Zeller) and commercial shrimp chitin.36 The ugmAΔ and ugtAΔ strains have significantly lower peaks than wild type at 1079 cm−1 and significantly higher peaks than wild type at 1130–1155 cm−1. These absorbance bands are assigned to β-glucan and α-glucan, respectively (Table 1). Thus the SINS spectra provide direct evidence that gene deletions preventing Galf from contributing to wall structure induce a response that preferentially increases the α-glucan content.
One of the major advantages of opportunistic fungi is their ability to respond dynamically to threats through pathway regulation.1–3 Cell wall stresses are known to activate genes responsible for the synthesis of cell wall components such as chitin or α-(1,3) glucan.38–42 Galf is only a minor component in cell wall, but possible roles for Galf in cell wall synthesis have been noted by us and others.13–17,43–46 Based on the cell wall remodelling in strains deficient in Galf, we originally hypothesized that its absence would alter not only the organization of cell wall components, but also their biochemical composition through CWI and other signalling pathways.13–17
The typical CWI response is to upregulate certain cell wall components in a compensatory fashion.2 AFM and TEM of these strains had shown that an absence of Galf significantly altered the cell wall architecture, composition, function and integrity. Nonetheless, this CWI response failed to protect it against certain antifungal drugs,14–16 underscoring the importance of Galf in cell wall maturation and hyphal extension. The SINS spectra show increases in the α-glucan wall content in the ugmAΔ and ugtAΔ gene deletion strains, consistent with our previous studies15 and an Aspergillus CWI response.2
Footnote |
† Electronic supplementary information (ESI) available. See DOI: 10.1039/c8an01591k |
This journal is © The Royal Society of Chemistry 2019 |