A review of sorting, separation and isolation of cells and microbeads for biomedical applications: microfluidic approaches
Arash
Dalili
a,
Ehsan
Samiei
b and
Mina
Hoorfar
 *a
*a
aThe University of British, School of Engineering, Okanagan Campus, 3333 University Way, Kelowna, BC, Canada V1 V 1 V7. E-mail: mina.hoorfar@ubc.ca
bUniversity of Victoria, Department of Mechanical Engineering, 3800 Finnerty Rd, Victoria, BC V8P 5C2, Canada
First published on 24th October 2018
Abstract
Several biomedical analyses are performed on particular types of cells present in body samples or using functionalized microparticles. Success in such analyses depends on the ability to separate or isolate the target cells or microparticles from the rest of the sample. In conventional procedures, multiple pieces of equipment, such as centrifuges, magnets, and macroscale filters, are used for such purposes, which are time-consuming, associated with human error, and require several operational steps. In the past two decades, there has been a tendency to develop microfluidic techniques, so-called lab-on-a-chip, to miniaturize and automate these procedures. The processes used for the separation and isolation of the cells and microparticles are scaled down into a small microfluidic chip, requiring very small amounts of sample. Differences in the physical and biological properties of the target cells from the other components present in the sample are the key to the development of such microfluidic techniques. These techniques are categorized as filtration-, hydrodynamic-, dielectrophoretic-, acoustic- and magnetic-based methods. Here we review the microfluidic techniques developed for sorting, separation, and isolation of cells and microparticles for biomedical applications. The mechanisms behind such techniques are thoroughly explained and the applications in which these techniques have been adopted are reviewed.
Introduction
Several biomedical-related research studies focus on specific cell types or analytes attached to microparticles that exist in samples containing multiple other components that are not of interest.1 In such studies, the target components are required to be purified from the original sample or sorted based on their properties to be used or studied individually.2,3 Depending on the application, these target components exist in moderate or low populations in the samples. An example of a moderate population is cancer immunotherapy, in which certain immune cells, such as natural killer cells, are separated from the body sample, cultured and/or biologically modified, and then injected back into the patient.4,5 Circulating tumour cells are rare cells existing in low numbers in the blood or lymphatic samples taken from cancer patients and are an indication of cancer metastasis, disease progression or survival.6,7 In some applications microparticles functionalized with specific receptors to certain analytes or cell surface markers are used to capture and purify the target components.8,9 Conventionally, there have been laboratory-based strategies to isolate, sort or separate these target cells or microparticles which have been more or less successful. However, they require long processing hours, large volumes of samples and reagents, and have been associated with human error as many of the steps are performed by skilled personnel.10In recent years, advances in the development of lab-on-a-chip (LOC) devices have made it possible to perform an entire or partial analytical assay on a miniature device, barely the size of a smartphone.11–13 These devices have been applied to a wide range of applications, including diagnosis,12,14,15 proteomics16 and cell-based studies.17,18 The success in downscaling the analytical assays and development of such compact LOC platforms has been achieved by the aid of microfluidics, which is a powerful tool for manipulating fluids in the form of either a continuous flow (through pre-fabricated microchannels) or discrete droplets (on so-called digital microfluidics (DMF) devices).19–22
Since the introduction of LOC, several microfluidic-based techniques have been developed to achieve separation or isolation of cells or microparticles from their original sample with the aim of enhancing the efficiency and accuracy of these processes compared with the conventional laboratory-based procedures.23–26 Based on the physical and biological properties of the target components, these separation or isolation methods function based on different mechanisms, including filtration, inertial forces, deterministic lateral flow, pinched flow fractionation, acoustic separation, dielectrophoresis (DEP), magnetic and optical forces. Depending on the concentration of the target components, these methods can be categorized into two groups: (i) sorting and separation and (ii) isolation. In the sorting and separation category, the target component normally has a relatively high concentration and the device is used to separate them based on their biophysical properties.2 On the other hand, isolation refers to applications in which a rare component (e.g. circulating tumour cells) is isolated from the rest of the sample 3.
Microfiltration
Microfiltration is possibly the most well-known method for separating cells and particles. As a passive method of separation, this technique does not rely on any external forces to operate. This method separates particles according to their size and can be divided into three main categories: membranes,27–35 pillars36–40 and weirs.41,42 Microfiltration devices can also be classified according to the direction of the flow: dead-end or cross-flow filters.1 In the case of dead-end, the flow is perpendicular to the filter plane, whereas in the case of cross-flow filtration, the flow is along the filter structure.43 Generally, dead-end filtration is a more efficient method for capturing large particles; however, clogging is a major problem associated with these filters. On the other hand, cross-flow filtration avoids clogging by washing away large particles.29The use of membrane filters for separating micro- and nano-particles dates back to late 1980s,44,45 when Stemme and Kittilsland45 fabricated a two-membrane-filter structure in silicon, which was able to separate particles down to 50 nm. The parallel membranes were adjusted in a way that when the flow passes through the first membrane, it has to go through the gap between the two membranes to reach the hole in the next membrane. Hence, two steps of filtration occur: the first step is performed by the membrane and the second one is completed by the gap between the two membranes. While membrane filters can be microstructures designed to separate the particles, a porous medium can play the role of the membrane.46,47 For example, emulsion photo-polymerization is used to fabricate a porous filter in a microchannel, which is capable of separating a whole blood sample into cell/serum components.47
The early micromembranes44,45 were applied as a dead-end type. However, recently more attention has been paid to the cross-flow configuration. As an example, a microfluidic device consisting of two PDMS channels, which are separated by a porous polycarbonate, was fabricated by Aran et al.48 The polycarbonate with 200 nm pores functioned as a membrane to separate plasma from the rest of the blood sample. Since the blood cells cannot permeate through the membrane, the plasma passes through it at a rate that depends on the pressure in the main channel, the size of the pores and flow resistance. By parallelizing 32 similar channels, this device can separate 2.5 mL of pure plasma in 4 hours.
In addition to membrane microfilters, weir and pillar microfilters have been widely utilized in both dead-end and cross-flow modes for the separation of particles (e.g., blood components49). Wilding et al.42 tested microposts, comb-type, and weir-type filters for the separation of white blood cells (WBCs) and red blood cells (RBCs). They concluded that fabrication of a weir-type filter is easier and this type of filter is more effective in terms of the separation efficiency. However, this is not conclusive, as the result is based on a limited number of fabricated microfilters. Wu et al.41 used dead-end weir-type microfilters to separate plasma from whole blood. The microfilter contained 20 and 100 μm deep chambers, connected by channels with a 6 μm gap. Since the 6 μm gap does not prevent the RBCs from moving to the next chamber, clogging is not an issue in this device. As a result of the small gaps, the flow rate is low. Therefore, RBCs stay in the chamber for a longer time. The effect of gravity causes the RBCs to descend and to be separated from the plasma, which flows to the next chamber.
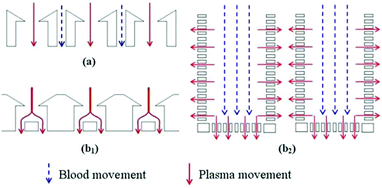
An example of a weir-type microfilter is shown in Fig. 1. Capillary action is the operating mechanism for separating plasma from the rest of blood. In this device, blood flows through a middle channel connected to two lateral channels used for collecting plasma. There are gaps in the middle and lateral channels, which prevent RBCs and WBCs from passing to the lateral channels,43 as the gaps in the weir-based devices provide filtration. In a pillar-type microfilter, the distance between the pillars is important for separation of the particles. For example, a multilevel pillar microfilter, capable of separating different components of blood, is shown in Fig. 2. Initially, an array of pillars with a 6 μm gap was used to separate RBCs and plasma from WBCs. Afterward, the second array with a gap of 2.5 μm was used to prevent the passage of RBCs through the filter. This way, more than 95% of RBCs were removed from the initial blood sample while the device recovered 27.4% of WBCs.37
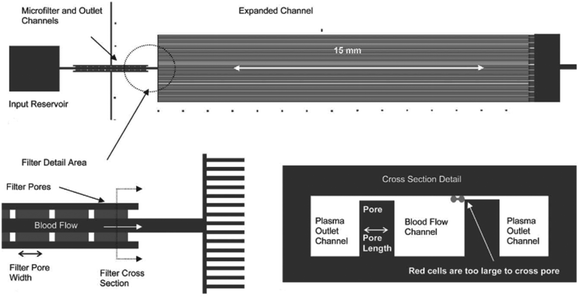 | ||
| Fig. 1 A weir-type microfilter in cross-flow mode, which is used for the separation of plasma. (Reproduced from ref. 43 with permission from The Royal Society of Chemistry, copyright 2005.) | ||
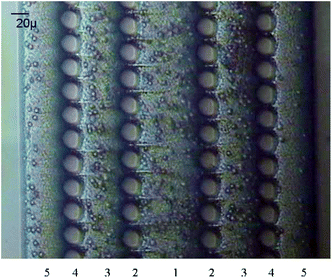 | ||
| Fig. 2 A multilevel pillar microfilter, used for separation of the components of blood. (Reproduced from ref. 37 with permission from Elsevier, copyright 2008.) | ||
Ji et al.50 concluded that pillar-type microfilters are the most suitable type for on-chip genomic analysis. They fabricated four different types of devices: a weir-type microfilter in dead-end mode, a membrane microfilter in dead-end mode, and pillar-type microfilters in both dead-end and cross-flow forms (all of which are shown in Fig. 3). They compared the capability of each device for separation of RBCs and WBCs. Considering the efficiency of separation and ease of fabrication, they suggested the pillar-type microfilters as the most efficient as compared to the weir and membrane types. Furthermore, the pillar microfilter was shown to be more efficient when used in cross-flow rather than dead-end mode. According to Chiu et al.,51 further enhancement of the separation efficiency and throughput of cross-flow filters can be achieved by implementing sheath flows. In essence, the sheath flow pushes the particles towards the filter, and hence increases the chance of the smaller particles being separated. Another study reported nearly 100% separation efficiency of plasma from diluted blood using two stages of microfiltration. The first stage included cell capture structures, while the second stage contained an array of pillar-type microfilters to increase the efficiency of the separation52 (see Fig. 4). To overcome the problem of particles clogging, Yoon et al.53 proposed the addition of mechanical oscillation to the fluid flow in a pillar-type microfilter. As the flow vibrates, larger particles (which are in contact with the filter) cannot move but the smaller particles pass through the filter. They managed to separate 20 μm and 5 μm polystyrene particles with 100% efficiency.
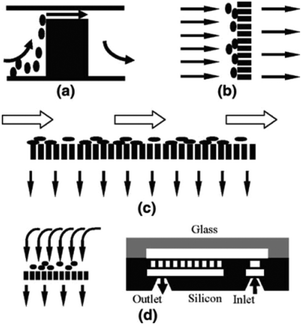 | ||
| Fig. 3 Schematic of (a) weir-based filter, (b) pillar-based filter, (c) pillar filter in cross-flow mode, (d) and dead-end membrane filter (reproduced from ref. 50 with permission from Springer Nature, copyright 2008.). | ||
 | ||
| Fig. 4 Two-stage filtration for separation of plasma from the rest of blood. (Reproduced from ref. 52 with permission from Elsevier, copyright 2014.) | ||
The filtration methods mentioned so far merely function based on the size. These methods work perfectly well if we assume that cells are rigid. However, the stiffness of the cells can affect the performance of microfilters. In fact, some studies have taken advantage of this effect to separate cells.54–59 Islam et al.58 reported the separation of live and dead Jurkat cells based on their stiffness. Their device, as shown in Fig. 5, consists of diagonal ridges causing a circulatory flow, which induces a hydrodynamic force on both the stiff and soft cells (in the same direction). As a result, the stiffer cells (dead cells) experience a larger elastic force (compared to the live cells) and are moved towards the “stiffer outlet”, as shown in Fig. 5. The results showed that the live cells are enriched 185 times with a purity of more than 99%. Later, Islam et al.59 used the same method to investigate the response of cancer cells to chemotherapy. After treating the cancer cells with chemotherapy, they separated chemo-resistant and chemo-sensitive cells based on their stiffness and studied each group to find the role of different mechanisms affecting the cancer cells’ resistance to drugs.
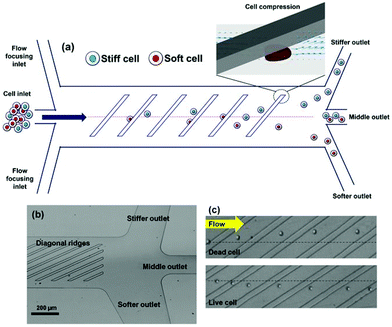 | ||
| Fig. 5 (a) A schematic of a cell sorter that works based on the stiffness of the cells. (b) An optical micrograph of the proposed design. (c) Dead cells, which are stiffer, are pushed in the direction of ridges; while the live cells are more affected by the circulatory flow and are moved laterally perpendicular to the ridges. (Reproduced from ref. 58 with permission from Nature, copyright 2017.) | ||
Inertia
The effect of the inertial lift force on particles was first found accidentally by Segre, observing the focusing behaviour of the particles flowing inside a pipe.60 Later in the 1960s and 1970s, other studies60–62 provided a better understanding of this phenomena. However, this technique was not used in microfluidic devices until 2007, when Di Carlo et al.63 fabricated the first microfluidic device of this kind. They studied particle focusing in straight as well as curved microchannels. For the straight channels, the channel Reynolds number (Rc) and particle Reynolds number (Rp) were used to describe the effect of the inertial forces on particles. | (1) |
 | (2) |
In the above relations, Um is the maximum channel velocity, Dh is the hydraulic diameter, ν is the kinematic viscosity and a is the particle diameter. For a particle's Reynolds number of order of 1 or higher, the inertial forces are large enough to affect the particles. The magnitude of the lift force exerted on the particles flowing between two infinite parallel plates can be calculated using eqn (3):64
 | (3) |
Deformable particles experience an extra lift force, away from the channel's wall. The balance between the deformability-induced lift force and the inertial induced lift force leads to a specific equilibrium position of the particles in the channel.65 For the case of the curved channels, a secondary flow is also created owing to the centrifugal force. This flow is called the Dean flow, which is a rotational flow perpendicular to the main flow. As a result of this Dean flow, an additional drag force is exerted on the particles, which can sort them according to their size. The Dean number is a dimensionless number defined to characterize this type of flow:
 | (4) |
In this equation, r is the radius of the curvature of the channel.
Di Carlo et al.63 investigated the effect of different parameters, such as the particle's Reynolds number, Dean number, the density of the particle and the ratio of the size of the particle to the hydraulic diameter of the channel. Based on their observations, they proposed a range of parameters to enhance the effectiveness of the inertial force for focusing particles. Di Carlo et al.66 further studied curved channels and managed to separate different particles so that each type of particle is guided to a different outlet according to its focusing position. They investigated the optimum flow rate for a high efficiency separation. In essence, the flow rate is proportional to the Reynolds number, which affects the inertial forces on particles. Hence, they tested different flow rates and concluded that, for their device, 0.9 μL min−1 is an optimum flow rate for separating rigid particles, emulsions, and platelets from a whole blood sample. Owing to the decisive role of the flow rate on particle focusing using inertial forces, other studies have also found a range of flow rates at which different particles focus in separate narrow lines.66–72
Generating a secondary flow is not limited to curved channels;63,72–74 different geometries of channels were also suggested to produce a secondary flow. Among them, spiral channels have been used in several studies.75–87 Kuntaegowdanahalli et al.79 used a spiral microchannel (see Fig. 6a) to investigate the effect of channel height and Dean number on the particle positions. They managed to separate 10 μm, 15 μm and 20 μm particles with an efficiency of 90%. Shen et al.82 showed that by adding micro-obstacles in serpentine channels (see Fig. 6b), sheathless separation of different particles (including polymeric particles, CTCs, and blood cells) is possible. This device can achieve up to 99.8% particle focusing with a throughput as high as 3 ml min−1.
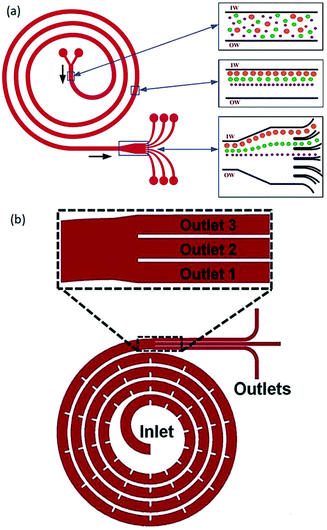 | ||
| Fig. 6 (a) A spiral channel to separate particles according to their sizes. (Reproduced from ref. 79 with permission of The Royal Society of Chemistry, copyright 2009.) (b) Micro-obstacles change the velocity field and lead to a higher Dean flow acceleration. As a result, high-efficient, high-throughput sheathless separation is achieved. (Reproduced from ref. 82 with permission from The Royal Society of Chemistry, copyright 2017.) | ||
The secondary flow can also be generated in a series of contraction and extraction channels,88–91 microchannel with slanted groove arrays on the top surface92–94 and serpentine channels.66,69,95,96 Park and Jung89 designed a microchannel, shown in Fig. 7, based on this configuration. The particle focusing is achieved by a long-term effect of the inertial force accumulated by a series of contraction and expansion chambers. The competition between the inertial and viscous forces aligns the particles in different equilibrium positions. Groove-based microchannels, shown in Fig. 8, can also cause secondary flow owing to a pressure difference in the transverse direction of the channel.93 The secondary flow causes the lateral rotation of the flow in the channel. Depending on the direction of the rotation and the magnitude of the secondary flow, the position of the particles can be affected. In order to maximize the magnitude of the secondary flow, which can lead to higher resolution particle focusing, the ratio of the channel's height to the groove's height should be 1, as reported in ref. 97.
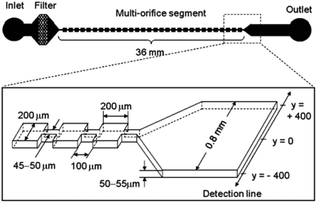 | ||
| Fig. 7 A multi-orifice microchannel, which can separate the particles without a sheath flow. (Reprinted from ref. 89 with permission from American Chemical Society, Copyright 2009.) | ||
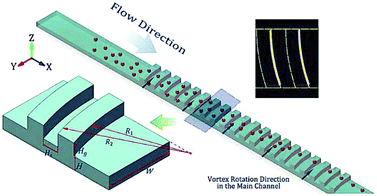 | ||
| Fig. 8 A schematic of a microchannel with a series of arc grooves. The interaction of the particles with the grooves can focus the particles into one single line. (Reproduced from ref. 93 with permission from Nature, copyright 2017.) | ||
An example of serpentine channels can be seen in Fig. 9. The small footprint and ease of parallelization are the advantages of this type of structure.67 Zhang et al. parallelized 8 serpentine channels to separate plasma from a diluted blood sample. Their device can process 7 × 10⁸ cells per minute.69 Another study achieved a throughput of 10.8 ml min−1 for separation of RBCs and WBCs from a diluted blood sample.90
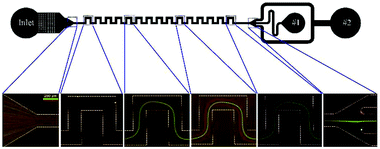 | ||
| Fig. 9 A serpentine channel used for separating 3 μm red and 10 μm green particles. At the beginning of the channel, the particles are mixed. As they flow further in the channel, each type is focused on a separate line. As a result, the particles can be separated at the outlet. (Reprinted by permission from Springer Nature,95 Copyright 2014.) | ||
Although the aforementioned inertial methods can handle high throughput and offer efficient and viable separation of cells, lack of purity has so far limited their application in rare cell trapping.98 Microvortices, as an inertia-based method, have recently been used for trapping rare cells.98–103 A narrow channel, which contains a series of expansion regions (referred to as reservoirs) forms the basic geometry of this method (see Fig. 10a). By adjusting the flow rate and the sizes of the narrow and expanded parts of the channel, larger particles can be trapped in the vortices made in the expanded parts. This method takes advantage of high purity and throughput without the need for sample preparation (such as diluting the blood samples by centrifugation). However, the loss of particles trapped in the vortices owing to particle–particle interactions is a drawback of this system.99 To overcome this issue, Paiè et al.99 explored different reservoir geometries to optimize the design, resulting in the highest separation efficiency by minimizing the particle–particle interactions. The optimum geometry suggested by them (shown in Fig. 10b) has higher separation efficiency (by 19%) compared to the standard vortex chips.
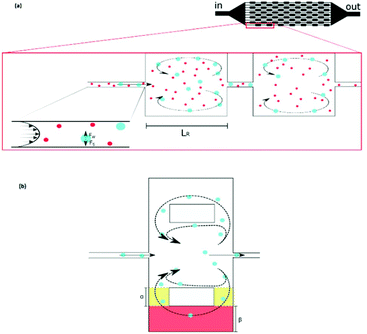 | ||
| Fig. 10 (a) A schematic of vortex-aided particle separation.99 (b) Revised reservoir geometry designed by Paiè et al. to reduce the particle–particle interactions in the reservoir, leading to higher separation efficiency. They studied the results for different α and β, as well as the length and width of the reservoir, to find the optimum geometry. (Reprinted by permission from Springer Nature,99 Copyright 2017.) | ||
Recently, Nejad et al.22 used a DMF platform to focus particles on a specific zone on the device, as shown in Fig. 11. The combination of gravitational forces and inertial forces caused by the controlled rotation of a droplet in a circular pattern leads to concentration of particles on the central electrode. The effect of different parameters, such as the size and density of the particles, the volume of the droplet and the geometry of the electrodes, on the efficiency of this system was investigated. It was concluded that larger particle and densities can lead to higher capturing efficiency. Under optimized conditions, this device is capable of capturing 5 μm silica particles and 15 μm polystyrene particles with an efficiency of 86% and 94%, respectively.
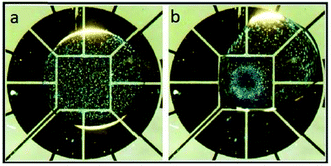 | ||
| Fig. 11 Particle focusing behaviour on a DMF chip. (a) The particles are randomly distributed in the droplet. (b) Rotation of the droplet around the center leads to the migration of the particles to the central electrode. (Reproduced from ref. 22 with permission from The Royal Society of Chemistry, copyright 2015.) | ||
Deterministic lateral displacement
In 2004, Huang et al.104 reported a novel method, referred to as deterministic lateral displacement (DLD), for the continuous separation of particles according to their sizes. This method uses the characteristic of laminar flow, which causes the particles to follow the streamline that passes through their center of mass. To take advantage of this characteristic, a periodic array of obstacles is used for separation. Each row of arrays is shifted from the last row by a certain a distance. Since the arrays are not in the same direction as the flow, the flow produces curvy streamlines. As streamlines pass through the gaps between the arrays, their position relative to the arrays changes. Depending on the size of the posts, the distance between each post, and the length that they are shifted after each row, a critical diameter can be found for any DLD microdevice. As a result, particles smaller than this critical diameter can be separated from those that are larger than the critical diameter. A schematic of a DLD design is shown in Fig. 12.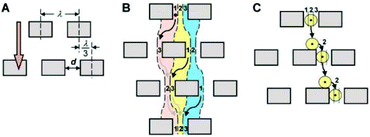 | ||
| Fig. 12 A schematic of a DLD design. (A) Geometrical parameters are shown. (B) Based on the geometrical parameters shown in (A), streamlines are affected. (C) Particles follow the streamline that passes through their center of mass. (Reproduced from ref. 104 with permission from AAAS, copyright 2004.) | ||
This method has been used for several biological purposes, including: the isolation of rare cells,105,106 enrichment of CTCS,107 separation of viable and nonviable mammalian cells,108 and separation of WBCs109 and RBCs110,111 from blood.
A phenomenon that can reduce the efficiency of separation in DLD devices is diffusion. Diffusion causes particles to move laterally with respect to their streamlines and mix with the other group of particles. The Stokes–Einstein equation provides the diffusion coefficient for spherical particles:
 | (5) |
Based on the theory and experiments conducted by different researchers, several criteria have been suggested regarding the critical diameter, post shape, array geometry, post size, edge correction, inlet and outlet design and materials.112
The early DLD devices used circular posts,104 and they have been used in some recent studies.104,113–117 A problem associated with these posts is that at the top of the circular posts stagnation occurs, which can potentially trap particles, leading to clogging of the system.112 While increasing the gap between the posts can be helpful,118 another way to avoid or reduce the clogging effect is trying different geometries, including quadrilateral,119 triangular105,117,120,121 and streamlined122 designs. In addition to the clogging issue, experimental results123 have shown that the posts are not suitable for separation of deformable and non-spherical cells. To overcome these problems, Al-Fandi et al.124 proposed diamond and airfoil posts and modelled them in addition to the conventional circular posts. The results of their computational fluid dynamics simulation have shown that using the airfoil posts was a better choice for separating non-spherical deformable cells compared to the circular or diamond posts. In essence, the airfoil posts experience a lower drag force compared to the circular posts owing to their geometry. As a result, the cells are dragged less towards them, and hence deformability becomes a less important factor.
More recently, I-shaped posts have been used for separating RBCs, as non-spherical cells, from blood samples.125 In a recent study, topological optimization was performed on the geometry of the posts to improve the performance in terms of clogging, hydrostatic pressure requirements, and the range of the displacement characteristic. This optimization resulted in the geometry shown in Fig. 13a.118 An interesting application of these post designs can be seen in a recent study by Au et al.126 (see Fig. 13b). This device consists of two stages. The first stage is a common DLD design with the circular post, which removes large CTC clusters from whole blood based on their size. The second stage aims to separate the remaining smaller CTC clusters that the first stage failed to remove. The pillars are designed to separate asymmetric CTC clusters from the symmetric single cells. Hence, the height of the channel is restricted to 30 μm so that the RBCs are aligned and their long axis can be used for DLD separation. Recovery of 99% for large CTC clusters with more than 87% cell viability has been achieved by this design.
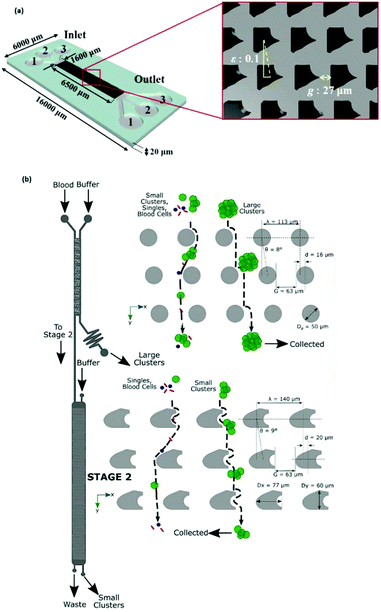 | ||
| Fig. 13 (a) A schematic of the optimized posts, which can increase the separation efficiency from 77% (obtained using the circular pillars) to 92.2%. (Reproduced from ref. 118 with permission from Elsevier, copyright 2017.) (b) A two-stage DLD design in which the second stage is optimized for the separation of CTCs from the blood cells. (Reproduced from ref. 126 with permission from Nature, copyright 2017.) | ||
Pinched flow fractionation
Pinched flow fractionation (PFF) is another passive method, which was proposed by Yamada et al.127 in 2004. Similar to the DLD, this technique uses laminar flow for separation of particles according to their sizes. Devices that work based on this mechanism usually contain a T junction, which is composed of two inlet channels that merge to the third narrow channel through a pinched segment. One of the inlet streams contains the particles and the other one is the sheath flow. The ratio of the two flow rates must be adjusted in a way to ensure that the sheath flow pushes all the particles to the wall of the pinched segment. According to the size of the particles, their center of mass is placed at different distances from the wall. As mentioned earlier, in a laminar flow, the particles have a tendency to flow along the streamline passing through their center of mass. Hence, the particles follow different streamlines in a PFF device since the center of mass of the particles is located at different lateral positions. The lateral distance of the streamline is amplified when the flow passes through the pinched segment and enters a broadened segment. Therefore, a small difference in the position of the particles is amplified and the particles are separated. Fig. 14 shows a device that functions based on the PFF concept. Several parameters affect the separation performance, including the ratio of the flow rates, the pinched section width, the boundary angle, the total flow rate and the geometry of the part that collects particles. All of these parameters should be optimized to find an optimum design.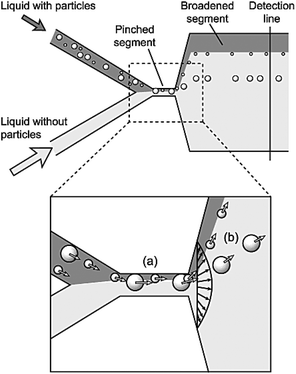 | ||
| Fig. 14 Schematic of the first pinched flow fractionation device. (a) In the pinched segment, the particles are pushed to the wall. (b) The center of mass of the particles is on different streamlines, depending on their size. The distance between the streamlines increases in the broadening part and the particles are separated. (Reprinted with permission from ref. 127, Copyright 2004, American Chemical Society.) | ||
In the primary design127 of such devices, symmetric channels were used for the outlets to equalize the resistance in all of the channels. Hence, the flow rates in all of the outlet channels were similar. One problem associated with this type of separation is that particles considerably smaller than the width of the channel cannot be separated since they all follow the path to the same outlet. To overcome this problem and increase the displacement of particles after passing the pinched segment, asymmetric pinched flow fractionation was proposed,128 in which one of the outlet channels was broadened or shortened to change the resistance. This so-called drain channel causes the asymmetric distribution of the flow, which changes the streamlines accordingly. Fig. 15 shows the effect of asymmetric distribution on separation of the small particles. It has been shown128 that this method is capable of separating 1 μm and 2.1 μm particles at a flow rate of 20 μL h−1 and efficiency of 80%. Another way to change the flow resistance in the outlets of the PFF devices is the use of microvalves129 (see Fig. 16). Depending on the position of the microvalve, the pressure in outlet 1 varies, changing the flow rate inside the channel and the path of the streamlines passing through the particles. By adjusting the valves, particles of different sizes can be guided to different outlets. Another important factor is the roughness of the walls of the pinched segment as the theoretical study in ref.130 proves that particles with diameter in the order of the wall roughness cannot be separated using this method.
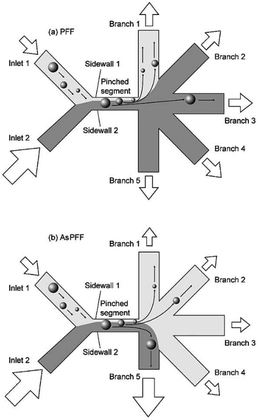 | ||
| Fig. 15 (a) A normal pinched flow fractionation versus (b) asymmetric pinched flow fractionation. (Reproduced from ref. 128 with permission from The Royal Society of Chemistry, copyright 2005.) | ||
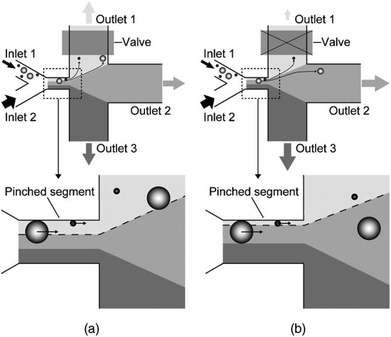 | ||
| Fig. 16 A microvalve implemented in a PFF device to tune the flow for enhanced separation of different sizes of particle. The effect of the valve can be seen by comparing (a) and (b). (Reproduced from ref. 129 with permission from Elsevier, copyright 2006.) | ||
A different approach to increase the lateral distance between the particles after the pinched segment is to add a snakelike part to the expanded segment of the device (see Fig. 17). When the flow enters the added part, first it is squeezed and then the channel is broadened again, amplifying the separation. This results in more effective separation of particles. The enhanced pinched flow fractionation has been modelled numerically and experimentally and shown to be capable of separating 7 different sizes of particles with an efficiency of 70%.131
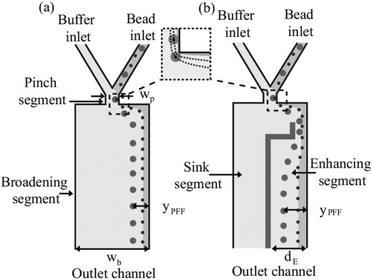 | ||
| Fig. 17 Adding a snakelike segment to a PFF device, which can further increase the lateral distance between the particles. (Reprinted from ref. 131, with the permission of AIP Publishing, copyright 2008.) | ||
Further improvements can be obtained by combining the principle involved in the PFF devices with other techniques. For instance, the effects of several forces, including sedimentation, centrifugal, optical and dielectrophoretic, combined with PFF have been investigated.132–135 Combining sedimentation and PFF can lead to separation according to both the size and density of particles. As can be seen in Fig. 18, the particles pass through the pinched segment in which they will be ordered based on their size in the horizontal part. After they enter the vertical curved channel, the sedimentation effect will be in action, separating particles of the same size according to their density. To increase the separation efficiency of this method, a centrifugal force can also be added by rotating the whole device, which may hinder the throughput of the system.133
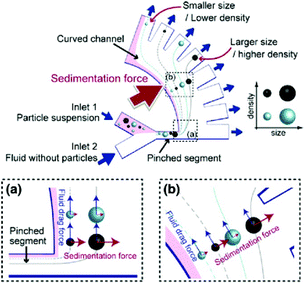 | ||
| Fig. 18 A design showing the combined effects of sedimentation and pinched flow. (Reprinted by permission from Springer Nature,133 Copyright 2011.) | ||
In addition to the separation efficiency, the throughput of the device can be significantly increased by taking advantage of inertial forces in the channel. This technique, which is called inertial enhanced pinched flow fractionation, achieves an order of magnitude higher throughput than the conventional PFF.136 In order to increase the effect of the inertial induced lift force on the particles, Lu and Xuan68,136 elongated the pinched segment. In this way, the lift force increases the lateral distance of the particles, enhancing the separation efficiency of this method. Since the particles are not meant to be pushed to the channel's wall anymore, the ratio of the flow containing the particle mixture to the sheath fluid flow rate can be increased, which leads to higher throughput. Later, Lu and Xuan68 implemented a viscous solution in their design to take advantage of the combined effect of the inertial lift and elastic forces. They referred to it as elasto-inertial pinched flow fractionation and mentioned that it can separate particles even smaller than 1 μm, which makes it unique among inertia-based separation techniques.
Acoustic
Acoustic waves are used as an active method for the separation of cells and particles. The magnitude of the acoustic radiation force, which is applied to suspended particles, can be calculated using eqn (6):137 | (6) |
In this equation, subscript p and m represent particle and medium, respectively. p0 is the acoustic pressure amplitude, Vp is the volume of the particle, β is the compressibility of the ambient medium, λ is the wave length, k is the wave number and φ is the acoustic contrast factor. The acoustic contrast factor is calculated using eqn (7):
 | (7) |
Standing acoustic waves, which have been used in many studies to manipulate particles, consist of fixed pressure nodes and antinodes. The minimum amplitude of the pressure along a standing acoustic wave is on the pressure node, while the maximum pressure is on the antinode. The sign of the acoustic contrast factor, which depends on the density and compressibility of the particle and medium, is the decisive factor in determining the sign, and consequently the direction, of the acoustic force. A positive contrast, which is usually the case for solid particles, means that the acoustic radiation force pushes the particles towards the pressure nodes. On the other hand, a negative acoustic contrast factor, which is usually the case for bubbles, results in movement of the particles towards the pressure antinodes. Based on eqn (7), separation of particles can be achieved according to the size,138,139 density140 and compressibility.141 The combined effect of density and compressibility can be observed in terms of the acoustic contrast factor. Furthermore, the role of the medium's density is shown in a study by Petersson et al.142
Different methods have been applied to separate particles as a result of the differences in the aforementioned characteristics. One of the most efficient methods is to separate particles with opposite signs for their acoustic contrast factors. To achieve opposite signs, it is important to choose the right medium. This method is desirable because particles can be pushed towards different lateral positions. However, the use of this method is limited since the acoustic contrast factor of most of the particles is positive. One of the first studies based on this concept was conducted by Gupta and Feke.141 This study proved the ability of the acoustophoresis method for separating particles based on their compressibility. While the density of the particles that they studied was almost the same, their different compressibility caused the acoustic contrast factors to have opposite signs. Using the same concept, lipids (with a negative acoustic contrast factor) have been separated from erythrocytes (with a positive acoustic contrast factor).143 This method resulted in recovering 70% of the erythrocytes and removing 80% of the lipids.
As mentioned earlier, usually the particles cannot be separated by the direction of the acoustic radiation force as most particles have a positive contrast factor. Thus, many studies that use acoustic waves for separation rely on the difference in the magnitude of the acoustic radiation force, which is applied to different particles. A common procedure for the separation of the particles based on the intensity of acoustic radiation force is to focus them along the wall of the channel and then expose the particles to the acoustic radiation force. The acoustic field is orthogonal to the flow, so the particles move laterally towards the pressure nodes, which are usually at the center of the channel. By adjusting the flow rate, width and length of the channel and the intensity of acoustic wave, different particles can be guided towards different outlets. The feasibility of this concept has been proven by Johnson and Feke,144 who separated 100 μm and 170 μm polystyrene particles. Chen et al.139 showed that this method is capable of high-throughput separation of platelets from whole blood. Their device, shown in Fig. 19, was capable of removing more than 85% of WBCs and RBCs while recovering more than 80% of platelets with a flow rate of 10 mL min−1. In their setup, a whole blood sample enters the lower part of the device and flows near the pressure antinodes. The acoustic force pushes all the particles upward; however, RBCs and WBCs experience a larger force as they are larger than platelets. As a result, they move faster towards the upper channel and separate from the platelets.
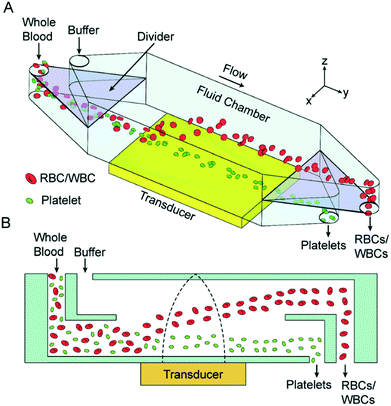 | ||
| Fig. 19 (A) Schematic of an acoustic-based separation device that can be used to separate platelets from whole blood. (B) The side view of this device, which shows how RBCs are pushed up by the acoustic waves. (Reproduced from ref. 139 with permission of The Royal Society of Chemistry, copyright 2016.) | ||
The idea of separating particles according to the lateral displacement owing to acoustic radiation forces can be combined with the split-flow fractionation process, which was first used by Kumar et al.145 As shown in Fig. 20, the flow containing the particles enters the channel through the narrow section. The acoustic radiation force pushes the particles towards the center of the channel. However, larger particles are affected more by acoustic waves, and hence they move faster. The characteristics of the flow and channel are adjusted so that the splitter separates the flow containing the larger particles from the rest. Kumar et al.145 developed a model to predict the trajectory of the particles and proved the accuracy of the model by comparing against the experimental tests. Hybridoma cells and Lactobacillus rhamnosus cells were separated by this model as a proof of concept.
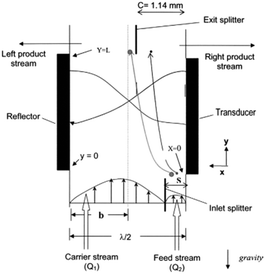 | ||
| Fig. 20 A combination of split-flow fractionation and acoustic radiation force. (Reproduced from ref. 145 with permission from John Wiley and Sons, copyright 2005.) | ||
The lateral displacement of particles becomes more challenging when dealing with more than two particles. The separation of up to 4 different particles has been performed using the free flow acoustophoresis method by Petersson et al.142 They separated a mixture of four particles of different sizes with efficiencies of between 62% and 94% using the design shown in Fig. 21a. In this study, they also fractionated red cells, platelets, and leukocytes. While this method separates all the particles at once, some studies have implemented multi-stage acoustophoresis to increase the throughput and separation efficiency.146–148 For example, Adams and Soh146 fabricated a two-stage acoustophoresis device, shown in Fig. 21b which is able to separate three different particles. This device uses a buffer to keep the particles near the channel's walls. The first stage is designed so that the acoustic radiation force focuses two types of the particles in the middle of the channel (passing them to the second stage), while the other particle type, which is still near the walls, flows to an outlet. In the second stage, the two remaining particle types are separated using the same concepts.
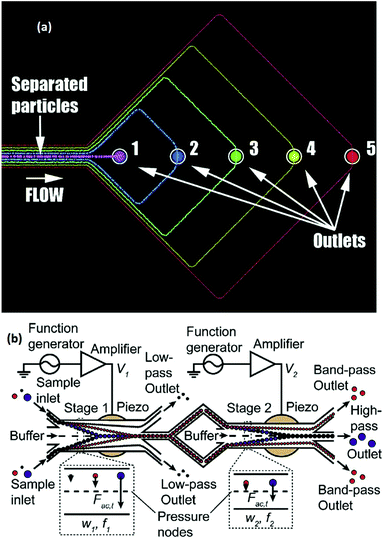 | ||
| Fig. 21 (a) A single stage free flow acoustophoresis device, which can separate 5 different types of particles. (Reprinted with permission from ref. 142, Copyright 2007, American Chemical Society). (b) A multi-stage free flow acoustophoresis device. (Reprinted from ref. 146, with the permission of AIP Publishing, copyright 2010.) | ||
The studies reviewed so far use bulk acoustic waves (BAWs). BAWs microfluidics chips usually comprise a bulky transducer that is attached to the wall of the channel. The transducer generates acoustic waves, which are supposed to propagate from the outside of the channel to form a standing wave. As a result, the channel has a high acoustic reflection quality. However, this technique limits the choice of materials (e.g. glass and silicon) used for the channel. For instance, PDMS, which is one of the most common materials used for fabrication of channels, cannot be used for this method. To solve this problem, two transducers bonded to both sides of the channels can be used. However, owing to their complex design, such devices have not been popular.149 Using surface acoustic waves (SAWs), on the other hand, will not only solves this problem but also provides a more precise, energy efficient and easier solution for mass production.150 For SAW devices, two interdigitated transducers (IDTs) are patterned on a piezoelectric surface on two different sides of the channel. Several studies have used SAWs for the separation of particles either in the form of a standing surface acoustic wave (SSAW)138,151–153 or a travelling surface acoustic wave (TSAW).154–159 Nam et al.160 used standing surface acoustic waves (SSAWs) for separation of particles according to their size (see Fig. 22). Using the hydrodynamic force applied by sheath flows, they first focused the particles at the center of the channel (where the acoustic force is more effective and the shear rate is small). Next, they adjusted the SSAW so that the pressure nodes are positioned at the walls and the pressure antinode is at the center of the channel. In addition, they developed an analytical model including the viscous and acoustic forces and diffusion, which can predict the particle's displacement. Based on the results of this simulation, it was shown that the effect of diffusion is negligible, proving the practicality of this method in separating small particles (such as platelets). Later, they used this method for separating platelets from whole blood.152 The same method was used to separate Escherichia coli bacteria from peripheral blood mononuclear cells.161
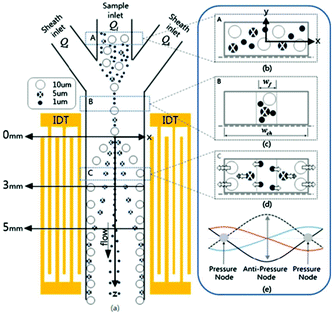 | ||
| Fig. 22 Schematic of a standing surface acoustic wave device. The sheath flow focuses all the particles to the middle of the channel. The larger particles experience larger acoustic force towards the channel wall. (Reprinted by permission from Springer Nature,160 Copyright 2011.) | ||
The wavelength of acoustic waves is set as half of the channel width for most of the SSAWs techniques, as it is desired to have the pressure nodes on the side walls. The wavelength used in these types of experiments is typically larger than the particles. However, when the wavelength is close to the particle size, the acoustic radiation force applied to the particles increases nonlinearly. This means that by implementing smaller wavelengths, more precise separation can be achieved based on the particle size. The application of travelling surface acoustic waves (TSAW) instead of SSAW can make it possible to use smaller wavelengths while only one IDT is required to be deposited for the actuation.162 In addition, for the fabrication, the IDT does not need to be parallel with the channel163 (see Fig. 23). Using this method Destgeer et al.163 were able to separate 3 μm and 10 μm particles with 100% efficiency. In another study, Ma et al.162 used TSAW to separate polystyrene and polymethylmethacrylate according to their mechanical properties. Wang et al.164 combined SSAW and TSAW to achieve sheathless isolation of CTCs from blood samples. A pair of straight IDTs is used to generate SSAWs to focus all the particles in the middle of the channel (on the pressure node). Consequently, focused interdigital transducers produce TSAWs affecting the CTCs and separating them from blood cells. More detailed information about the applications of SAWs can be found in ref. 137, 150, 165 and 166.
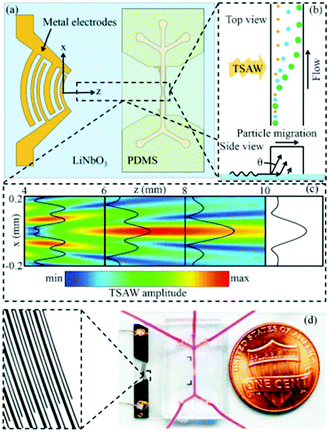 | ||
| Fig. 23 (a) Schematic of a travelling surface acoustic wave-based separation device. (b) The side view of the channel shows how different sizes are affected by TSAW. (c) The amplitude of the TSAW field. (d) The chip fabricated by Destgeer et al. (Reproduced from ref. 163 with permission from The Royal Society of Chemistry, copyright 2013.) | ||
Although the majority of the acoustic methods use a constant frequency to manipulate particles, a number of studies167,168 have investigated the effect of frequency on the manipulation of the particles. Most of these studies used the first standing mode of an acoustic wave for the manipulation of particles. However, Liu and Lim168 used the first and third modes in their device: first, the particles affected by the first mode move laterally away from the pressure antinode (located at the wall of the channel) towards the pressure node. Since the larger particles experience a greater force, they move towards the pressure node faster. After a specific period of time, the frequency is switched to the third mode. Those large particles that had already passed the BB line (see Fig. 24) continue their path towards the center of the channel. The others are pushed to the first pressure node (line AA in Fig. 24). After switching the frequency a few times between the first and the third modes, most of the large particles align at the center while the smaller ones align on the pressure node at line AA.
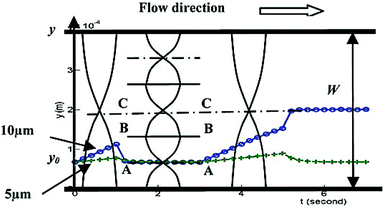 | ||
| Fig. 24 Schematic of particle separation by switching the frequency of the acoustic waves. (Reproduced from ref. 168 with permission from The Royal Society of Chemistry, copyright 2011.) | ||
Dielectrophoresis
When a particle is in a non-uniform electric field, it is polarized and experiences a force from the electric field. This phenomenon is referred to as dielectrophoresis (DEP). The DEP force can be calculated as:| FDEP = 2πεmR3CM(∇E2) | (8) |
 | (9) |
Based on the sign of the CM factor, there are two categories of DEP: negative dielectrophoresis (nDEP) and positive dielectrophoresis (pDEP). The pDEP happens when the particle is more polarizable than the medium and the DEP force on the particles is towards the highest intensity electric field regions. On the other hand, the higher polarizability of the medium in comparison to the particle generates an nDEP effect, pushing the particles towards the lowest intensity electric field regions. Particle separation can be achieved using the DEP force according to the size of the particles or the CM factor. The latter depends on the permittivity of the particles relative to the permittivity of the medium. Permittivity also changes with the frequency of the applied voltage. The frequency at which the sign of the CM factor (and hence the sign of the DEP force) changes is known as the crossover frequency. By applying the frequency in the range between the crossover frequencies of two different particles, the DEP force applied to the particles is in opposite directions, and can separate the particles.169
Although both direct (DC) and alternative current (AC) can generate DEP, their effect on particles is not the same. In case of DC DEP, insulators are used to make the non-uniform electric field, and hence it is called insulator-based DEP or iDEP. In this case, the electric field can be applied by external electrodes. The external electrodes can be fabricated by injection molding or embossing. As a result, the sputtering process can be avoided.170 Hence, the fabrication process for iDEP devices is easier and more cost-effective as compared to AC-based DEP.171 Moreover, the chance of electrolysis can be reduced significantly as the electrodes are not in contact with the sample in iDEP devices.170 On the other hand, contactless electrodes means that the electrodes should be on different sides of the channel (i.e., a larger distance between the electrodes), which results in a smaller magnitude of the electric field and consequently the DEP force. Thus, higher voltages (and also higher excessive heat) should be applied in the case of iDEP to compensate for this large gap between the electrodes. On the other hand, the smaller voltages required for the AC DEP makes it possible to use batteries for particle separation.172 Such phenomena and their applications have been reviewed in multiple studies.173–178
Manipulation of particles by DEP has been performed in both continuous and batch form174 and even on a digital microfluidic chip.179–181 As a simple example of batch processes (which are used mostly in the earlier DEP devices), one type of particle is trapped by the positive DEP on the electrodes (which is a high-intensity region of the electric field), while the other particles affected by nDEP are repelled from the electrodes. The particles influenced by nDEP can move freely. Hence, when a flow passes through the chamber, these particles move with the flow and separate from the trapped ones. By turning off the applied voltage, the trapped particles are released and can be washed away by another flow. The low separation throughput of this type of method is the main reason that it is not widely used.169 Although batch DEP is simpler to perform, the higher throughput of the continuous DEP devices has attracted the interests of researchers.182–184 Such devices usually use angled electrodes to push cells or particles to a target outlet. For continuous separation, more parameters (such as the flow rate, voltage, frequency, and geometry) need to be adjusted to ensure that each type of particles will be guided to its specific outlet. As a result, the continuous process can be more complex than the batch type explained above.
While pDEP is usually used for batch processes, it is also used for continuous separation. For example, human mesenchymal stem cells and their differentiation progenies (osteoblasts) have been sorted using the design shown in Fig. 25.185 In this study, a buffer pushes the cells to one of the channel's wall. The frequency is set so that the osteoblasts experience a pDEP and they move along the oblique electrodes. By turning off the voltage, the cells are released and move along with the flow. Consequently, the osteoblasts follow a zig-zag trajectory towards their outlet.
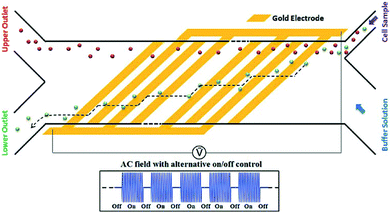 | ||
| Fig. 25 A design used for continuous sorting of stem cells and osteoblasts. (Reproduced from ref. 185 with permission from The Royal Society of Chemistry, copyright 2015.) | ||
Some researchers have used nDEP and pDEP simultaneously.186,187Fig. 26 shows an example of one of the first continuous DEP devices that uses both pDEP and nDEP. This device is used to separate viable and nonviable yeast cells with a flow rate of up to 1 μL min−1. The nonviable yeast cells, which are affected by the nDEP, are focused on the central line, while those affected by the pDEP are pushed to the sidewalls.186 Later, Das et al.182 used the same configuration to manipulate and trap polystyrene particles as well as HeLa cells. They also simulated this design and verified the model by performing experiments. This model was used to find an optimized design for effective manipulation of the cells without electroporation.
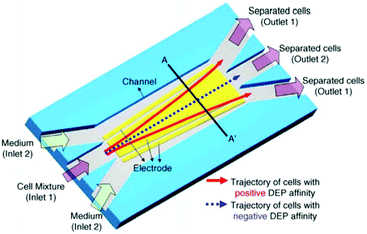 | ||
| Fig. 26 A design used by Doh and Cho for a continuous DEP based cell separation. (Reproduced from ref. 186 with permission of Elsevier.) | ||
DEP has also been used in field flow fractionation188 and implemented for both batch and continuous separation.189–203 In these devices, the poiseuille flow (with the parabolic velocity profile) makes the particles at different distances from the wall move with different velocities. Hence, particles can be separated based on the time they take to reach the end of the separation chamber. To make use of this phenomena, nDEP can be used to repel the particles from the electrodes, applying the force in the opposite direction to gravity. Fig. 27 shows the effects of the DEP and buoyancy forces on dissimilar particles. The DEP and buoyancy forces applied to the particles vary with the density, size, and polarizability of the particles. As a result, the particles end up in different vertical positions inside the channel, flowing with different velocities and consequently reaching the end of the channel at different times. Vykoukal et al.197 used dielectrophoretic field-flow fractionation (depFFF) to enrich putative stem cells from adipose tissue in a batch process. For each run, 106 cells entered the separation channel. After 10 minutes of settling in the separation channel, the mixture flowed at 1500 μL min−1 while the DEP force was applied to the cells. DepFFF is also used for other biological purposes such as separation of platelets from the rest of blood cells,202 differential analysis of human leukocytes,195 separation of cancer cells204 and CTCs.199,205
 | ||
| Fig. 27 The interaction of hydrodynamic and DEP forces on particles positioning them in the different flow-velocity lamina. (Reproduced from ref. 197 with permission of The Royal Society of Chemistry, copyright 2008.) | ||
DEP devices can also be classified according to other properties, such as electrode configuration, operating strategy and their applications.177 The classification based on electrodes includes parallel or interdigitated,206–209 castellated,172 oblique,210,211 curved,212,213 quadrupole,214–216 microwell,217,218 matrix,219 extruded,220 top–bottom patterned,221–223 sidewall patterned,224 insulator-based or electrodeless,225–231 contactless232–235 and bipolar electrodes.231 In most cases, the electrodes are fabricated in a planar form, reducing the throughput of the device. In a planar DEP, there is also a limited range of heights at which the electric field interaction is strong enough to manipulate particles. As a result, the channel's height should be small, which leads to a low throughput. To overcome this issue, some researchers go through the hardships of fabricating 3D DEP devices, which allow higher channel heights and higher flow rates.174,184 For example, Yunus et al.236 separated colloidal particles in a continuous mode using an nDEP device (see Fig. 28). Their device is formed of an array of electrodes on the bottom, which is aligned with an array of electrodes on the top of the channel. Since the particles are repelled by the nDEP both from the top and bottom of the channel, they are focused in the middle of the channel. As a result, they move faster and the throughput increases. Recently, 3D carbon electrodes have attracted attention.170,237–240 The low cost, ease of fabrication, electrochemical stability (compared to gold and platinum), and lower chance of electrolyzing, along with the excellent biocompatibility are among the advantages of 3D carbon electrodes.170 In a recent study, Yildizhan et al.238 used 3D carbon electrodes to separate live and dead human U937 monocyte cells. They successfully removed the dead cells while preventing the lysis of live cells.
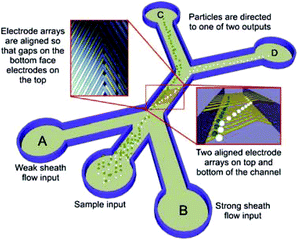 | ||
| Fig. 28 Schematic of a 3D DEP based device used for the continuous separation of colloidal particles. (Reproduced from ref. 236 with permission from John Wiley and Sons, copyright 2013.) | ||
Magnetic
Cell separation using magnetic force has been performed in several studies.241–244 Among the forces used in active cell separation methods, magnetic force is inherently similar to electric force. However, it has several advantages over electric force: (1) the magnet is not in contact with the flow; (2) usually the magnetic force does not affect the viability of the cells; and (3) the magnetic force is not affected by the surface charges, ionic strength or pH of the medium.245 This method is specific, fast, and, compared to other active methods, the required elements are less expensive.88 However, the challenge is that most cells and particles cannot inherently be manipulated by magnetic forces.245 As a result, for most of the cases, the first step for the separation involves labelling the cells (or particles) with magnetic beads, either integrated with the separation process on the same chip246 or as a preparation step.247 For this purpose, the particles are incubated with magnetic beads that are functionalized with antibodies.248 These antibodies are specific to the target cells or analytes. For example, bis-Zn-DPA binds to Gram-positive and Gram-negative bacteria,249 or the epithelial cell adhesion molecule is an antibody used for capturing CTCs of most cancers, such as breast, prostate, colon, gastric and bladder.250The magnetic field in microfluidic chips has been produced using either a permanent magnet or electromagnets microfabricated and integrated within the chip. Microfabricated electromagnets can produce a higher magnetic field gradient, which can increase the efficiency of separation. However, permanent magnets are less expensive, easier to operate and do not generate heat in the sample. In addition, the use of permanent magnets eliminates the difficulties associated with microfabrication.251 More comprehensive comparisons between the applications and benefits of electromagnetic sources or permanent magnets can be found in ref. 252.
Magnetic force can be used to separate particles in both batch,85,253–258 and continuous259–264 modes. In a batch process, first, a magnet attached to the chamber that contains the sample particles is turned on. As a result, the labelled particles are trapped in the chamber owing to the magnetic field. Then, the flow passes through the chamber and washes all the other particles. Finally, by turning off the magnet, the target particles can be released and collected. Fig. 29 shows this concept, which has been used to separate black ferromagnetic particles from white particles.257 Magnetically actuated cell sorting (MACS), which has been commercialized, is of this type. Although the cost of the batch mode is relatively low, it is time-consuming and it may lose some of the target cells.248
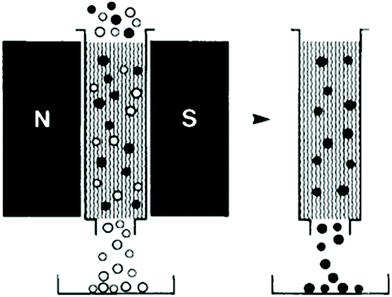 | ||
| Fig. 29 A batch separation method in which the ferromagnetic particles are trapped and can be separated from the rest of the particles. (Reproduced from ref. 257 with permission from John Wiley and Sons, copyright 1990.) | ||
Magnetic separation of particles can also be performed in continuous flow mode. In continuous mode, particles can be separated based on the magnitude of the force applied to them. The magnetic force that is applied to the particles can be calculated as:265
 | (10) |
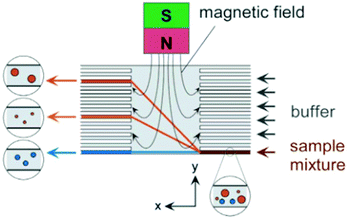 | ||
| Fig. 30 On-chip free flow magnetophoresis. This chip is capable of separating three types of cells based on their magnetic susceptibility and size. Nonmagnetic particles are not affected by the magnetic field and the larger magnetic particles experience a larger magnetic force than the smaller particles. This difference leads to a different lateral position of the particles and makes them separable. (Reprinted with permission from ref. 266, Copyright 2004, American Chemical Society.) | ||
As discussed earlier, the magnetic susceptibility difference of the particles and the medium is one of the parameters that affects the magnetic force applied to the particle. In cases where the medium is paramagnetic (χm > 0), the diamagnetic particles (χp < 0) can be separated by applying a magnetic field.261,267 The nonmagnetic particles in a magnetic solution are pushed towards the weaker magnetic field, which is referred to as negative magnetophoresis.251 Tarn et al.267 separated 5 μm and 10 μm diamagnetic particles in a paramagnetic solution. They discovered that the particles are repelled in different lateral velocities, depending on the size and the diamagnetic susceptibility. A combination of negative and positive magnetophoresis was used by Zhu et al.268 to separate not only magnetic and nonmagnetic particles, but also particles with different magnetization.
The continuous separation of magnetic particles is not limited to on-chip free flow magnetophoresis. Several methods have been developed for the continuous separation of magnetic particles.263,269–275 Adams et al.269 developed a method referred to as a multitarget magnetic activated cell sorter (MT-MACS). In this method, ferromagnetic strips (microfabricated on the channel substrate) manipulate the particles. The combined effects of the magnetic and hydrodynamic forces must accurately be adjusted such that each type of particle is directed to a specific outlet. This method was proven to be capable of separating multiple magnetic particles with more than 90% purity with a throughput of 109 cells per hour. Lee et al.276 also used ferromagnetic wires on a glass substrate to separate RNA from human blood lysate. Their results demonstrated that their method can separate more than 80% of the magnetic beads attached to the RNA. Lee et al.249 separated Escherichia coli from bovine whole blood. They used magnetic nanoparticles modified with markers specific to Escherichia coli. Using several microfluidic devices in series, they achieved almost 100% separation of magnetic nanoparticles with a throughput of 60 mL h−1.
To manipulate the cells using magnetic force, the magnetic susceptibility of most of the cells must be changed by labelling them with paramagnetic particles; however, several studies have shown the use of label-free methods to separate certain particles using magnetic forces.263,273,277–281 As an example, label-free separation of RBCs and WBCs from whole blood has been demonstrated using magnetic forces in ref. 241, 273, 277, 279 and 280. For instance, Han and Frazier241 designed a magnetophoretic microseparator, which can be seen in Fig. 31, for separating RBCs and WBCs from whole blood using their inherent magnetic properties. They modelled the device theoretically and verified it by comparing the results with numerical results, which were obtained using a finite element model. This theoretical model was used to estimate the magnetic field of the microseparator prior to the design process. Nam et al.282 also used magnetic fields to separate malaria-infected RBCs from healthy RBCs. They achieved a recovery rate of 98.3% for the late-stage infected RBCs. However, since the early-stage infected RBCs have lower paramagnetic characteristics, their recovery rate was 73%.
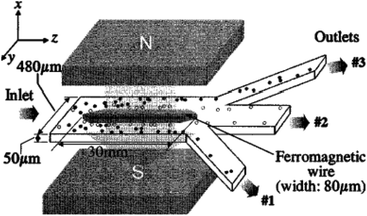 | ||
| Fig. 31 A magnetophoretic-based device for the separation of blood cells. By applying a magnetic field, RBCs are repelled from the ferromagnetic wire while the WBCs are drawn closer. (Reprinted from ref. 241, with the permission of AIP Publishing, copyright 2004.) | ||
Optical
The manipulation of cells and particles using optical force has gained significant attention since 1986, when Ashkin et al.283 used optical tweezers for trapping dielectric particles. The main advantage of this method is that even though the applied force is strong enough to manipulate the cells, it does not have harmful effects on them.284 Particles in the range of nanometre to micrometre diameters have been manipulated using optical force.285 This force can separate particles according to their size, shape, refractive index and polarizability.245,248,286 The changes in the light absorbance or beam direction owing to the presence of an object illustrates the collision between the object and the photons. Some or all of the momentum of the photons can be transferred to the object depending on the type of collision.287 Hence, light can apply forces to the particles, which can be used as a method for particle manipulation. The most popular method based on optical forces is the single beam optical trap, which is known as optical tweezers.288 The optical tweezers use a normal Gaussian laser beam to manipulate particles. When a light beam is exposed to a particle, two types of forces affect the particle: (1) a scattering force along the direction of the beam, and (2) a gradient force, which is perpendicular to the direction of the beam. The latter pushes the particles towards the high-intensity region of the beam.288–290In some studies, the target particles are first recognized by image processing based on different properties, such as size291,292 or fluorescence radiation.284,291,293 For this purpose, a sheath flow is first used to align all the cells or particles for analysis. After the target particle is recognized, optical tweezers are used to manipulate it to the target outlet. Fig. 32 presents an example of such a device working based on this concept. This device has been used for sorting mammalian cells.294 Enger et al.295 also used this method to separate yeast cells from E. coli bacteria, which were marked with fluorescent markers.
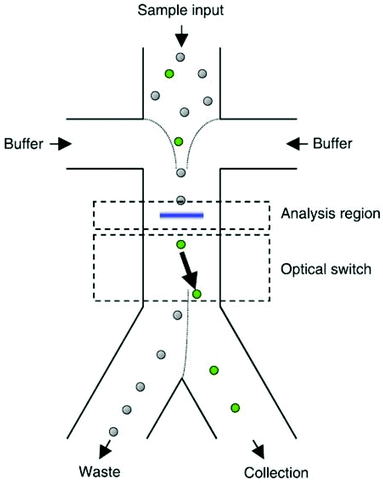 | ||
| Fig. 32 Sheath flow is used to focus the cells in the middle of the channel. As a result, the cells can be recognized and, if needed, pushed to the collection outlet using optical forces. (With the permission of AIP Publishing,294 copyright 2004.) | ||
Wang et al.291 used image processing to recognize the target cells according to multiple features, such as the size of the cells and their fluorescent label. After recognizing the target cells, the optical tweezers were used to move them to the target outlet and separate them from the rest of the solution. Using several optical tweezers, they eliminated the need for single cell flow focusing, which resulted in much higher throughput of the system. A schematic of their chip is shown in Fig. 33. Landenberger et al.284 used the same concept to separate yeast cells based on their size and fluorescent label. Their device can separate yeast cells with a recovery rate of 95% and a throughput of 1.4 cells per second. Despite the high viability, recovery and purity rate of optical tweezers, this method is not suitable for separation of large populations of particles.
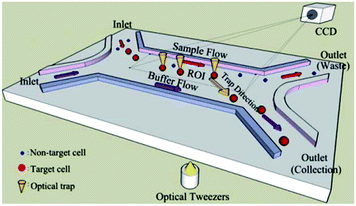 | ||
| Fig. 33 Schematic of optical tweezers. First, the particles are recognized by image processing. Then, the target particles are moved towards the target outlet to be collected. (Reproduced from ref. 291 with permission of The Royal Society of Chemistry, copyright 2011.) | ||
Hybrid systems
So far, different active and passive methods for cell separation on a microchip have been reviewed. Active methods have more control over the separation process, can be tuned in real time,296 and are more reliable. However, the response time of cells towards the external field in the active methods is not as high as desired. This slow response time results in low throughput in such methods. On the other hand, passive methods can handle higher flow rates, are easy to parallelize, and do not depend on any external forces. However, their operational range is limited owing to their fixed geometry and design. Despite some methods that rely on stiffness59 or surface biomarkers297 of the cells, most of the passive methods are size dependent and cannot separate cells that are of the same size. Hence, there is a growing trend in the use of hybrid systems to take advantage of both methods, achieving high throughput (without affecting cell viability), efficiency, sensitivity and the capability of multiparameter separation (e.g., based on both size and electrical properties of the cells). Although most of the hybrid devices use a combination of active and passive methods,298 there are still some hybrid devices that only use active methods299,300 or passive methods.301Magnetic-based methods have been combined with different passive269,302–308 and active methods.299,300 As one of the earliest magnetophoresis-assisted techniques, Seo et al.302 combined magnetophoresis and hydrodynamics to increase the throughput of blood cell separation. By comparing their results to those obtained by other researchers,37,309,310 they showed that they could increase the throughput up to 100 times and reach a 1 mL min−1 flow rate. They achieved a separation efficiency of 86.8% for RBCs and 70.9% for WBCs. Mizuno et al.303 combined magnetophoresis and hydrodynamic filtration to sort JM cells (human lymphocyte cell line) based on two factors: size and surface marker. First, the hydrodynamic filter sorts the cells according to their sizes into two groups, and then each one of the groups is sorted based on their magnetic marker. Purification ratios of higher than 90% are achieved using this design. In the majority of magnetophoresis separation techniques, first, the particles are focused on a line using the hydrodynamic effect. Then the magnetic field is applied to separate the cells that have been captured by the magnetic beads. Capturing occurs based on the affinity between the receptor on the beads and the surface biomarkers of the cells. While sheath flows are mostly used for focusing,311–313 some studies have focused the particles using a passive method (without the sheath flow).73,305–307,314,315 Several groups (e.g., Del Giudice,305 Kim et al.306 and Zhang et al.314) have exploited elasto-inertial particle focusing in a straight channel to align the particles on the centerline of the channel. After this step, the particles enter the second stage of the channel and the magnetic force is applied to move them laterally based on their size to different positions. Besides the passive methods, some active methods, such as DEP299 and acoustic,300 have been combined with magnetic force. In a study, Kim and Soh299 made an integrated dielectrophoretic–magnetically activated cell sorter to achieve efficient multitarget separation for multiple bacterial targets while avoiding cross-contamination among different outputs. This device, shown in Fig. 34, can enrich multiple bacterial target cells up to 900 fold with more than 95% purity.
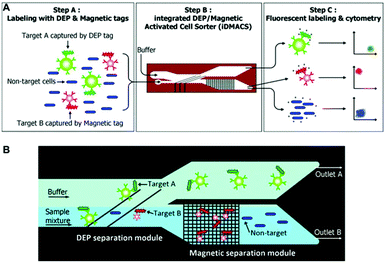 | ||
| Fig. 34 (A) Schematic of a DEP-Magnetic Activated Cell Sorter. At first, the target cells are tagged with DEP or magnetic beads. Then they enter the channel and separate from each other. Finally, they will be labelled with fluorescent beads and counted by a cytometer. (B) The cells that are labelled with DEP tags are affected by the DEP force and move to outlet A. The rest of the cells move straight to the magnetic separation module, where the magnetic tags are captured and separated from the non-target cells. (Reproduced from ref. 299 with permission of The Royal Society of Chemistry, copyright 2009.) | ||
The combination of DEP with other active techniques, such as magnetic,299 acoustic316–318 and optic,319 has been studied by several groups. Among these methods, the combination of DEP and acoustophoresis has attracted the most attention. DEP can manipulate particles with relative ease and acoustophoresis can handle higher throughputs, is less affected by the medium318 and is a long-range force (in contrast to DEP).316 In addition to these active methods, DEP has also been combined with passive methods. Among the passive methods, DLD can result in fast and very high-resolution separation but, similar to the other passive methods, it is not tunable. Hence, some groups have combined DLD and DEP to achieve a tunable separation with high resolution.114,320 Chang and Cho320 even eliminated the clogging issue of DLD devices by replacing the mechanical pillars with virtual DEP pillars. Different parameters including the applied electrical voltage, flow rate, particle diameter and dielectric properties, can be adjusted to achieve the separation of particles with different sizes. Beech et al.114 simultaneously used both DEP and DLD to benefit from the best of both methods. By changing the applied AC voltage the critical diameter for separation (in DLD) of polystyrene particles can be tuned between 2 and 6 μm.
Hydrophoresis is another technique that has been used in combination with DEP.114,296,321,322 In this method, the steric interaction between particles and grooves is used for applications such as cell separation and focusing.323,324 Even though this method is powerful and robust, it has some limitations. For instance, experimental studies have shown that this method cannot manipulate particles that are smaller than half of the channel's height.97 On one hand, the channel's height must be larger than the large particles to avoid clogging, while on the other hand, it has to be smaller than twice the diameter of the small particles so they can be affected by the hydrophoretic force. Therefore, the particle size range that can be separated using this technique is limited. Moreover, the restriction made by this method on the channel's height affects the throughput. To avoid these problems, this method has been combined with DEP.114,296,321,322 Yan et al.322 developed a chip that works based on the combination of DEP and hydrophoresis. In this device, nDEP pushes the particles towards the top wall, where the particles’ interaction with the grooves is effective enough to sort the particles. This device, which is tunable and can change the lateral position of the particles by changing the applied voltage, has been used to separate blood cells from a whole blood sample with a purity of 94.2% and a yield of 16.5% at a flow rate of 10 μL min−1.
A combination of DEP and multi-orifice flow fractionation (MOFF) has been used for separation of blood samples.325 MOFF offers high throughput; however, it is size dependent and cannot function well for separating different types of cells with a similar size (e.g., separation of CTCs from WBCs). However, the combination of MOFF and DEP solves this problem. For instance, Moon et al.325 initially separated CTCs and other similar size blood cells from the rest of the blood cells using MOFF (see the device shown in Fig. 35). This way they enriched the CTCs up to 162-fold at a 126 μL min−1 flow rate. After this stage, DEP is used for precise separation of the CTCs from other cells with similar size to increase the separation efficiency. For instance, the separation efficiency of this device for WBCs and RBCs was 94.23% and 99.24%, respectively. Zhang et al.326 experimentally and numerically investigated a DEP-inertial force combined microfluidic device. Their device includes a serpentine PDMS channel on the top of a glass slide, which is patterned with interdigitated electrodes. In the serpentine channel, the vertical position of the particles can be adjusted by nDEP force in real time with a 3D focusing pattern.
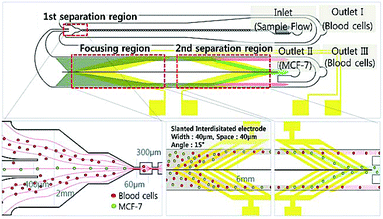 | ||
| Fig. 35 A combination of MOFF and DEP, which is used for separation of breast cancer cells (MCF-7) from blood samples. The first separation region separates larger cells, including MCF-7, from the rest. Then, the target cells enter the DEP separation chamber, where the MCF-7 cells are separated by their dielectric properties. (Reproduced from ref. 325 with permission of The Royal Society of Chemistry, copyright 2011.) | ||
Optical force has been shown to be capable of increasing the separation resolution of particles when combined with pinched flow fractionation (PFF). For example, a study327 has shown that the combination of PFF and optical forces can enhance the lateral distance of the separated particles by a factor of 15. In essence, the optical force manipulates particles in the pinched segment, shown in Fig. 36, in such a way that the particles are pushed away from the wall of the channel. Since the center of mass of small particles is already close to the wall and hence affected less by the optical force, the lateral distance between the particles with different sizes will be larger in the pinched segment than the conventional PFF systems. This distance will be further amplified in the broadened segment, resulting in a higher efficiency of separation.
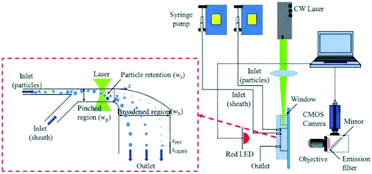 | ||
| Fig. 36 A design combining pinched flow and optical force to increase the lateral distance of particles. (Reproduced from ref. 132 with permission of The Royal Society of Chemistry, copyright 2011.) | ||
Although optical force provides a very precise means of particle manipulation, its range of operation is limited. In order to achieve large-scale trapping of particles, Thalhammer et al.328 combined optical tweezers and acoustic waves. This device has been used for sorting and trapping of particles as large as 75 μm. The acoustic wave method has been combined with magnetic field,300 electric field316–318 and optical force.328 A more detailed review of the combination of acoustic force with other force fields can be found in ref. 329.
Commercialization
Well-established technologies such as fluorescence-activated cell sorting (FACS) and magnetic activated cell sorting (MACS) are still the routine clinical cell sorting methods. Despite the advantages of FACS and MACS, i.e., high throughput and high separation efficiency, these methods require expensive and large equipment. As a result, a handful of companies are working on commercialization of microfluidics-based cell-sorting devices to address this market gap. Shields et al.330 have reviewed some of these products. In addition to those listed in ref. 330, a number of commercialized products are reported in Table 1. These microfluidics-based products are widely used for CTC isolation. ApoStream® operates based on positive dielectrophoresis to enrich CTCs in a label-free process with a high recovery and purity rate. Vortex technology has been implemented by Vortex BIOSCIENCES to isolate CTCs from whole blood samples with 800 μL min−1 throughput. Microfiltration is another method that is used for the isolation of CTCs by Cellsievo and VyCAP. Microfluidics offers advantages such as low sample and reagent volume, low fabrication cost, low energy consumption, excellent control over the cells, and high separation efficiency. However, there are still barriers on the road to commercialization of these systems. Shields et al.330 have categorized these barriers into device-related and commercialization-related challenges. The device-related issues include the need for bulky components (such as syringe pumps or microscope stations), the complexity of operating such components for the user, difficulties fabricating some components in bulk (e.g. PDMS), and the short lifespan of these devices (compared to macroscale devices) owing to bubbles, reagent/buffer residues, and cell debris aggregation. The commercialization barriers include saturation of microfluidic-related patents, slow transition of the market from benchtop to commercialization, and limited investment opportunities.| Product | Mechanism | Application | Throughput |
|---|---|---|---|
| ApoStream technology platform | Dielectrophoretic field flow fractionation | Isolation of rare cells including circulating tumour cells (CTCs), stem cells, progenitor cells and differentiated immune cells (such as CAR-T cells, activated T cells, and immune cell populations for immuno-oncology applications) | 15 mL h−1 |
| Vortex bioscience | Vortex | Isolation of CTCs | More than 8 mL h−1 for 10× diluted blood and 800 μL min−1 for whole blood331 |
| Cellsievo | Filtration (microsieve) | Capturing CTCs | NA |
| VyCAP | Filtration | Enumeration and isolation of rare cells | Recovery rate of up to 50% for single cell isolation |
Conclusion
Since the advent of microfabrication techniques, lab-on-a-chip devices have advanced the field of cell separation and rare cell isolation. The main challenges associated with the current conventional macroscale methods are obviated at microscale owing to the laminar flow conditions, simplicity and low fabrication costs. Such advantages have led the microfluidic devices to benefit from high controllability over the cells and particles, and thereby a higher separation efficiency. These devices also enhance the viability of the separated cells owing to the lower shear stresses applied to the cells during the separation process. Besides, the microfluidic approach consumes lower sample and reagent volumes, and hence there is a lower risk of contamination. Despite the promising advantages provided by microfluidic devices, more efforts are required to further improve the cell viability, recovery and purity rates, and throughput of such devices. On the other hand, lack of repeatability in the reported experimental results have inhibited the researchers to gain a consistent insight into characterization, and hence commercialization of such devices. Therefore, standardization of the experiments is essential and needs to be addressed in future studies. Moreover, the current focus on research outcomes of cell-sorting devices neglects commercialization needs. Implementing more user-friendly interfaces, eliminating the need for bulky instruments (such as syringe pumps), working on disposable chips to avoid cross-contamination and accumulated debris, developing reliable methods to avoid problems such as bubble formation, and, last but not least, earning customers’ trust in emerging microfluidic technologies could drastically enhance the practicality of cell-sorting technologies. With the current advances made towards the performance of conventional macroscale techniques, microfluidic devices need to be able to answer new questions in medicine or biology to have a viable market.It is worth noting that the ongoing research in this field is mostly on either active or passive methods; however, in light of combined configurations of microfluidic devices, hybrid systems have been developed to take advantage of both techniques. In this way, combinations of external fields and inertial forces are separately or simultaneously employed to purify cell populations. For instance, hydrodynamic-based methods can first be used to decrease the sample volume, and thereafter an active method can be used to increase purity in a more accurate but lower throughput way. Although the aforementioned techniques still need to be improved, especially in terms of throughput and efficiency, they hold promise for a variety of applications in disease diagnosis and cell-based studies. The future of these hybrid systems is dependent on addressing the challenges inherent in such systems. The first challenge is the standardization and assembly of the actuation and sensing/control systems, capable of operating multiple active and passive systems simultaneously. Without such standardized systems, operating a hybrid separation assay will be challenging as it requires simultaneous assembly of several instruments, such as syringe pumps, power supplies, oscilloscopes and much more in a sterile environment such as a biosafety hood. In addition, throughput and processing times require further improvements, achievable through parallelization with multilayer devices or arrays of microchannels.
Conflicts of interest
There are no conflicts to declare.Acknowledgements
This work was supported by the Natural Science and Engineering Research Council (NSERC) of Canada under the Discovery Grant (Grant No. 341873). We would like to thank Mr Akpedze D. K. Afantchao for his artistic work on the Graphical Abstract.References
- Y. Cheng, X. Ye, Z. Ma, S. Xie and W. Wang, Biomicrofluidics, 2016, 10, 014118 CrossRef PubMed
.
- E. L. Jackson and H. Lu, Curr. Opin. Chem. Eng., 2013, 2, 398–404 CrossRef PubMed
.
- P. Li, Z. Mao, Z. Peng, L. Zhou, Y. Chen, P.-H. Huang, C. I. Truica, J. J. Drabick, W. S. El-Deiry and M. Dao, Proc. Natl. Acad. Sci. U. S. A., 2015, 112, 4970–4975 CrossRef CAS PubMed
.
- L. Jeanbart and M. A. Swartz, Proc. Natl. Acad. Sci. U. S. A., 2015, 112, 14467–14472 CrossRef CAS PubMed
.
- M. A. Swartz, S. Hirosue and J. A. Hubbell, Sci. Transl. Med., 2012, 4, 148rv149 Search PubMed
.
- V. Plaks, C. D. Koopman and Z. Werb, Science, 2013, 341, 1186–1188 CrossRef CAS PubMed
.
- M. Cristofanilli, G. T. Budd, M. J. Ellis, A. Stopeck, J. Matera, M. C. Miller, J. M. Reuben, G. V. Doyle, W. J. Allard and L. W. Terstappen, N. Engl. J. Med., 2004, 351, 781–791 CrossRef CAS PubMed
.
- C. Sun, Y.-P. Hsieh, S. Ma, S. Geng, Z. Cao, L. Li and C. Lu, Sci. Rep., 2017, 7, 40632 CrossRef CAS PubMed
.
- W. Huang, C.-L. Chang, N. D. Brault, O. Gur, Z. Wang, S. I. Jalal, P. S. Low, T. L. Ratliff, R. Pili and C. A. Savran, Lab Chip, 2017, 17, 415–428 RSC
.
-
W. Lee, P. Tseng and D. Di Carlo, in Microtechnology for Cell Manipulation and Sorting, Springer, 2017, pp. 1–14 Search PubMed
.
- E. Samiei, M. Tabrizian and M. Hoorfar, Lab Chip, 2016, 16, 2376–2396 RSC
.
- J. P. Lafleur, A. Jönsson, S. Senkbeil and J. P. Kutter, Biosens. Bioelectron., 2016, 76, 213–233 CrossRef CAS PubMed
.
- Y. Temiz, R. D. Lovchik, G. V. Kaigala and E. Delamarche, Microelectron. Eng., 2015, 132, 156–175 CrossRef CAS
.
- E. Samiei, G. S. Luka, H. Najjaran and M. Hoorfar, Biosens. Bioelectron., 2016, 81, 480–486 CrossRef CAS PubMed
.
-
E. Samiei and M. Hoorfar, in Miniature Fluidic Devices for Rapid Biological Detection, Springer, 2018, pp. 171–205 Search PubMed
.
- W. Hu, Z. Lu, Y. Liu, T. Chen, X. Zhou and C. M. Li, Lab Chip, 2013, 13, 1797–1802 RSC
.
- E. W. Esch, A. Bahinski and D. Huh, Nat. Rev. Drug Discovery, 2015, 14, 248–260 CrossRef CAS PubMed
.
- K.-H. Lee, J. Lee and S.-H. Lee, Lab Chip, 2015, 15, 3822–3837 RSC
.
- K. Choi, A. H. Ng, R. Fobel and A. R. Wheeler, Annu. Rev. Anal. Chem., 2012, 5, 413–440 CrossRef CAS PubMed
.
- E. Samiei and M. Hoorfar, J. Micromech. Microeng., 2015, 25, 055008 CrossRef
.
- E. Samiei, M. D. de Leon Derby, A. Van den Berg and M. Hoorfar, Lab Chip, 2017, 17, 227–234 RSC
.
- H. R. Nejad, E. Samiei, A. Ahmadi and M. Hoorfar, RSC Adv., 2015, 5, 35966–35975 RSC
.
- C.-J. Liao, C.-H. Hsieh, H.-M. Wang, W.-P. Chou, T.-K. Chiu, J.-H. Chang, A. C. Chao and M.-H. Wu, RSC Adv., 2017, 7, 29339–29349 RSC
.
- Q. D. Tran, T. F. Kong, D. Hu, Marcos and R. H. W. Lam, Lab Chip, 2016, 16, 2813–2819 RSC
.
- Z. H. Fan and D. J. Beebe, Lab Chip, 2014, 14, 12–13 RSC
.
- M. E. Warkiani, G. Guan, K. B. Luan, W. C. Lee, A. A. S. Bhagat, P. Kant Chaudhuri, D. S.-W. Tan, W. T. Lim, S. C. Lee, P. C. Y. Chen, C. T. Lim and J. Han, Lab Chip, 2014, 14, 128–137 RSC
.
- S. Zheng, H. Lin, J.-Q. Liu, M. Balic, R. Datar, R. J. Cote and Y.-C. Tai, J. Chromatogr., A, 2007, 1162, 154–161 CrossRef CAS PubMed
.
- H. K. Lin, S. Zheng, A. J. Williams, M. Balic, S. Groshen, H. I. Scher, M. Fleisher, W. Stadler, R. H. Datar and Y.-C. Tai, Clin. Cancer Res., 2010, 16, 5011–5018 CrossRef CAS PubMed
.
- X. Li, W. Chen, G. Liu, W. Lu and J. Fu, Lab Chip, 2014, 14, 2565–2575 RSC
.
- X. Fan, C. Jia, J. Yang, G. Li, H. Mao, Q. Jin and J. Zhao, Biosens. Bioelectron., 2015, 71, 380–386 CrossRef CAS PubMed
.
- Y.-T. Kang, I. Doh and Y.-H. Cho, Biomed. Microdevices, 2015, 17, 45 CrossRef PubMed
.
- J. A. Hernández-Castro, K. Li, A. Meunier, D. Juncker and T. Veres, Lab Chip, 2017, 17, 1960–1969 RSC
.
-
S. Rawal, Z. Ao, R. H. Datar and A. Agarwal, in Circulating Tumor Cells, Springer, 2017, pp. 93–105 Search PubMed
.
- Y. J. Kim, Y.-T. Kang and Y.-H. Cho, Anal. Chem., 2016, 88, 7938–7945 CrossRef CAS PubMed
.
- T. F. Didar, K. Li, T. Veres and M. Tabrizian, Biomaterials, 2013, 34, 5588–5593 CrossRef CAS PubMed
.
- J. Alvankarian, A. Bahadorimehr and B. Y. Majlis, Biomicrofluidics, 2013, 7, 014102 CrossRef PubMed
.
- X. Chen, C. C. Liu and H. Li, Sens. Actuators, B, 2008, 130, 216–221 CrossRef CAS
.
- N. J. Panaro, X. J. Lou, P. Fortina, L. J. Kricka and P. Wilding, Biomol. Eng., 2005, 21, 157–162 CrossRef CAS PubMed
.
- I. Doh, H.-I. Yoo, Y.-H. Cho, J. Lee, H. Kwan Kim and J. Kim, Appl. Phys. Lett., 2012, 101, 043701 CrossRef
.
- Y.-T. Kang, I. Doh, J. Byun, H. J. Chang and Y.-H. Cho, Theranostics, 2017, 7, 3179 CrossRef CAS PubMed
.
- C.-C. Wu, L.-Z. Hong and C.-T. Ou, J. Med. Biol. Eng., 2012, 32, 163–168 CrossRef
.
- P. Wilding, L. J. Kricka, J. Cheng, G. Hvichia, M. A. Shoffner and P. Fortina, Anal. Biochem., 1998, 257, 95–100 CrossRef CAS PubMed
.
- T. A. Crowley and V. Pizziconi, Lab Chip, 2005, 5, 922–929 RSC
.
- G. Stemme and G. Kittilsland, Appl. Phys. Lett., 1988, 53, 1566–1568 CrossRef CAS
.
- G. Kittilsland, G. Stemme and B. Nordén, Sens. Actuators, A, 1990, 23, 904–907 CrossRef
.
- Y. Gu and N. Miki, J. Micromech. Microeng., 2007, 17, 2308 CrossRef CAS
.
- J. Moorthy and D. J. Beebe, Lab Chip, 2003, 3, 62–66 RSC
.
- K. Aran, A. Fok, L. A. Sasso, N. Kamdar, Y. Guan, Q. Sun, A. Ündar and J. D. Zahn, Lab Chip, 2011, 11, 2858–2868 RSC
.
- P. Sajeesh and A. K. Sen, Microfluid. Nanofluid., 2014, 17, 1–52 CrossRef
.
- H. M. Ji, V. Samper, Y. Chen, C. K. Heng, T. M. Lim and L. Yobas, Biomed. Microdevices, 2008, 10, 251–257 CrossRef PubMed
.
- Y.-Y. Chiu, C.-K. Huang and Y.-W. Lu, Biomicrofluidics, 2016, 10, 011906 CrossRef PubMed
.
- J. Chen, D. Chen, T. Yuan, X. Chen, Y. Xie, H. Fu, D. Cui, X. Fan and M. K. K. Oo, Microelectron. Eng., 2014, 128, 36–41 CrossRef CAS
.
- Y. Yoon, S. Kim, J. Lee, J. Choi, R.-K. Kim, S.-J. Lee, O. Sul and S.-B. Lee, Sci. Rep., 2016, 6, 26531 CrossRef CAS PubMed
.
- W. Zhang, K. Kai, D. S. Choi, T. Iwamoto, Y. H. Nguyen, H. Wong, M. D. Landis, N. T. Ueno, J. Chang and L. Qin, Proc. Natl. Acad. Sci. U. S. A., 2012, 201209893 Search PubMed
.
- G. Wang, K. Crawford, C. Turbyfield, W. Lam, A. Alexeev and T. Sulchek, Lab Chip, 2015, 15, 532–540 RSC
.
- H. W. Hou, A. A. S. Bhagat, A. G. L. Chong, P. Mao, K. S. W. Tan, J. Han and C. T. Lim, Lab Chip, 2010, 10, 2605–2613 RSC
.
- G. Wang, W. Mao, R. Byler, K. Patel, C. Henegar, A. Alexeev and T. Sulchek, PLoS One, 2013, 8, e75901 CrossRef CAS PubMed
.
- M. Islam, H. Brink, S. Blanche, C. DiPrete, T. Bongiorno, N. Stone, A. Liu, A. Philip, G. Wang and W. Lam, Sci. Rep., 2017, 7, 1997 CrossRef PubMed
.
- M. Islam, R. Mezencev, B. McFarland, H. Brink, B. Campbell, B. Tasadduq, E. K. Waller, W. Lam, A. Alexeev and T. Sulchek, Cell Death Dis., 2018, 9, 239 CrossRef PubMed
.
- G. Segre, Nature, 1961, 189, 209–210 CrossRef
.
- P. Saffman, J. Fluid Mech., 1965, 22, 385–400 CrossRef
.
- B. Ho and L. Leal, J. Fluid Mech., 1974, 65, 365–400 CrossRef
.
- D. Di Carlo, D. Irimia, R. G. Tompkins and M. Toner, Proc. Natl. Acad. Sci. U. S. A., 2007, 104, 18892–18897 CrossRef CAS PubMed
.
- E. S. Asmolov, J. Fluid Mech., 1999, 381, 63–87 CrossRef CAS
.
- S. C. Hur, N. K. Henderson-MacLennan, E. R. McCabe and D. Di Carlo, Lab Chip, 2011, 11, 912–920 RSC
.
- D. Di Carlo, J. F. Edd, D. Irimia, R. G. Tompkins and M. Toner, Anal. Chem., 2008, 80, 2204–2211 CrossRef CAS PubMed
.
- J. He, M. Huang, D. Wang, Z. Zhang and G. Li, J. Pharm. Biomed. Anal., 2014, 101, 84–101 CrossRef CAS PubMed
.
- X. Lu and X. Xuan, Anal. Chem., 2015, 87, 6389–6396 CrossRef CAS PubMed
.
- J. Zhang, S. Yan, W. Li, G. Alici and N.-T. Nguyen, RSC Adv., 2014, 4, 33149–33159 RSC
.
- E. Sollier, H. Amini, D. E. Go, P. A. Sandoz, K. Owsley and D. Di Carlo, Microfluid. Nanofluid., 2015, 19, 53–65 CrossRef CAS
.
- S. W. Ahn, S. S. Lee, S. J. Lee and J. M. Kim, Chem. Eng. Sci., 2015, 126, 237–243 CrossRef CAS
.
- J.-S. Park, S.-H. Song and H.-I. Jung, Lab Chip, 2009, 9, 939–948 RSC
.
- E. Ozkumur, A. M. Shah, J. C. Ciciliano, B. L. Emmink, D. T. Miyamoto, E. Brachtel, M. Yu, P.-I. Chen, B. Morgan and J. Trautwein, Sci. Transl. Med., 2013, 5, 179ra147 Search PubMed
.
- J. Oakey, R. W. Applegate Jr., E. Arellano, D. D. Carlo, S. W. Graves and M. Toner, Anal. Chem., 2010, 82, 3862–3867 CrossRef CAS PubMed
.
- E. W. Kemna, R. M. Schoeman, F. Wolbers, I. Vermes, D. A. Weitz and A. van den Berg, Lab Chip, 2012, 12, 2881–2887 RSC
.
- H. W. Hou, M. E. Warkiani, B. L. Khoo, Z. R. Li, R. A. Soo, D. S.-W. Tan, W.-T. Lim, J. Han, A. A. S. Bhagat and C. T. Lim, Sci. Rep., 2013, 3, 1259 CrossRef PubMed
.
- T. H. Kim, H. J. Yoon, P. Stella and S. Nagrath, Biomicrofluidics, 2014, 8, 064117 CrossRef PubMed
.
- J. M. Burke, R. E. Zubajlo, E. Smela and I. M. White, Biomicrofluidics, 2014, 8, 024105 CrossRef PubMed
.
- S. S. Kuntaegowdanahalli, A. A. S. Bhagat, G. Kumar and I. Papautsky, Lab Chip, 2009, 9, 2973–2980 RSC
.
- M. Robinson, H. Marks and G. L. Coté, Comparison of production methods of a spiral inertial microfluidic cell separation device, 2016 Search PubMed.
- A. Kulasinghe, T. H. P. Tran, T. Blick, K. O'Byrne, E. W. Thompson, M. E. Warkiani, C. Nelson, L. Kenny and C. Punyadeera, Sci. Rep., 2017, 7, 42517 CrossRef CAS PubMed
.
- S. Shen, C. Tian, T. Li, J. Xu, S.-W. Chen, Q. Tu, M.-S. Yuan, W. Liu and J. Wang, Lab Chip, 2017, 17, 3578–3591 RSC
.
- L. M. Lee, J. M. Rosano, Y. Wang, G. Klarmann, C. J. Garson, B. Prabhakarpandian, K. Pant, L. M. Alvarez and E. Lai, Anal. Methods, 2018, 10, 713–721 RSC
.
- B. C. Syverud, E. Lin, S. Nagrath and L. M. Larkin, Tissue Eng., Part C, 2018, 24, 32–41 CrossRef CAS PubMed
.
- B. Kwak, J. Lee, J. Lee, H. S. Kim, S. Kang and Y. Lee, Biosens. Bioelectron., 2018, 101, 311–316 CrossRef CAS PubMed
.
- H. Song, J. M. Rosano, Y. Wang, C. J. Garson, B. Prabhakarpandian, K. Pant, G. J. Klarmann, L. M. Alvarez and E. Lai, Microfluid. Nanofluid., 2017, 21, 64 CrossRef
.
- M. Rafeie, J. Zhang, M. Asadnia, W. Li and M. E. Warkiani, Lab Chip, 2016, 16, 2791–2802 RSC
.
- S. Shen, C. Ma, L. Zhao, Y. Wang, J.-C. Wang, J. Xu, T. Li, L. Pang and J. Wang, Lab Chip, 2014, 14, 2525–2538 RSC
.
- J.-S. Park and H.-I. Jung, Anal. Chem., 2009, 81, 8280–8288 CrossRef CAS PubMed
.
- Z. Wu, Y. Chen, M. Wang and A. J. Chung, Lab Chip, 2016, 16, 532–542 RSC
.
- M. G. Lee, S. Choi and J.-K. Park, J. Chromatogr., A, 2011, 1218, 4138–4143 CrossRef CAS PubMed
.
- Q. Zhao, D. Yuan, S. Yan, J. Zhang, H. Du, G. Alici and W. Li, Microfluid. Nanofluid., 2017, 21, 55 CrossRef
.
- Q. Zhao, J. Zhang, S. Yan, D. Yuan, H. Du, G. Alici and W. Li, Sci. Rep., 2017, 7, 41153 CrossRef CAS PubMed
.
- A. J. Chung, D. R. Gossett and D. Di Carlo, Small, 2013, 9, 685–690 CrossRef CAS PubMed
.
- J. Zhang, S. Yan, R. Sluyter, W. Li, G. Alici and N.-T. Nguyen, Sci. Rep., 2014, 4, 4527 CrossRef PubMed
.
- T. Jin, S. Yan, J. Zhang, D. Yuan, X.-F. Huang and W. Li, Biomicrofluidics, 2016, 10, 034104 CrossRef PubMed
.
- S. Choi, S. Song, C. Choi and J.-K. Park, Anal. Chem., 2008, 81, 50–55 CrossRef PubMed
.
- M. Dhar, J. Wong, A. Karimi, J. Che, C. Renier, M. Matsumoto, M. Triboulet, E. B. Garon, J. W. Goldman and M. B. Rettig, Biomicrofluidics, 2015, 9, 064116 CrossRef PubMed
.
- P. Paiè, J. Che and D. Di Carlo, Microfluid. Nanofluid., 2017, 21, 104 CrossRef
.
- A. J. Mach, J. H. Kim, A. Arshi, S. C. Hur and D. Di Carlo, Lab Chip, 2011, 11, 2827–2834 RSC
.
- J. Che, V. Yu, E. B. Garon, J. W. Goldman and D. Di Carlo, Lab Chip, 2017, 17, 1452–1461 RSC
.
- C. A. Lemaire, S. Z. Liu, C. L. Wilkerson, V. C. Ramani, N. A. Barzanian, K.-W. Huang, J. Che, M. W. Chiu, M. Vuppalapaty and A. M. Dimmick, SLAS Technol., 2018, 23, 16–29 Search PubMed
.
- H. Haddadi, H. Naghsh-Nilchi and D. Di Carlo, Biomicrofluidics, 2018, 12, 014112 CrossRef PubMed
.
- L. R. Huang, E. C. Cox, R. H. Austin and J. C. Sturm, Science, 2004, 304, 987–990 CrossRef CAS PubMed
.
- Z. Liu, F. Huang, J. Du, W. Shu, H. Feng, X. Xu and Y. Chen, Biomicrofluidics, 2013, 7, 011801 CrossRef PubMed
.
- K. Loutherback, J. D'Silva, L. Liu, A. Wu, R. H. Austin and J. C. Sturm, AIP Adv., 2012, 2, 042107 CrossRef PubMed
.
- H. Okano, T. Konishi, T. Suzuki, T. Suzuki, S. Ariyasu, S. Aoki, R. Abe and M. Hayase, Biomed. Microdevices, 2015, 17, 59 CrossRef PubMed
.
- N. Tottori, T. Nisisako, J. Park, Y. Yanagida and T. Hatsuzawa, Biomicrofluidics, 2016, 10, 014125 CrossRef
.
- C. I. Civin, T. Ward, A. M. Skelley, K. Gandhi, Z. Peilun Lee, C. R. Dosier, J. L. D'Silva, Y. Chen, M. Kim and J. Moynihan, Cytometry, Part A, 2016, 89, 1073–1083 CrossRef PubMed
.
- K. K. Zeming, T. Salafi, C.-H. Chen and Y. Zhang, Sci. Rep., 2016, 6, 22934 CrossRef CAS PubMed
.
- T. Krüger, D. Holmes and P. V. Coveney, Biomicrofluidics, 2014, 8, 054114 CrossRef PubMed
.
- J. McGrath, M. Jimenez and H. Bridle, Lab Chip, 2014, 14, 4139–4158 RSC
.
- D. W. Inglis, J. A. Davis, R. H. Austin and J. C. Sturm, Lab Chip, 2006, 6, 655–658 RSC
.
- J. P. Beech, P. Jönsson and J. O. Tegenfeldt, Lab Chip, 2009, 9, 2698–2706 RSC
.
- D. W. Inglis, N. Herman and G. Vesey, Biomicrofluidics, 2010, 4, 024109 CrossRef PubMed
.
- J. P. Beech, S. H. Holm, K. Adolfsson and J. O. Tegenfeldt, Lab Chip, 2012, 12, 1048–1051 RSC
.
- Z. Zhang, E. Henry, G. Gompper and D. A. Fedosov, J. Chem. Phys., 2015, 143, 243145 CrossRef PubMed
.
- J.-C. Hyun, J. Hyun, S. Wang and S. Yang, Sep. Purif. Technol., 2017, 172, 258–267 CrossRef CAS
.
- Y. S. Lubbersen, M. A. I. Schutyser and R. M. Boom, Chem. Eng. Sci., 2012, 73, 314–320 CrossRef CAS
.
- J. D'Silva, R. H. Austin and J. C. Sturm, Lab Chip, 2015, 15, 2240–2247 RSC
.
- K. Loutherback, K. S. Chou, J. Newman, J. Puchalla, R. H. Austin and J. C. Sturm, Microfluid. Nanofluid., 2010, 9, 1143–1149 CrossRef
.
-
J. Beech, MSc, Lund University, 2005
.
- D. W. Inglis, K. J. Morton, J. A. Davis, T. J. Zieziulewicz, D. A. Lawrence, R. H. Austin and J. C. Sturm, Lab Chip, 2008, 8, 925–931 RSC
.
- M. Al-Fandi, M. Al-Rousan, M. A. Jaradat and L. Al-Ebbini, Robotics and Computer-Integrated Manufacturing, 2011, 27, 237–244 CrossRef
.
- K. K. Zeming, S. Ranjan and Y. Zhang, Nat. Commun., 2013, 4, 1625 CrossRef PubMed
.
- S. H. Au, J. Edd, A. E. Stoddard, K. H. Wong, F. Fachin, S. Maheswaran, D. A. Haber, S. L. Stott, R. Kapur and M. Toner, Sci. Rep., 2017, 7, 2433 CrossRef PubMed
.
- M. Yamada, M. Nakashima and M. Seki, Anal. Chem., 2004, 76, 5465–5471 CrossRef CAS PubMed
.
- J. Takagi, M. Yamada, M. Yasuda and M. Seki, Lab Chip, 2005, 5, 778–784 RSC
.
- Y. Sai, M. Yamada, M. Yasuda and M. Seki, J. Chromatogr., A, 2006, 1127, 214–220 CrossRef CAS PubMed
.
- A. Jain and J. D. Posner, Anal. Chem., 2008, 80, 1641–1648 CrossRef CAS PubMed
.
- A. L. Vig and A. Kristensen, Appl. Phys. Lett., 2008, 93, 203507 CrossRef
.
- K. H. Lee, S. B. Kim, K. S. Lee and H. J. Sung, Lab Chip, 2011, 11, 354–357 RSC
.
- T. Morijiri, S. Sunahiro, M. Senaha, M. Yamada and M. Seki, Microfluid. Nanofluid., 2011, 11, 105–110 CrossRef
.
- X. Lu, J.-P. Hsu and X. Xuan, Langmuir, 2014, 31, 620–627 CrossRef PubMed
.
- H. Khashei, H. Latifi, M. J. Seresht and A. H. B. Ghasemi, Electrophoresis, 2016, 37(5–6), 775–785 CrossRef CAS PubMed
.
- X. Lu and X. Xuan, Anal. Chem., 2015, 87, 4560–4565 CrossRef CAS PubMed
.
- T. Laurell, F. Petersson and A. Nilsson, Chem. Soc. Rev., 2007, 36, 492–506 RSC
.
- J. Shi, H. Huang, Z. Stratton, Y. Huang and T. J. Huang, Lab Chip, 2009, 9, 3354–3359 RSC
.
- Y. Chen, M. Wu, L. Ren, J. Liu, P. H. Whitley, L. Wang and T. J. Huang, Lab Chip, 2016, 16, 3466–3472 RSC
.
- J. Nam, H. Lim, C. Kim, J. Y. Kang and S. Shin, Biomicrofluidics, 2012, 6, 024120 CrossRef PubMed
.
- S. Gupta, D. L. Feke and I. Manas-Zloczower, Chem. Eng. Sci., 1995, 50, 3275–3284 CrossRef CAS
.
- F. Petersson, L. Åberg, A.-M. Swärd-Nilsson and T. Laurell, Anal. Chem., 2007, 79, 5117–5123 CrossRef CAS PubMed
.
- F. Petersson, A. Nilsson, C. Holm, H. Jönsson and T. Laurell, Analyst, 2004, 129, 938–943 RSC
.
- D. A. Johnson and D. L. Feke, Sep. Technol., 1995, 5, 251–258 CrossRef CAS
.
- M. Kumar, D. L. Feke and J. M. Belovich, Biotechnol. Bioeng., 2005, 89, 129 CrossRef CAS PubMed
.
- J. D. Adams and H. T. Soh, Appl. Phys. Lett., 2010, 97, 064103 CrossRef PubMed
.
- Z. Ma, D. J. Collins, J. Guo and Y. Ai, Anal. Chem., 2016, 17, 1332–1339 Search PubMed
.
- M. Nordin and T. Laurell, Lab Chip, 2012, 12, 4610–4616 RSC
.
- J. Shi, X. Mao, D. Ahmed, A. Colletti and T. J. Huang, Lab Chip, 2008, 8, 221–223 RSC
.
- X. Ding, P. Li, S.-C. S. Lin, Z. S. Stratton, N. Nama, F. Guo, D. Slotcavage, X. Mao, J. Shi and F. Costanzo, Lab Chip, 2013, 13, 3626–3649 RSC
.
- X. Ding, Z. Peng, S.-C. S. Lin, M. Geri, S. Li, P. Li, Y. Chen, M. Dao, S. Suresh and T. J. Huang, Proc. Natl. Acad. Sci. U. S. A., 2014, 111, 12992–12997 CrossRef CAS PubMed
.
- J. Nam, H. Lim, D. Kim and S. Shin, Lab Chip, 2011, 11, 3361–3364 RSC
.
- J. Nam, H. Lim, C. Kim, J. Yoon Kang and S. Shin, Biomicrofluidics, 2012, 6, 024120 CrossRef PubMed
.
- G. Destgeer, A. Alazzam and H. J. Sung, J. Mech. Sci. Technol., 2016, 30, 3945–3952 CrossRef
.
- G. Destgeer, B. H. Ha, J. H. Jung and H. J. Sung, Lab Chip, 2014, 14, 4665–4672 RSC
.
- J. Behrens, S. Langelier, A. R. Rezk, G. Lindner, L. Y. Yeo and J. R. Friend, Lab Chip, 2015, 15, 43–46 RSC
.
- Z. Ma, D. J. Collins, J. Guo and Y. Ai, Anal. Chem., 2016, 88, 11844–11851 CrossRef CAS PubMed
.
- W. Ung, K. Mutafopulos, P. Spink, R. W. Rambach, T. Franke and D. A. Weitz, Lab Chip, 2017, 17, 4059–4069 RSC
.
- K. Park, J. Park, J. H. Jung, G. Destgeer, H. Ahmed and H. J. Sung, Biomicrofluidics, 2017, 11, 064112 CrossRef PubMed
.
- J. Nam, Y. Lee and S. Shin, Microfluid. Nanofluid., 2011, 11, 317–326 CrossRef CAS
.
- Y. Ai, C. K. Sanders and B. L. Marrone, Anal. Chem., 2013, 85, 9126–9134 CrossRef CAS PubMed
.
- Z. Ma, D. J. Collins, J. Guo and Y. Ai, Anal. Chem., 2016, 88(10), 5513–5522 CrossRef PubMed
.
- G. Destgeer, K. H. Lee, J. H. Jung, A. Alazzam and H. J. Sung, Lab Chip, 2013, 13, 4210–4216 RSC
.
- K. Wang, W. Zhou, Z. Lin, F. Cai, F. Li, J. Wu, L. Meng, L. Niu and H. Zheng, Sens. Actuators, B, 2018, 258, 1174–1183 CrossRef CAS
.
- L. Y. Yeo and J. R. Friend, Annu. Rev. Fluid Mech., 2014, 46, 379–406 CrossRef
.
- Z. Wang and J. Zhe, Lab Chip, 2011, 11, 1280–1285 RSC
.
- N. Harris, R. Boltryk, P. Glynne-Jones and M. Hill, Phys. Procedia, 2010, 3, 277–281 CrossRef CAS
.
- Y. Liu and K.-M. Lim, Lab Chip, 2011, 11, 3167–3173 RSC
.
- M. P. Hughes, Electrophoresis, 2002, 23, 2569–2582 CrossRef CAS PubMed
.
- R. Martinez-Duarte, P. Renaud and M. J. Madou, Electrophoresis, 2011, 32, 2385–2392 CAS
.
- D. Chen, H. Du and C. Tay, Nanoscale Res. Lett., 2010, 5, 55 CrossRef CAS PubMed
.
- H. Zhu, X. Lin, Y. Su, H. Dong and J. Wu, Biosens. Bioelectron., 2015, 63, 371–378 CrossRef CAS PubMed
.
- S. Dash and S. Mohanty, Electrophoresis, 2014, 35, 2656–2672 CrossRef CAS PubMed
.
- M. P. Hughes, Biomicrofluidics, 2016, 10, 032801 CrossRef PubMed
.
- L. Chen, X.-L. Zheng, N. Hu, J. Yang, H.-Y. Luo, F. Jiang and Y.-J. Liao, Chinese J. Anal. Chem., 2015, 43, 300–309 CrossRef CAS
.
- R. Pethig, Biomicrofluidics, 2010, 4, 022811 CrossRef PubMed
.
- K. Khoshmanesh, S. Nahavandi, S. Baratchi, A. Mitchell and K. Kalantar-zadeh, Biosens. Bioelectron., 2011, 26, 1800–1814 CrossRef CAS PubMed
.
- P. Modarres and M. Tabrizian, Sens. Actuators, B, 2017, 252, 391–408 CrossRef CAS
.
- H. R. Nejad, O. Z. Chowdhury, M. D. Buat and M. Hoorfar, Lab Chip, 2013, 13, 1823–1830 RSC
.
- E. Samiei, H. Rezaei Nejad and M. Hoorfar, Appl. Phys. Lett., 2015, 106, 204101 CrossRef
.
- B. Nestor, E. Samiei, R. Samanipour, A. Gupta, A. Van den Berg, M. D. de Leon Derby, Z. Wang, H. R. Nejad, K. Kim and M. Hoorfar, RSC Adv., 2016, 6, 57409–57416 RSC
.
- D. Das, K. Biswas and S. Das, Med. Eng. Phys., 2014, 36, 726–731 CrossRef PubMed
.
- M. Alshareef, N. Metrakos, E. Juarez Perez, F. Azer, F. Yang, X. Yang and G. Wang, Biomicrofluidics, 2013, 7, 011803 CrossRef PubMed
.
- I.-F. Cheng, W.-L. Huang, T.-Y. Chen, C.-W. Liu, Y.-D. Lin and W.-C. Su, Lab Chip, 2015, 15, 2950–2959 RSC
.
- H. Song, J. M. Rosano, Y. Wang, C. J. Garson, B. Prabhakarpandian, K. Pant, G. J. Klarmann, A. Perantoni, L. M. Alvarez and E. Lai, Lab Chip, 2015, 15, 1320–1328 RSC
.
- I. Doh and Y.-H. Cho, Sens. Actuators, A, 2005, 121, 59–65 CrossRef CAS
.
- A. Alazzam, B. Mathew and F. Alhammadi, J. Sep. Sci., 2017, 40, 1193–1200 CrossRef CAS PubMed
.
- Y. Huang, X. B. Wang, F. F. Becker and P. R. Gascoyne, Biophys. J., 1997, 73, 1118–1129 CrossRef CAS PubMed
.
- M. Camarda, S. Scalese and A. La Magna, Electrophoresis, 2015, 36, 1396–1404 CrossRef CAS PubMed
.
- X.-B. Wang, J. Yang, Y. Huang, J. Vykoukal, F. F. Becker and P. R. Gascoyne, Anal. Chem., 2000, 72, 832–839 CrossRef CAS PubMed
.
- J. Yang, Y. Huang, X.-B. Wang, F. F. Becker and P. R. Gascoyne, Anal. Chem., 1999, 71, 911–918 CrossRef CAS PubMed
.
- G. H. Markx, J. Rousselet and R. Pethig, J. Liq. Chromatogr. Relat. Technol., 1997, 20, 2857–2872 CrossRef CAS
.
- H. Peng, N. T. Alvarez, C. Kittrell, R. H. Hauge and H. K. Schmidt, J. Am. Chem. Soc., 2006, 128, 8396–8397 CrossRef CAS PubMed
.
- J. Čemažar and T. Kotnik, Electrophoresis, 2012, 33, 2867–2874 CrossRef PubMed
.
- J. Yang, Y. Huang, X.-B. Wang, F. F. Becker and P. R. Gascoyne, Biophys. J., 2000, 78, 2680–2689 CrossRef CAS PubMed
.
- S. Shim, P. Gascoyne, J. Noshari and K. S. Hale, Integr. Biol., 2011, 3, 850–862 RSC
.
- J. Vykoukal, D. M. Vykoukal, S. Freyberg, E. U. Alt and P. R. Gascoyne, Lab Chip, 2008, 8, 1386–1393 RSC
.
- Y. Huang, X.-B. Wang, F. F. Becker and P. Gascoyne, Biophys. J., 1997, 73, 1118 CrossRef CAS PubMed
.
- P. R. Gascoyne, J. Noshari, T. J. Anderson and F. F. Becker, Electrophoresis, 2009, 30, 1388–1398 CrossRef CAS PubMed
.
- B. Mathew, A. Alazzam, M. Abutayeh and I. Stiharu, J. Sep. Sci., 2016, 39, 3028–3036 CrossRef CAS PubMed
.
- B. Mathew, A. Alazzam, M. Abutayeh, A. Gawanmeh and S. Khashan, Chem. Eng. Sci., 2015, 138, 266–280 CrossRef CAS
.
- N. Piacentini, G. Mernier, R. Tornay and P. Renaud, Biomicrofluidics, 2011, 5, 034122 CrossRef PubMed
.
- X.-B. Wang, J. Vykoukal, F. F. Becker and P. R. Gascoyne, Biophys. J., 1998, 74, 2689–2701 CrossRef CAS PubMed
.
- Y. Huang, J. Yang, X.-B. Wang, F. F. Becker and P. R. Gascoyne, J. Hematother. Stem Cell Res., 1999, 8, 481–490 CrossRef CAS PubMed
.
- S. Shim, K. Stemke-Hale, A. M. Tsimberidou, J. Noshari, T. E. Anderson and P. R. Gascoyne, Biomicrofluidics, 2013, 7, 011807 CrossRef PubMed
.
- M. Nikolic-Jaric, S. F. Romanuik, G. A. Ferrier, T. Cabel, E. Salimi, D. B. Levin, G. E. Bridges and D. J. Thomson, Biomicrofluidics, 2012, 6, 024117 CrossRef PubMed
.
- M. Şen, K. Ino, J. Ramón-Azcón, H. Shiku and T. Matsue, Lab Chip, 2013, 13, 3650–3652 RSC
.
- V. V. Swaminathan, M. A. Shannon and R. Bashir, Biomed. Microdevices, 2015, 17, 1–9 CrossRef CAS PubMed
.
- L. Yang, P. P. Banada, M. R. Chatni, K. S. Lim, A. K. Bhunia, M. Ladisch and R. Bashir, Lab Chip, 2006, 6, 896–905 RSC
.
- A. Hemmatifar, M. S. Saidi, A. Sadeghi and M. Sani, Microfluid. Nanofluid., 2013, 14, 265–276 CrossRef CAS
.
- M. S. Pommer, Y. Zhang, N. Keerthi, D. Chen, J. A. Thomson, C. D. Meinhart and H. T. Soh, Electrophoresis, 2008, 29, 1213–1218 CrossRef CAS PubMed
.
- K. Khoshmanesh, C. Zhang, F. J. Tovar-Lopez, S. Nahavandi, S. Baratchi, K. Kalantar-zadeh and A. Mitchell, Electrophoresis, 2009, 30, 3707–3717 CrossRef CAS PubMed
.
- K. Khoshmanesh, S. Baratchi, F. J. Tovar-Lopez, S. Nahavandi, D. Wlodkowic, A. Mitchell and K. Kalantar-Zadeh, Microfluid. Nanofluid., 2012, 12, 597–606 CrossRef CAS
.
- A. Menachery, J. Burt, S. Chappell, R. Errington, D. Morris, P. Smith, M. Wiltshire, E. Furon and R. Pethig, UNE, 2016, 13, 15 Search PubMed
.
- S.-I. Han, Y.-D. Joo and K.-H. Han, Analyst, 2013, 138, 1529–1537 RSC
.
- S. Menad, A. El-Gaddar, N. Haddour, S. Toru, M. Brun, F. O. Buret and M. Frenea-Robin, Langmuir, 2014, 30, 5686–5693 CrossRef CAS PubMed
.
- Y. Yoshimura, M. Tomita, F. Mizutani and T. Yasukawa, Anal. Chem., 2014, 86, 6818–6822 CrossRef CAS PubMed
.
- Y. Yoshimura, C. Fujii, M. Tomita, F. Mizutani and T. Yasukawa, Chem. Lett., 2014, 43, 980–981 CrossRef CAS
.
- R. Krishnan, B. D. Sullivan, R. L. Mifflin, S. C. Esener and M. J. Heller, Electrophoresis, 2008, 29, 1765–1774 CrossRef CAS PubMed
.
- F. E. Tay, L. Yu, A. J. Pang and C. Iliescu, Electrochim. Acta, 2007, 52, 2862–2868 CrossRef CAS
.
- D. Chen, H. Du and W. Li, Sens. Actuators, A, 2007, 133, 329–334 CrossRef CAS
.
- D. Chen, H. Du and W. Li, J. Micromech. Microeng., 2006, 16, 1162 CrossRef CAS
.
- S. H. Ling, Y. C. Lam and K. S. Chian, Anal. Chem., 2012, 84, 6463–6470 CrossRef CAS PubMed
.
- S. Li, M. Li, Y. S. Hui, W. Cao, W. Li and W. Wen, Microfluid. Nanofluid., 2013, 14, 499–508 CrossRef CAS
.
- V. Chaurey, A. Rohani, Y. H. Su, K. T. Liao, C. F. Chou and N. S. Swami, Electrophoresis, 2013, 34, 1097–1104 CrossRef CAS PubMed
.
- C.-H. Chiou, L.-J. Chien and J.-N. Kuo, Appl. Phys. Express, 2015, 8, 085201 CrossRef
.
- C.-H. Chiou, J.-C. Pan, L.-J. Chien, Y.-Y. Lin and J.-L. Lin, Sensors, 2013, 13, 2763–2776 CrossRef CAS PubMed
.
- G. R. Pesch, L. Kiewidt, F. Du and M. Baune, Electrophoresis, 2016, 37, 291–301 CrossRef CAS PubMed
.
- L. Shi, A. Rana and L. Esfandiari, Biophys. J., 2018, 114, 691a–692a CrossRef
.
- J. Ding, C. Woolley and M. A. Hayes, Anal. Bioanal. Chem., 2017, 409, 6405–6414 CrossRef CAS PubMed
.
- S. Soltanian-Zadeh, K. Kikkeri, A. N. Shajahan-Haq, J. Strobl, R. Clarke and M. Agah, Electrophoresis, 2017, 38, 1988–1995 CrossRef CAS PubMed
.
- H. R. Gwon, S. T. Chang, C. K. Choi, J. Y. Jung, J. M. Kim and S. H. Lee, Electrophoresis, 2014, 35, 2014–2021 CrossRef CAS PubMed
.
- H. Shafiee, M. B. Sano, E. A. Henslee, J. L. Caldwell and R. V. Davalos, Lab Chip, 2010, 10, 438–445 RSC
.
- H. Shafiee, J. L. Caldwell, M. B. Sano and R. V. Davalos, Biomed. Microdevices, 2009, 11, 997–1006 CrossRef CAS PubMed
.
- A. Rahmani, A. Mohammadi and H. R. Kalhor, Electrophoresis, 2018, 39, 445–455 CrossRef CAS PubMed
.
- N. A. M. Yunus, H. Nili and N. G. Green, Electrophoresis, 2013, 34, 969–978 CrossRef CAS PubMed
.
- R. Martinez-Duarte, F. Camacho-Alanis, P. Renaud and A. Ros, Electrophoresis, 2013, 34, 1113–1122 CrossRef CAS PubMed
.
- Y. Yildizhan, N. Erdem, M. Islam, R. Martinez-Duarte and M. Elitas, Sensors, 2017, 17, 2691 CrossRef PubMed
.
- R. Martinez-Duarte, R. A. Gorkin III, K. Abi-Samra and M. J. Madou, Lab Chip, 2010, 10, 1030–1043 RSC
.
- M. Islam, R. Natu, M. F. Larraga-Martinez and R. Martinez-Duarte, Biomicrofluidics, 2016, 10, 033107 CrossRef PubMed
.
- K.-H. Han and A. B. Frazier, J. Appl. Phys., 2004, 96, 5797–5802 CrossRef CAS
.
- R. Jack, K. Hussain, D. Rodrigues, M. Zeinali, E. Azizi, M. Wicha, D. M. Simeone and S. Nagrath, Lab Chip, 2017, 17, 1349–1358 RSC
.
- N. Bohmer, N. Demarmels, E. Tsolaki, L. Gerken, K. Keevend, S. Bertazzo, M. Lattuada and I. K. Herrmann, ACS Appl. Mater. Interfaces, 2017, 9, 29571–29579 CrossRef CAS PubMed
.
- X. Droz, N. Harraghy, E. Lançon, V. Le Fourn, D. Calabrese, T. Colombet, P. Liechti, A. Rida, P. A. Girod and N. Mermod, Biotechnol. Bioeng., 2017, 114, 1791–1802 CrossRef CAS PubMed
.
- N. Pamme, Lab Chip, 2007, 7, 1644–1659 RSC
.
- T. Y. Lee, K.-A. Hyun, S.-I. Kim and H.-I. Jung, Sens. Actuators, B, 2017, 238, 1144–1150 CrossRef CAS
.
- G. Kokkinis, S. Cardoso, F. Keplinger and I. Giouroudi, Sens. Actuators, B, 2017, 241, 438–445 CrossRef CAS
.
- A. A. S. Bhagat, H. Bow, H. W. Hou, S. J. Tan, J. Han and C. T. Lim, Med. Biol. Eng. Comput., 2010, 48, 999–1014 CrossRef PubMed
.
- J.-J. Lee, K. J. Jeong, M. Hashimoto, A. H. Kwon, A. Rwei, S. A. Shankarappa, J. H. Tsui and D. S. Kohane, Nano Lett., 2013, 14, 1–5 CrossRef PubMed
.
- S. De Wit, G. Van Dalum, A. T. Lenferink, A. G. Tibbe, T. J. N. Hiltermann, H. J. Groen, C. J. van Rijn and L. W. Terstappen, Sci. Rep., 2015, 5, 12270 CrossRef CAS PubMed
.
- R. Cheng, T. Zhu and L. Mao, Microfluid. Nanofluid., 2014, 16, 1143–1154 CrossRef CAS
.
- B. D. Plouffe, S. K. Murthy and L. H. Lewis, Rep. Prog. Phys., 2014, 78, 016601 CrossRef PubMed
.
- T. Deng, G. M. Whitesides, M. Radhakrishnan, G. Zabow and M. Prentiss, Appl. Phys. Lett., 2001, 78, 1775–1777 CrossRef CAS
.
- P. Grodzinski, J. Yang, R. H. Liu and M. D. Ward, Biomed. Microdevices, 2003, 5, 303–310 CrossRef CAS
.
- V. I. Furdui and D. J. Harrison, Lab Chip, 2004, 4, 614–618 RSC
.
- H. Lee, A. Purdon and R. Westervelt, Appl. Phys. Lett., 2004, 85, 1063 CrossRef CAS
.
- S. Miltenyi, W. Müller, W. Weichel and A. Radbruch, Cytometry, 1990, 11, 231–238 CrossRef CAS PubMed
.
- J.-C. Yu, C.-C. Hu, W.-H. Chang, P.-C. Chen, M. S. Lee, K.-T. Peng and G.-B. Lee, Microfluid. Nanofluid., 2018, 22, 13 CrossRef
.
- N. Pamme, J. C. Eijkel and A. Manz, J. Magn. Magn. Mater., 2006, 307, 237–244 CrossRef CAS
.
- B. Ngamsom, M. M. N. Esfahani, C. Phurimsak, M. J. Lopez-Martinez, J.-C. Raymond, P. Broyer, P. Patel and N. Pamme, Anal. Chim. Acta, 2016, 918, 69–76 CrossRef CAS PubMed
.
- M. Vojtíšek, M. D. Tarn, N. Hirota and N. Pamme, Microfluid. Nanofluid., 2012, 13, 625–635 CrossRef
.
- N. Pamme and C. Wilhelm, Lab Chip, 2006, 6, 974–980 RSC
.
- D. W. Inglis, R. Riehn, R. H. Austin and J. C. Sturm, Appl. Phys. Lett., 2004, 85, 5093–5095 CrossRef CAS
.
-
M. D. Tarn and N. Pamme, in Microchip Diagnostics, Springer, 2017, pp. 69–83 Search PubMed
.
- M. Hejazian, W. Li and N.-T. Nguyen, Lab Chip, 2015, 15, 959–970 RSC
.
- N. Pamme and A. Manz, Anal. Chem., 2004, 76, 7250–7256 CrossRef CAS PubMed
.
- M. D. Tarn, N. Hirota, A. Iles and N. Pamme, Sci. Technol. Adv. Mater., 2009, 10(1), 014611 CrossRef PubMed
.
- T. Zhu, R. Cheng, Y. Liu, J. He and L. Mao, Microfluid. Nanofluid., 2014, 17, 973–982 CrossRef CAS
.
- J. D. Adams, U. Kim and H. T. Soh, Proc. Natl. Acad. Sci. U. S. A., 2008, 105, 18165–18170 CrossRef CAS PubMed
.
- W.-T. Wu, A. B. Martin, A. Gandini, N. Aubry, M. Massoudi and J. F. Antaki, Microfluid. Nanofluid., 2016, 20, 41 CrossRef PubMed
.
- X. Han, Y. Feng, Q. Cao and L. Li, Microfluid. Nanofluid., 2015, 18, 1209–1220 CrossRef CAS
.
- E. Brouzes, T. Kruse, R. Kimmerling and H. H. Strey, Lab Chip, 2015, 15, 908–919 RSC
.
- B.-Y. Qu, Z.-Y. Wu, F. Fang, Z.-M. Bai, D.-Z. Yang and S.-K. Xu, Anal. Bioanal. Chem., 2008, 392, 1317 CrossRef CAS PubMed
.
- C. B. Fuh, H. Y. Tsai and J. Z. Lai, Anal. Chim. Acta, 2003, 497, 115–122 CrossRef CAS
.
- B. Kwak, J. Lee, D. Lee, K. Lee, O. Kwon, S. Kang and Y. Kim, Biosens. Bioelectron., 2017, 88, 153–158 CrossRef CAS PubMed
.
- H. Lee, J. Jung, S.-I. Han and K.-H. Han, Lab Chip, 2010, 10, 2764–2770 RSC
.
- K.-H. Han and A. B. Frazier, Proc. Nanotechnol., 2005, 2005, 187–190 Search PubMed
.
- E. Furlani, J. Phys. D: Appl. Phys., 2007, 40, 1313 CrossRef CAS
.
- J. Jung and K.-H. Han, Appl. Phys. Lett., 2008, 93, 223902 CrossRef
.
- Y. Jung, Y. Choi, K.-H. Han and A. B. Frazier, Biomed. Microdevices, 2010, 12, 637–645 CrossRef PubMed
.
- F. Shen, H. Hwang, Y. K. Hahn and J.-K. Park, Anal. Chem., 2012, 84, 3075–3081 CrossRef CAS PubMed
.
- J. Nam, H. Huang, H. Lim, C. Lim and S. Shin, Anal. Chem., 2013, 85, 7316–7323 CrossRef CAS PubMed
.
- A. Ashkin, J. Dziedzic, J. Bjorkholm and S. Chu, Opt. Lett., 1986, 11, 288–290 CrossRef CAS PubMed
.
- B. Landenberger, H. Höfemann, S. Wadle and A. Rohrbach, Lab Chip, 2012, 12, 3177–3183 RSC
.
- D. Baresch, J.-L. Thomas and R. Marchiano, Phys. Rev. Lett., 2016, 116, 024301 CrossRef PubMed
.
- K. Heon Lee, K. Soo Lee, J. Ho Jung, C. Bong Chang and H. Jin Sung, Appl. Phys. Lett., 2013, 102, 141911 CrossRef
.
- A. H. Yang, S. D. Moore, B. S. Schmidt, M. Klug, M. Lipson and D. Erickson, Nature, 2009, 457, 71–75 CrossRef CAS PubMed
.
- M. Dienerowitz, M. Mazilu and K. Dholakia, J. Nanophotonics, 2008, 2, 021875 CrossRef
.
- A. Ashkin, Proc. Natl. Acad. Sci. U. S. A., 1997, 94, 4853–4860 CrossRef CAS
.
- K. Dholakia, P. Reece and M. Gu, Chem. Soc. Rev., 2008, 37, 42–55 RSC
.
- X. Wang, S. Chen, M. Kong, Z. Wang, K. D. Costa, R. A. Li and D. Sun, Lab Chip, 2011, 11, 3656–3662 RSC
.
- C.-C. Lin, A. Chen and C.-H. Lin, Biomed. Microdevices, 2008, 10, 55–63 CrossRef PubMed
.
- M. M. Wang, E. Tu, D. E. Raymond, J. M. Yang, H. Zhang, N. Hagen, B. Dees, E. M. Mercer, A. H. Forster and I. Kariv, Nat. Biotechnol., 2005, 23, 83–87 CrossRef CAS PubMed
.
- M. M. Wang, E. Tu, D. E. Raymond, J. M. Yang, H. Zhang, N. Hagen, B. Dees, E. M. Mercer, A. H. Forster, I. Kariv, P. J. Marchand and W. F. Butler, Nat. Biotechnol., 2005, 23, 83–87 CrossRef CAS PubMed
.
- J. Enger, M. Goksör, K. Ramser, P. Hagberg and D. Hanstorp, Lab Chip, 2004, 4, 196–200 RSC
.
- S. Yan, J. Zhang, C. Pan, D. Yuan, G. Alici, H. Du, Y. Zhu and W. Li, J. Micromech. Microeng., 2015, 25, 084010 CrossRef
.
- B. D. Plouffe, T. Kniazeva, J. E. Mayer Jr., S. K. Murthy and V. L. Sales, FASEB J., 2009, 23, 3309–3314 CrossRef CAS PubMed
.
- S. Yan, J. Zhang, D. Yuan and W. Li, Electrophoresis, 2017, 38, 238–249 CrossRef CAS PubMed
.
- U. Kim and H. T. Soh, Lab Chip, 2009, 9, 2313–2318 RSC
.
- J. D. Adams, P. Thévoz, H. Bruus and H. T. Soh, Appl. Phys. Lett., 2009, 95, 254103 CrossRef PubMed
.
- A. A. S. Bhagat, H. W. Hou, L. D. Li, C. T. Lim and J. Han, Lab Chip, 2011, 11, 1870–1878 RSC
.
- H.-K. Seo, Y.-H. Kim, H.-O. Kim and Y.-J. Kim, J. Micromech. Microeng., 2010, 20, 095019 CrossRef
.
- M. Mizuno, M. Yamada, R. Mitamura, K. Ike, K. Toyama and M. Seki, Anal. Chem., 2013, 85, 7666–7673 CrossRef CAS PubMed
.
- D. Kirby, J. Siegrist, G. Kijanka, L. Zavattoni, O. Sheils, J. O'Leary, R. Burger and J. Ducrée, Microfluid. Nanofluid., 2012, 13, 899–908 CrossRef CAS
.
- F. Del Giudice, H. Madadi, M. M. Villone, G. D'Avino, A. M. Cusano, R. Vecchione, M. Ventre, P. L. Maffettone and P. A. Netti, Lab Chip, 2015, 15, 1912–1922 RSC
.
- M. J. Kim, D. J. Lee, J. R. Youn and Y. S. Song, RSC Adv., 2016, 6, 32090–32097 RSC
.
- Y. Zhou, L. Song, L. Yu and X. Xuan, Microfluid. Nanofluid., 2017, 21, 14 CrossRef
.
- V. Kumar and P. Rezai, Biomed. Microdevices, 2017, 19, 39 CrossRef PubMed
.
- S. Choi, S. Song, C. Choi and J.-K. Park, Lab Chip, 2007, 7, 1532–1538 RSC
.
- K.-H. Han and A. B. Frazier, Lab Chip, 2006, 6, 265–273 RSC
.
- J. Wu, Q. Yan, S. Xuan and X. Gong, Microfluid. Nanofluid., 2017, 21, 47 CrossRef
.
- T. P. Forbes and S. P. Forry, Lab Chip, 2012, 12, 1471–1479 RSC
.
- W. Zhao, R. Cheng, B. D. Jenkins, T. Zhu, N. E. Okonkwo, C. E. Jones, M. B. Davis, S. K. Kavuri, Z. Hao and C. Schroeder, Lab Chip, 2017, 17, 3097–3111 RSC
.
- J. Zhang, S. Yan, D. Yuan, Q. Zhao, S. H. Tan, N.-T. Nguyen and W. Li, Lab Chip, 2016, 16, 3947–3956 RSC
.
- S. Yan, J. Zhang, D. Yuan, Q. Zhao, J. Ma and W. Li, Appl. Phys. Lett., 2016, 109, 214101 CrossRef
.
- M. Wiklund, C. Günther, R. Lemor, M. Jäger, G. Fuhr and H. M. Hertz, Lab Chip, 2006, 6, 1537–1544 RSC
.
- S. K. Ravula, D. W. Branch, C. D. James, R. J. Townsend, M. Hill, G. Kaduchak, M. Ward and I. Brener, Sens. Actuators, B, 2008, 130, 645–652 CrossRef CAS
.
- A. Abdallah, S. van den Driesche, L. Brandhoff, F. Bunge, M. Akhtar, R. Ebrahimifard, S. Clara, B. Jakoby and M. J. Vellekoop, Procedia Eng., 2015, 120, 691–694 CrossRef CAS
.
- X. Zhu, Y.-C. Kung, T.-H. Wu, M. A. Teitell and P.-Y. Chiou, Dielectrophoretic focusing integrated pulsed laser activated cell sorting, 2017 Search PubMed.
- S. Chang and Y.-H. Cho, Lab Chip, 2008, 8, 1930–1936 RSC
.
- S. Yan, J. Zhang, Y. Yuan, G. Lovrecz, G. Alici, H. Du, Y. Zhu and W. Li, Electrophoresis, 2015, 36, 284–291 CrossRef CAS PubMed
.
- S. Yan, J. Zhang, G. Alici, H. Du, Y. Zhu and W. Li, Lab Chip, 2014, 14, 2993–3003 RSC
.
- S. Choi, T. Ku, S. Song, C. Choi and J.-K. Park, Lab Chip, 2011, 11, 413–418 RSC
.
- S. Choi, S. Song, C. Choi and J. K. Park, Small, 2008, 4, 634–641 CrossRef CAS PubMed
.
- H.-S. Moon, K. Kwon, S.-I. Kim, H. Han, J. Sohn, S. Lee and H.-I. Jung, Lab Chip, 2011, 11, 1118–1125 RSC
.
- J. Zhang, S. Yan, G. Alici, N.-T. Nguyen, D. Di Carlo and W. Li, RSC Adv., 2014, 4, 62076–62085 RSC
.
- A. Y. Lau, L. P. Lee and J. W. Chan, Lab Chip, 2008, 8, 1116–1120 RSC
.
- G. Thalhammer, R. Steiger, M. Meinschad, M. Hill, S. Bernet and M. Ritsch-Marte, Biomed. Opt. Express, 2011, 2, 2859–2870 CrossRef CAS PubMed
.
- P. Glynne-Jones and M. Hill, Lab Chip, 2013, 13, 1003–1010 RSC
.
- C. W. Shields IV, K. A. Ohiri, L. M. Szott and G. P. López, Cytometry, Part B, 2017, 92, 115–125 CrossRef PubMed
.
- J. Che, V. Yu, M. Dhar, C. Renier, M. Matsumoto, K. Heirich, E. B. Garon, J. Goldman, J. Rao and G. W. Sledge, Oncotarget, 2016, 7, 12748 CrossRef PubMed
.
| This journal is © The Royal Society of Chemistry 2019 |

