
 Open Access Article
 This Open Access Article is licensed under a
 Creative Commons Attribution 3.0 Unported Licence
Mobile imaging platform for digital influenza virus counting†
Yoshihiro
Minagawa‡
 ,
Hiroshi
Ueno‡
,
Kazuhito V.
Tabata
and
Hiroyuki
Noji
*
,
Hiroshi
Ueno‡
,
Kazuhito V.
Tabata
and
Hiroyuki
Noji
*
Department of Applied Chemistry, The University of Tokyo, 7-3-1 Hongo, Bunkyo-ku, Japan. E-mail: hnoji@appchem.t.u-tokyo.ac.jp
First published on 17th July 2019
Abstract
Droplet-based digital bioassays enable highly sensitive and quantitative analysis of biomolecules, and are thought to be suitable for point-of-care diagnosis. However, digital bioassays generally require fluorescence microscopy for detection, which is too large for point-of-care testing. Here, we developed a simple smartphone-based mobile imaging platform for digital bioassays. The size of the mobile imaging platform was 23 × 10 × 7 cm (length × width × height). With this platform, a digital enzyme assay of bovine alkaline phosphatase was successfully completed. Digital influenza virus counting—based on a fluorogenic assay for neuraminidase activity of the virus—was also demonstrated. Distinct fluorescence spots derived from single virus particles were observed with the mobile imaging platform. The number of detected fluorescence spots showed good linearity against the virus titer, suggesting that high sensitivity and quantification were achieved, although the imaging with the mobile platform detected 60% of influenza virus particles that were identified with conventional fluorescence microscopy. The lower detection efficiency is due to its relatively lower signal-to-noise ratio than that found with conventional microscopes, and unavoidable intrinsic heterogeneity of neuraminidase activity among virus particles. Digital influenza virus counting with the mobile imaging platform still showed 100 times greater sensitivity than that with a commercial rapid influenza test kit. Virus detection of clinical samples was also successfully demonstrated, suggesting the potential to realize a highly sensitive point-of-care system for influenza virus detection with smartphones.
1. Introduction
Digital bioassays have seen rapid growth as emerging methods of bioanalysis that enables single-molecule detection sensitivity.1–3 In a typical digital bioassay protocol, target molecules that have catalytic activity by themselves or when tagged with enzyme-linked binders such as antibodies are stochastically confined in micron-sized reactors. In these microreactors, enzymes hydrolyze fluorogenic substrates, accumulating fluorescent dye molecules. When the concentration of target molecules is sufficiently low, each reactor stochastically encapsulates none or one of the target molecules. The typical volume of microreactors is extremely small, in the range of femtoliters. As a result, positive reactors entrapping single target molecules accumulate fluorescent dyes in a short period of time, producing a high fluorescence signal that is distinct from the background signal. After binarization of the signal, the number of reactors giving a signal of ‘1’, for quantification of a target molecule in the analyte, can be counted.In the early studies of digital bioassays, microreactor systems were composed of a microfabricated polymer sheet of polydimethylsiloxane (PDMS) and a glass coverslip,4,5 or a fabricated glass gasket and PDMS sheet.6 Later, a system that displayed over a million droplets was developed7 and became one of the representative platform devices for microreactor arrays.8,9 Currently, microemulsion in fluidic systems is also widely used.10,11
Successful digital bioassays include the single-molecule enzymatic assay, digital PCR,12–14 and digital ELISA.15–17 These studies achieved drastic improvements in detection sensitivity, by three orders of magnitude or more in comparison with conventional assays. Large numbers of microreactors ensure a wide range of concentrations for quantification.2 Since the high sensitivity and quantification of digital bioassays have become well recognized, a wide variety of digital bioassays have been developed, such as isothermal amplification of DNA (LAMP and RCA), and electrochemical detection.18–20 Digital counting and analysis of membrane transport proteins, which are hard to quantify using conventional biochemical methods, were also achieved through the development of an arrayed lipid bilayer chamber system (ALBiCs).21–23 Currently, the concept of digital bioassays is expanded to microreactor-free analytical methods that include single virus counting with interferometric imaging and the tyramide deposition method.24–26
Another merit of digital bioassays is compactness. The high sensitivity of digital bioassays enables analyses with small specimen volumes. Devices for femtoliter droplet array displays or emulsion generation/handling are also compact; the typical size of such devices is a few centimeters. These features of digital bioassays facilitate the realization of compact systems for on-site rapid diagnosis and point-of-care diagnosis. As the signals for detection are generally fluorescence signals, miniaturization of the fluorescence microscopy system is required for on-site diagnostic systems. To implement the requirement, a compact lens-less complementary metal-oxide-semiconductor (CMOS) image sensor directly coupled with the microreactor system has been developed for the digital ELISA, which still remains to be further elaborated.27,28
Smartphones are the most ubiquitous imaging device globally that include a high quality CMOS camera. There are about 42% smartphone users in emerging and developing countries, and approximately 2.5 billion people worldwide will own a smartphone in 2019 (https://www.statista.com). Thus, smartphones are highly suitable as an imaging unit in personalized POC diagnostic systems, which could lead to the decentralization of health care management. In addition, when a smartphone-based diagnostic test system is spread, it would allow global health monitoring. To date, there have been several reports of smartphone-based POC diagnostic platforms29–31 with demonstrations of several analyses: fluorescence microscopy imaging,32,33 cytometry,34 paper-based POC diagnostic tests,35,36 biochemical assays with 96 well plates,37,38 electrochemical biosensing,39 surface plasmon resonance-based biosensing,40,41 and optical density sensing.42
However, only a few demonstrations of digital bioassays on smartphone-based detection systems have been reported. The Nilsson and Ozcan group reported detection of digital rolling circle amplification of DNA via smartphone-based imaging.33 Issadore et al. described an integrated fluidic system with a smartphone-based imaging unit for solution handling and detection using the digital ELISA.43 However, a swift and simple digital bioassay that would meet urgent needs for early stage disease detection has not yet been developed. Previously, we reported a digital influenza virus counting (DIViC) method based on a fluorogenic assay of neuraminidase activity of the influenza virus.44 This method does not require liquid separation procedures for free antibody washing, and thus would be suitable for on-site detection with a compact imaging unit.
In this study, we aimed to develop a simple type of mobile imaging platform (MobIP) for digital bioassays with a femtoliter reactor array device (FRAD). The MobIP was integrated with waveguide-based total internal reflection illumination and movement stages. This system enabled the digital enzyme assay of alkaline phosphatase and also DIViC. Our system was approximately 100 times more sensitive than rapid influenza diagnostic tests (RIDTs).
2. Materials and methods
Chemicals
The influenza A virus [A/Puerto Rico/8/1934(H1N1)] was prepared as previously reported.45 2′-(4-Methylumbelliferyl)-α-D-N-acetylneuraminic acid (MUNANA) (Life Technologies, Carlsbad, CA, USA), Fluorinert-FC40 (3M), CYTOP (Asahi-glass, Tokyo, Japan), a highly active alkaline phosphatase recombinant (ALP, Roche, Switzerland), Fomblin Y-LVAC25/6 (Solvay, Brussels, Belgium), 4-MU phosphate (4MUP, Sigma-Aldrich, St. Louis, MI, USA), and RIDT (Quicknavi Flu; Denka Seiken, Tokyo, Japan) were purchased from the respective suppliers.Femtoliter reactor array device (FRAD)
The fL reactor array device (FRAD) was prepared as follows. A hydrophobic carbon–fluorine polymer (CYTOP; Asahi-glass) was spin-coated on a glass coverslip (24 × 32 mm) at 2500 rpm for 30 s and baked at 80 °C for 10 min and then at 180 °C for 30 min. The thickness of the CYTOP layer was approximately 3.0 μm. The CYTOP-coated coverslip was spin-coated with a positive photoresist (AZ-4203; AZ Electronic Materials, Luxembourg) at 1000 rpm for 30 s and baked at 100 °C for 5 min. Subsequently, photolithography was carried out with a mask structure with 3 μm holes, which were separated by 9 μm. The resist-patterned coverslip was dipped in a developer (AZ300MIF; Merck, Darmstadt, Germany) for 90 s in a sonic bath. The coverslip was dry-etched with O2 plasma in a reactive ion etching system (RIE-10NR; Samco, Kyoto, Japan) to remove the exposed CYTOP. The substrate was then cleaned and rinsed with acetone and isopropanol to remove the photoresist layer remaining on the substrate. The resulting CYTOP-on-coverslip device had an array of exposed SiO2 patterns with a diameter of about 4.5 μm, which each held a water droplet in the digital assay for bovine alkaline phosphatase (bALP) and the influenza virus. The volume of one microreactor was 48 fL.Smartphone-based imaging unit
The platform structure for assembling the smartphone and other optical/mechanical components was designed using AUTODESK® 123D® DESIGN and prototyped using a 3D printer (Form 2; FormLabs, Somerville, MA, USA). The following components were assembled on the platform: a power LED (365 nm at 3 W; Epileds, Taiwan), a battery-operated micro linear actuator (LA003; Seiko, Tokyo, Japan), a micrometer head (SHS2-13, Sigma), an aspherical lens (C340TMD-A; Thorlabs, Newton, NJ, USA), a long pass filter for emissions (λ = 410 nm, SC-41; Fujifilm, Tokyo, Japan), and a microcomputer system (Genuino 101; Arduino LLC, USA). The aspherical lens was set into the hole beneath which the smartphone camera was inserted. The long pass filter was placed between the aspherical lens and the FRAD (Fig. 1). The micro linear actuator enabled the lateral movement of the sample slide and enabled observation at a 1 cm distance. The micrometer head was used to move the sample slide in the z direction for focusing. The power LED and battery-operated linear actuator were operated via a Genuino 101 board, which communicated to the smartphone through a Bluetooth Low Energy (BLE) module. The size of the smartphone-based platform was approximately 23 × 10 × 7 cm (Fig. S1†), and the cost was estimated to be <$360 (USD), excluding the smartphone.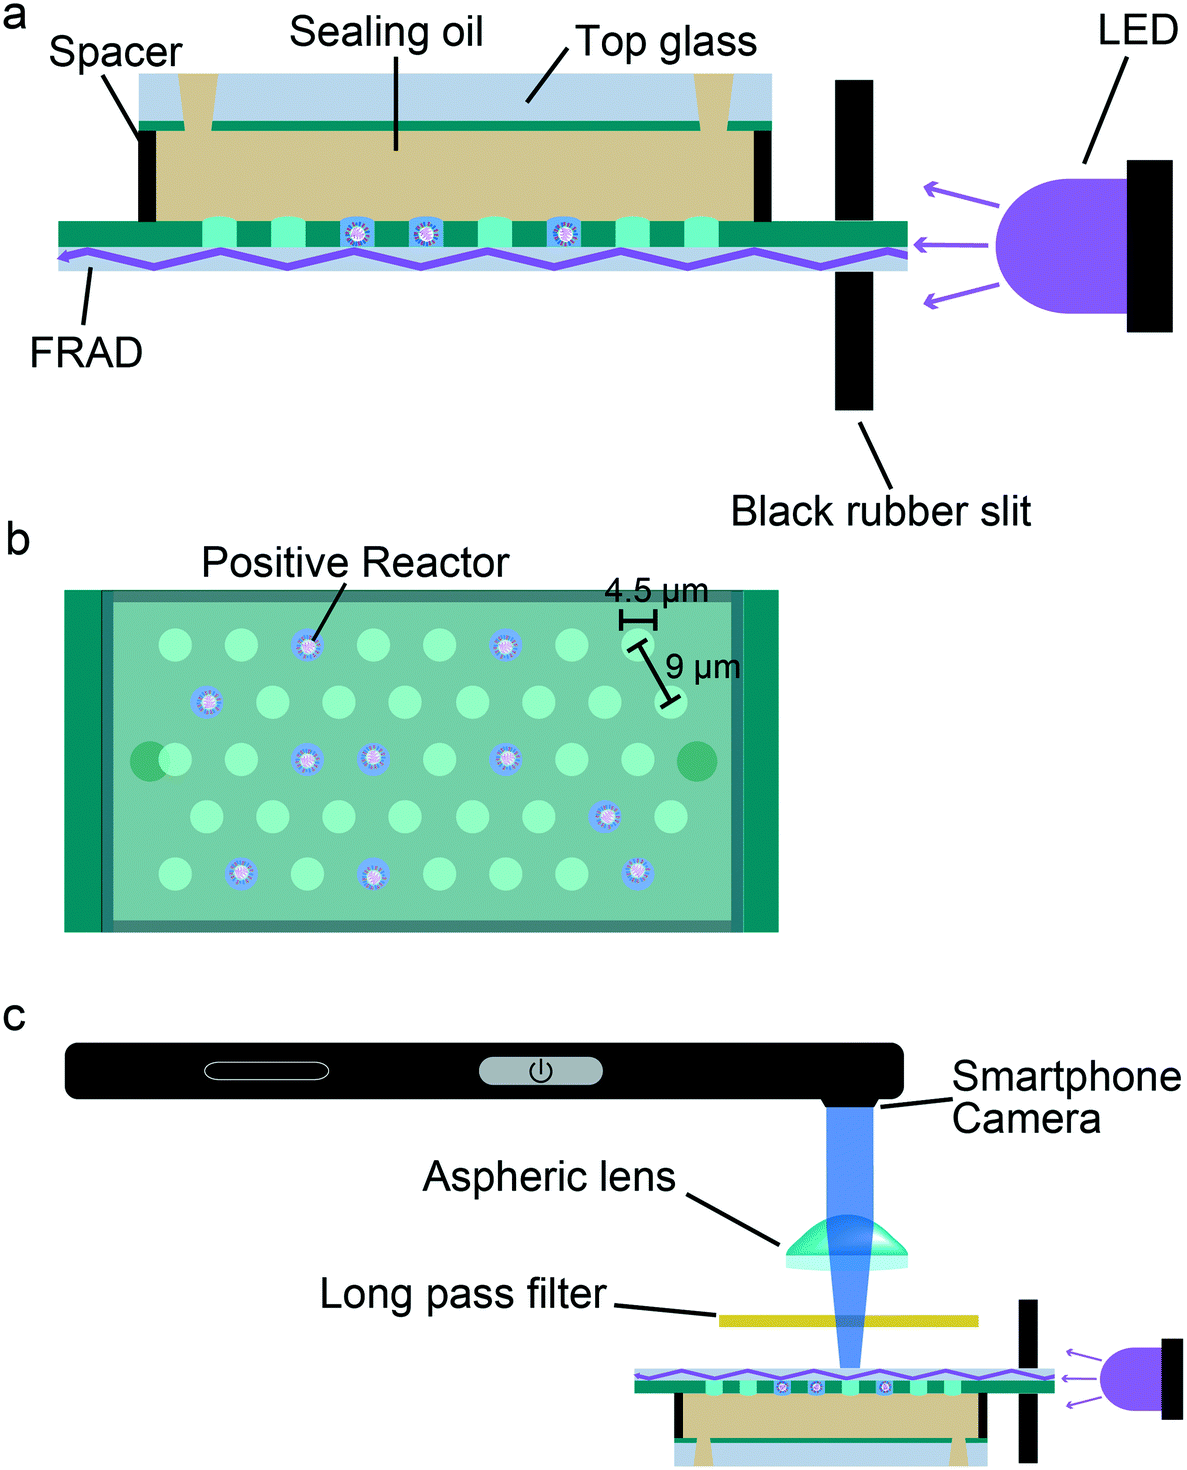 | ||
| Fig. 1 Mobile imaging platform (MobIP) based on a smartphone. (a) Schematic side view of a flow cell with an integrated waveguide-based total internal reflection fluorescence imaging system. The flow cell is composed of a top glass layer, spacer, and FRAD that has a femtoliter reactor. (b) Schematic top view of the FRAD. (c) Schematic image of the MobIP. The flow cell of the FRAD was inserted below the smartphone (Xperia SO-03J, SONY, Japan). Note that the FRAD was set upside-down (in relation to Fig. 1a) to introduce fluorescence emission from the FRAD towards the camera. Emissions were collected with an aspheric lens set between the long pass filter and smartphone camera. | ||
Digital bioassay with the MobIP
All images were acquired using a smartphone mounted onto our platform. The FRAD was illuminated using a power LED, activated through a smartphone app using the Genuino 101 board. The power LED was placed close to the edge of the FRAD and was used as a light source to produce waveguide-based total internal reflection excitation in the glass. The scattered excitation of the LED was blocked through the long pass filter, creating the very efficient background that is necessary to isolate the weak fluorescence signal.Image analysis
Photoimages obtained from the smartphone were saved as JPEG files with 8 bit data for blue, green, and red channels. After transferring the image data to a desktop computer, the total fluorescence intensity was determined for analysis, as observed in other digital bioassays. Although the fluorescence intensity of the blue channel was also available for analysis, the total intensity produced less noise and was, therefore, subjected to analysis. The image data were analyzed using ImageJ (NIH, Bethesda, MD, USA).The signal-to-noise ratio, S/N, of the images is defined as:  , where μs is the mean fluorescence intensity of the positive reactor, μb is the mean background signal (=signal from empty reactors), and σb is the standard deviation of the background signal.
Digital enzyme assay for bovine alkaline phosphatase (bALP)
The flow cell was assembled with the FRAD and CYTOP-coated glass, which were bound using 80 μm double-sided tape. The bALP solution was diluted with an assay buffer (1 M diethanolamine, 2 mM MgCl2, 0.1% Tween-20). Next, the fluorogenic substrate 4MUP was added at 1 mM, and the reaction mixture was immediately introduced into the flow cell. Next, fluorinated oil (FC40) was introduced to flush out the excess reaction mixture and form droplets in chamber arrays. Subsequently, FC40 was replaced by Fomblin to prevent the evaporation of the water droplets. After incubation for 20 min at room temperature, fluorescence images were obtained using the smartphone on the MobIP or a conventional inverted fluorescence microscope (Olympus IX83, Olympus Co., Tokyo, Japan) equipped with an sCMOS camera (Andor Neo, Andor Technology, Belfast, Northern Ireland) and objective lens (×20, N.A. = 0.75).DIViC procedure in the FRAD
The indicated concentration of influenza virus was mixed with the fluorescence substrate MUNANA in 1 mM reaction buffer (1 M diethanolamine, 4 mM CaCl2). The reaction mixture was introduced into a flow cell constructed from the FRAD and CYTOP-coated glass. After sealing with FC40 and Fomblin, the FRAD was incubated at 47 °C on a hotplate. Fluorescence images were obtained using a smartphone on the MobIP or a conventional fluorescence microscope (Olympus IX83, Olympus Co.).3. Results and discussion
Femtoliter reactor array device (FRAD)
The femtoliter reactor array device (FRAD) was prepared as previously reported.44 In short, a fluorinated polymer was spin-coated at a thickness of 3 μm on a coverslip and fabricated to display an array of microholes (ϕ = 4.5 μm, volume = 48 fL) through photolithography treatment (see the Materials and methods section for details). The micron holes are used as reactors, entrapping water-in-oil droplets under fluorinated oil (FC40). The total number of reactors was 6.0 × 10⁶ on a 20 × 20 mm square surface. A flow cell was assembled from a fabricated device, a top glass layer with inlet and outlet holes, and a spacer sheet.Mobile imaging platform (MobIP)
We built a MobIP based on an Xperia smartphone (SO03-J, SONY, Japan). We 3D-printed an optomechanical platform structure on which the following components were mounted: a mechanical stage, high power light emitting diodes (LEDs) (365 nm at 3 W), a long-pass thin-film filter (λ = 410 nm), and an aspheric lens (f = 4 mm, NA = 0.64). The mechanical stage had vertical and lateral actuator systems for adjusting the focal position of a flow cell and multipoint imaging. The LED was placed at the side of the FRAD. Incident light was introduced from the side wall of the coverslip of the FRAD, through a black rubber slit clipping a fabricated coverslip to separate the parallel component of the incident light.34,46 The reflection indices of CYTOP and water are 1.34 and 1.33, respectively, so that the incident light propagated inside the coverslip via waveguide-based total internal reflection when the incident angle was over 42°. Illumination by an evanescent field at the water/glass interface largely reduced the background noise and enabled detection of the fluorescence signal from single enzymes or single virus particles with an ordinal long pass filter. An aspheric lens was placed between the long pass filter and the smartphone camera for focusing the image as previously reported.31,32 We tested several types of aspheric lenses and found that C340TMD-A (Thorlabs) was the most suitable for imaging in the present setup. In addition, a microactuator system was implemented for lateral positioning of the FRAD in relation to the camera. The actuator system and LED were controlled with a microcomputer unit connected to the smartphone via Bluetooth Low Energy (BLE). When needed, multiple point imaging was conducted using the lateral actuator system (Fig. S2†).Digital enzyme assay of bovine alkaline phosphatase (bALP) on the MobIP
To test the performance of the MobIP, we conducted a digital enzyme assay of bALP, which has a high dephosphorylation activity (about 1400 reactions per s per molecule) and was thus suitable as a model enzyme for an initial proof-of-concept experiment. The bALP solution was mixed with a fluorogenic substrate [4-methylumbelliferone (4MUP)] and introduced into the FRAD, followed by oil sealing (Fig. 2a). After incubation for 20 min at room temperature, the FRAD was inserted in the MobIP. The concentration of bALP was diluted to 1 pM, which corresponds to 0.029 enzyme molecules per reactor, ensuring digital assay conditions where single enzyme molecules are stochastically entrapped in reactors.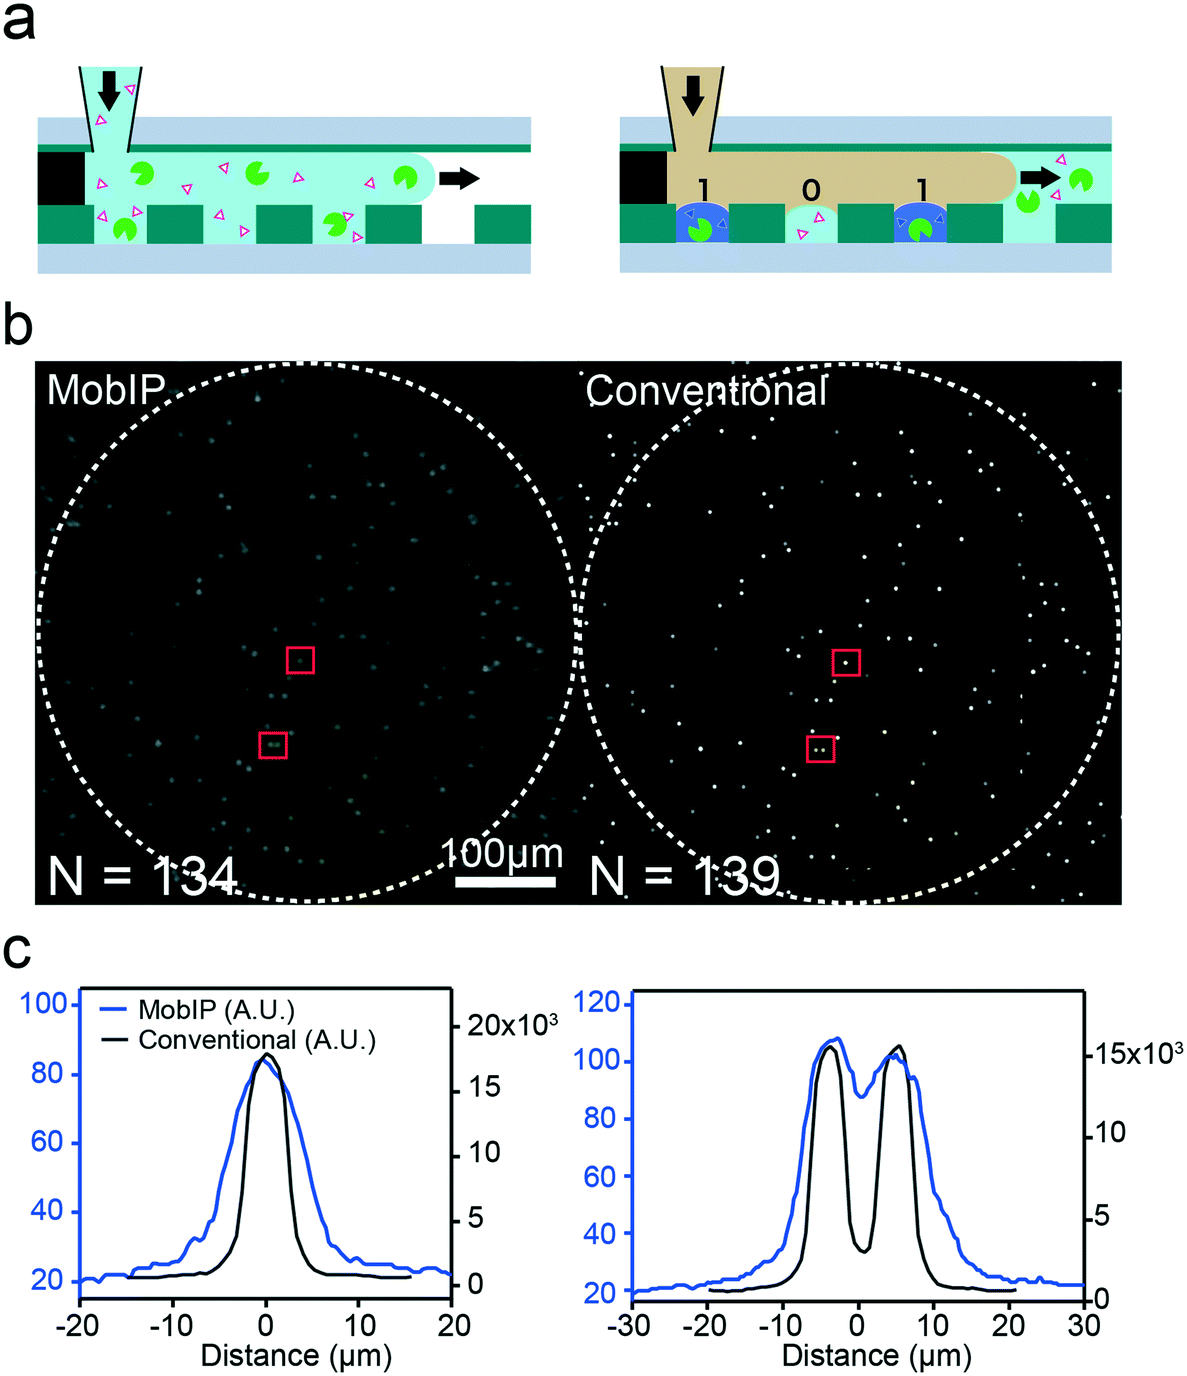 | ||
| Fig. 2 Digital bioassay of bovine ALP (bALP) with a mobile imaging platform (MobIP). (a) Schematic image of a digital enzyme assay for bALP. (b) A typical fluorescence image obtained with the MobIP (left) and the corresponding image taken using conventional fluorescence microscopy (right). Pixel sizes of the MobIP and conventional fluorescence microscopy are 338 and 650 nm, respectively. White dashed circles indicate the area subjected to analysis. Positive reactors were identified as fluorescent spots giving a signal over mean + 3 SD of the background signal: N = 134 for the MobIP and N = 139 for the conventional microscope. (c) Intensity profiles of single (left) or double (right) positive reactors from the red squares in Fig. 2b. | ||
Fig. 2b (left) shows a fluorescence image of the digital enzyme assay for bALP with the MobIP. Discrete fluorescent bright spots were observed. Because the spherical aberration caused image distortion in the marginal area, the circular field within 690 μm from the center (the dashed circle in Fig. 2b), where individual fluorescent reactors were identifiable, was selectively analyzed in each image. To confirm that the bright spots in the MobIP image corresponded to positive reactors that give a fluorescence signal over mean + 3 SD of the background signal, the same FRAD used in Fig. 2b was subjected to imaging with conventional fluorescence microscopy with a ×20 objective lens. The whole image from the FRAD was scanned, and the corresponding image was identified (the right image in Fig. 2b). In this assessment, conventional fluorescence imaging found 139 positive reactors in total. Meanwhile, the MobIP detected 134 reactors, all consistent with the positive reactors from the microscopy image. Five reactors were not detected with the MobIP due to their dark signals and image distortion because of positioning near the marginal area.
The number of positive reactors detected in the above analysis was consistent with the expected values from the concentration of bALP. The MobIP found 134 positive signals among 5286 reactors in the analysis area, giving 0.025 as the average positive count per reactor (λ). This is consistent with the λ value (0.029) expected from the bALP concentration, and supports the detection and quantification performance of the MobIP.
The spatial resolution of images obtained with the MobIP was characterized from intensity profiles. Images of single or double positive reactors were arbitrarily selected from the image obtained with the MobIP (as marked with red squares in Fig. 2b), and their intensity profiles are shown in Fig. 2c. The corresponding images from conventional microscopy were also analyzed. Fitting these profiles with a Gaussian function determined that the full width at half maximum (FWHM) in the MobIP images was 8.72 ± 0.74 μm, while that of the microscopy image was 4.60 ± 0.02 μm. The spatial resolution for the MobIP was lower than that of the conventional microscopy. One possible reason for that is the spherical and other aberrations from the aspherical lens. Another possible reason is that the images were processed for contrast enhancing or smoothing using built-in image processing software on the smartphone. Even with this relatively lower spatial resolution, the MobIP resolved fluorescence images of the two adjacent positive reactors separated by 9 μm (Fig. 2c). It should be noted that the spatial resolution is dependent on the position in the image field: it worsened near the marginal area. For further improvement, optimization of optical systems as well as development of software to completely control image acquisition, as well as processing, is required.
Digital influenza virus counting (DIViC) with the MobIP
We tested digital influenza virus counting (DIViC), based on previous work44 (Fig. 3a) in which influenza virus particles were detected from the catalytic activity of neuraminidase (NA)—a surface glycoprotein of the influenza virus. Because DIViC does not require antibodies for detection but depends on the catalytic activity of the influenza virus by itself, DIViC requires only simple mixing of specimen solution with a fluorogenic substrate and introduction into the FRAD. Thus, DIViC is swifter and simpler than conventional antibody-based assays. 2′-(4-Methylumbelliferyl)-α-D-N-acetylneuraminic acid (MUNANA) was used as the fluorogenic substrate, which produces a fluorescent dye [4-methylumbelliferone (4MU)] upon catalysis. We diluted the A/PR/8/1934(H1N1) samples to 1.0 × 10⁶ PFU ml−1, and MUNANA was added to give a final concentration of 1 mM.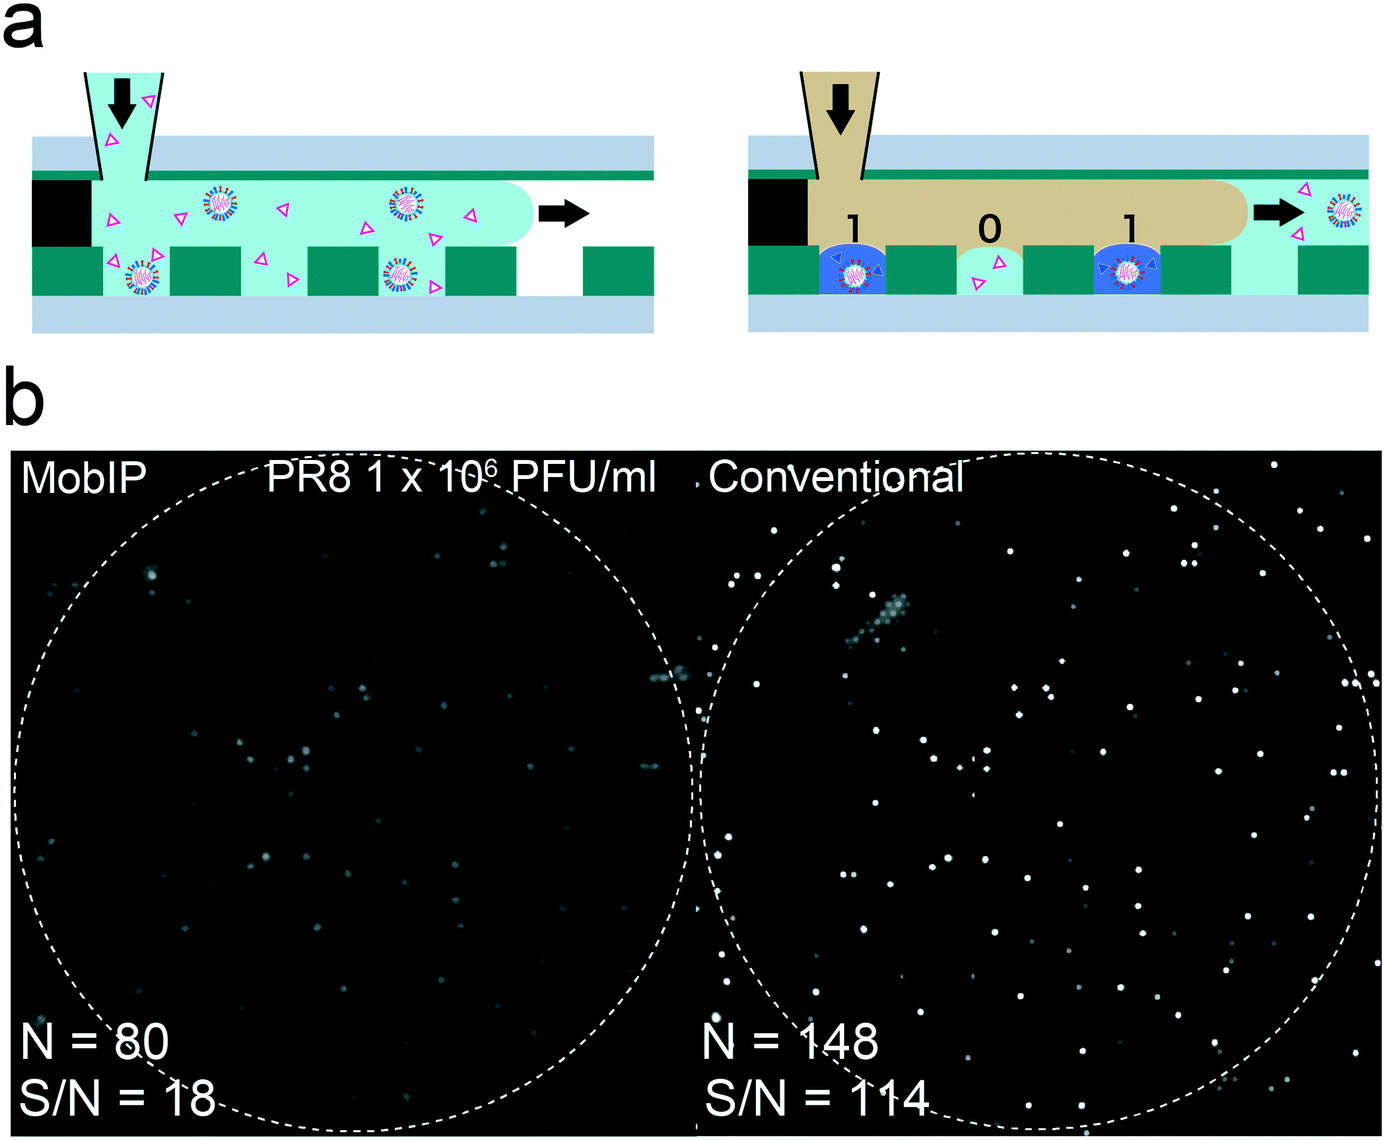 | ||
| Fig. 3 Digital influenza virus counting (DIViC) imaged with the mobile imaging platform (MobIP). (a) Schematic image of DIViC. (b) Fluorescence image obtained with the MobIP (left) and a corresponding image taken with a conventional microscope (right). White dashed circles indicate the area subjected to analysis. Positive reactors were identified as fluorescent spots giving a signal over mean + 3 SD of the background signal: N = 80 for the MobIP and N = 148 for the conventional microscope. The sample was influenza type A virus (A/PR/8/1934(H1N1)) at 106 PFU ml−1. | ||
We previously determined the catalytic activity of NA to be around 240 turnovers per s per virus particle,44 six times lower than the turnover rate of bALP (1400 turnovers per s per molecule). Considering that bALP takes 20 min to give a sufficiently high signal on the MobIP, we predicted that the MobIP would take 2 h to detect the signal for DIViC. When incubated at room temperature for 20 min, obvious signals were not detected. In order to accelerate the reaction, the FRAD was incubated at 47 °C before imaging. This was based on the expectation of 4 times (or more) acceleration, given that the factor of activity for heating increments of +10 °C (Q10 factor) is generally 2 for enzymes.
The left panel of Fig. 3b shows the fluorescence image obtained with the MobIP after 10 min incubation (left). For comparison, the whole image of the same FRAD was scanned with a conventional microscope (right) after imaging with the MobIP. The corresponding image was identified in the same way as the digital enzyme assay for bALP (the right panel of Fig. 3b). All the fluorescence spots found with the MobIP were observed in the image with a conventional microscope. However, the total number of positive reactors found in the MobIP was only 60% of those found in the image from the conventional microscope. This is notably lower than the digital enzyme assay of bALP with the MobIP. The close comparison of the images taken with the MobIP and conventional microscope revealed that fluorescent spots with lower signals were blurred with a higher background noise in the MobIP image. This was principally due to the relatively lower signal-to-noise ratio (S/N) in the MobIP images (18) than that for the conventional microscope (114). Fig. S3† shows the same images in Fig. 3b that is normalized with a median signal value among all pixel values of individual images, with an attempt to show images with a different contrast for comparison between images obtained with the MobIP and conventional microscope.
Different from bALP, the NA activity of the influenza virus shows high particle-to-particle variance: the variance coefficient of the NA activity among virus particles is reported to be 37%, while that for bALP is only 9%.44 Therefore, the fraction of low activity virus particles was undetected in imaging with the MobIP.
Next, we tested DIViC on the MobIP at several virus titers, ranging from 1.0 × 10⁶ to 3.0 × 10⁴ PFU ml−1 (Fig. 4a–c). The total numbers of reactors subjected to analysis were approximately 30![[thin space (1/6-em)]](https://www.rsc.org/images/entities/char_2009.gif) 000, 45000, and 100000 at 1.0 × 10⁶, 1.0 × 10⁵, and 3.0 × 10⁴ PFU ml−1, respectively. The numbers of detected virus particles were plotted against virus titer as a percentage against the total number of analyzed reactors (Fig. 4d). The plot showed fine linearity against the virus titer, giving a count-to-PFU ratio (CTPR) of 375. We also conducted DIViC with a conventional microscope for comparison, which gave a CTPR of 683. The detection efficiency of DIViC on the MobIP, compared with that of microscope-based DIViC, was 55%, essentially consistent with the above-mentioned value (60%). The CTPR value determined with the microscope was evidently higher than that previously reported for DIViC (189).44 However, this value is within the range of values reported in the literature (8.0 to 2000) [for details see Table S1† in ref. 44]. The instability of the CTPR value can be attributed to the sensitivity of the CTPR to preparation and storage procedures.
000, 45000, and 100000 at 1.0 × 10⁶, 1.0 × 10⁵, and 3.0 × 10⁴ PFU ml−1, respectively. The numbers of detected virus particles were plotted against virus titer as a percentage against the total number of analyzed reactors (Fig. 4d). The plot showed fine linearity against the virus titer, giving a count-to-PFU ratio (CTPR) of 375. We also conducted DIViC with a conventional microscope for comparison, which gave a CTPR of 683. The detection efficiency of DIViC on the MobIP, compared with that of microscope-based DIViC, was 55%, essentially consistent with the above-mentioned value (60%). The CTPR value determined with the microscope was evidently higher than that previously reported for DIViC (189).44 However, this value is within the range of values reported in the literature (8.0 to 2000) [for details see Table S1† in ref. 44]. The instability of the CTPR value can be attributed to the sensitivity of the CTPR to preparation and storage procedures.
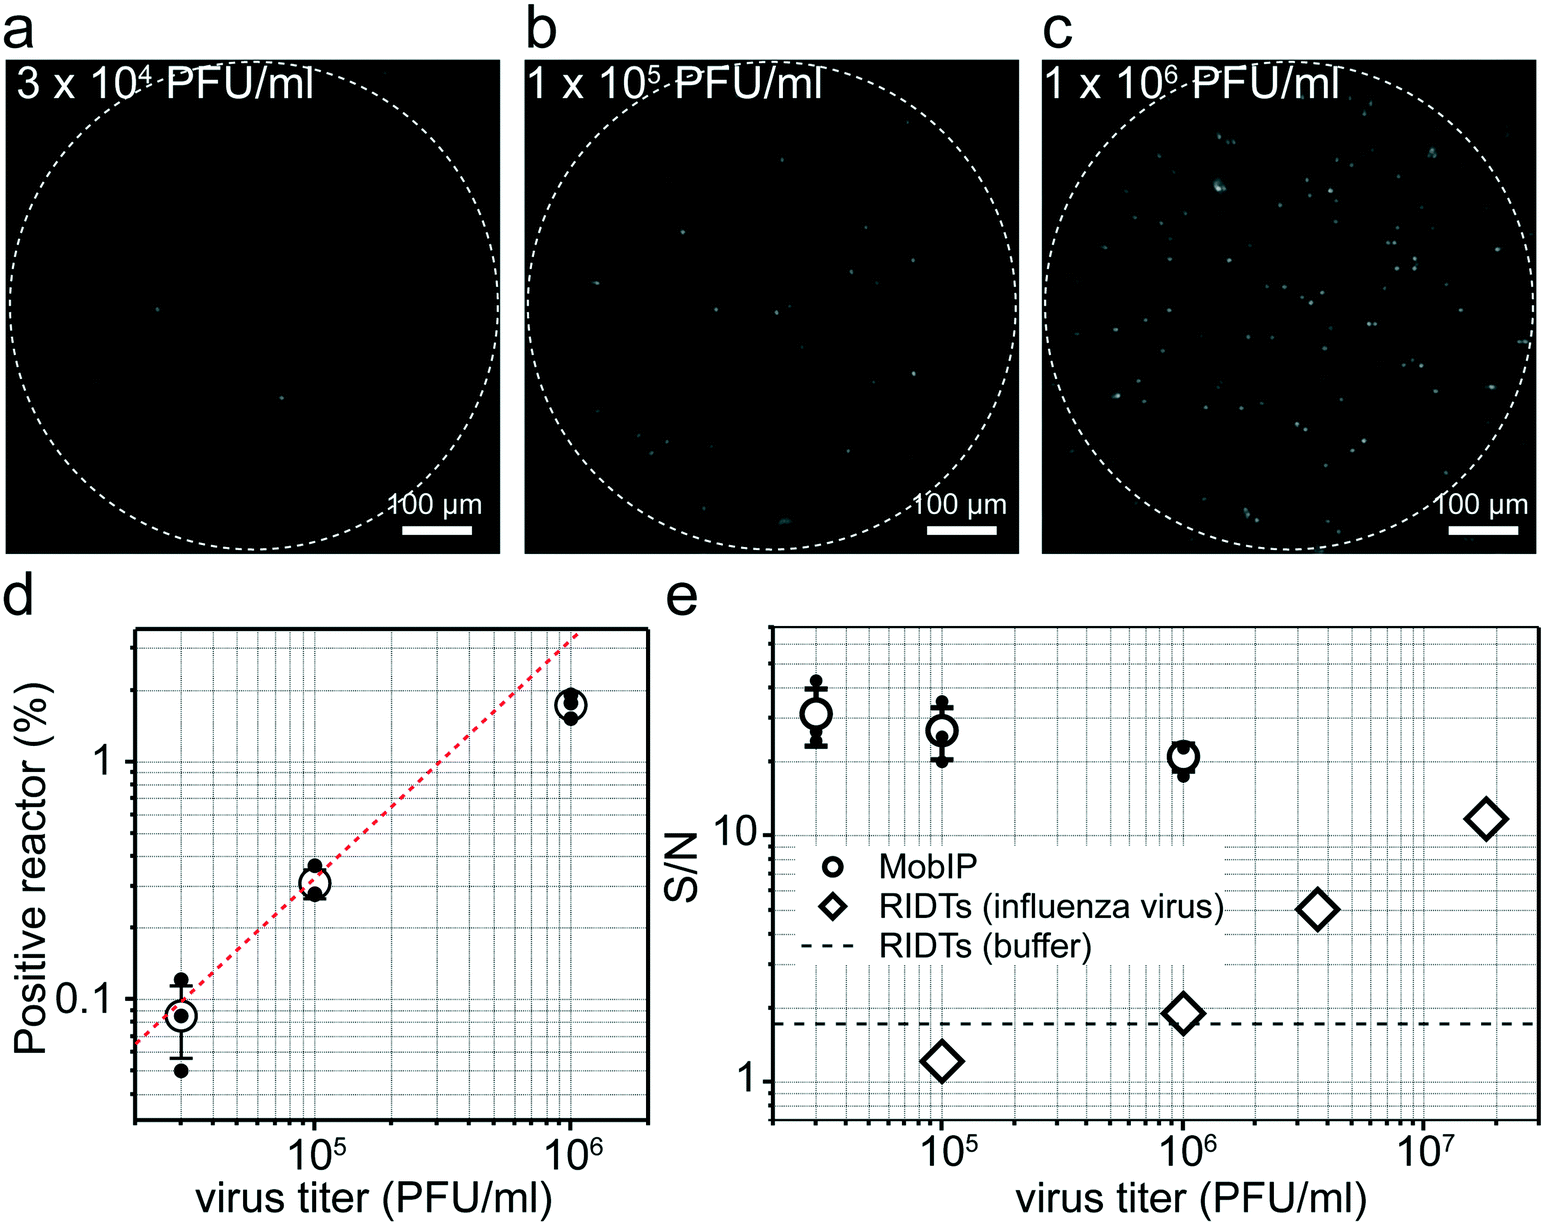 | ||
| Fig. 4 Image of digital influenza virus counting (DIViC) with the mobile imaging platform (MobIP) at different virus titers. (a–c) Representative fluorescence images of DIViC obtained with the MobIP at different virus titers [A/PR/8/1934(H1N1)] of 3.0 × 10⁴, 1.0 × 10⁵, and 1.0 × 10⁶ PFU ml−1. (d) Positive reactor against virus titer. Linear fitting gave a count-to-PFU ratio of 375. (e) The ratio of fluorescence intensity of positive reactors to background noise against virus titer. For comparison, the S/N ratio of a commercial rapid influenza diagnostic test was determined (Fig. S4†). The open circle and diamond show the S/N at various virus titers for the MobIP and RIDTs, respectively. The dotted lines show the S/N of reaction buffer not containing influenza virus for RIDTs as reference. | ||
The ratio of the fluorescence signal from positive reactors to background noise (signal-to-noise ratio: S/N) was essentially constant with the analyte concentration of the virus titer, as observed in other digital bioassays. Meanwhile, slight decay was observed at higher titers (Fig. 4e). This is due to the background noise increase that is attributable to stray light from fluorescence emissions from positive reactors that increase at higher virus titers.
Then, we compared the sensitivity of DIViC on the MobIP with rapid influenza diagnostic tests (RIDTs) (Fig. S4†), with the idea of using DIViC on the MobIP for diagnostic tests. While RIDTs showed clear signals at 3.6 × 10⁶ PFU ml−1, the signal color band was not observed at 1.0 × 10⁶ PFU ml−1 or lower, where S/N was around the S/N of the reaction buffer (Fig. 4e). Here, the signal intensity and background noise were analyzed from photoimages of RIDT devices (see Fig. S4†). The lowest virus titer, which gives distinct fluorescent spots in DIViC on the MobIP, was 3.0 × 10⁴ PFU ml−1. This comparison reveals that DIViC with the MobIP was at least 100 times more sensitive than with the RIDTs. It should be noted that at or less than 1.0 × 10⁴ PFU ml−1, fluorescent spots were not found at all. Such disappearance of fluorescent spots was not observed in DIViC on a conventional microscope. Although the reason is unclear, it should be attributed to the image processing protocol of the built-in software in the smartphone.
Finally, we investigated the feasibility of DIViC on the MobIP for analysis of clinical samples. To explore the possibility of clinical tests with less burden for patients, we tested two oral gargle samples from patients who were identified as influenza-positive by using RIDTs of their nasal swab. The types of influenza virus in the gargle were identified by RT-PCR as type A (H3N2) and type B, as reported.44 The fluorescence images of DIViC with the MobIP showed positive reactors (Fig. 5a and b). When compared with the assay with the pure sample, the fluorescence signal was lower, suggesting that the neuraminidase activity of influenza virus in the clinical samples is lower than that of the laboratory strain. In addition, the background signal was also relatively higher, probably due to impurities or contaminants derived from the patient's mouth fluid. Same as the assays with pure solution, all positive reactors found with the MobIP were confirmed with a conventional microscope. The detection efficiency of positive reactors of clinical samples A and B with the MobIP compared with conventional microscopy was 16% and 10%, respectively. The lower detection efficiency could be attributed to the lower activity of the clinical samples and the higher background signal. Thus, it was demonstrated that the MobIP enables DIViC of clinical samples although the lower S/N of fluorescence images has to be improved for the development of diagnostic assays.
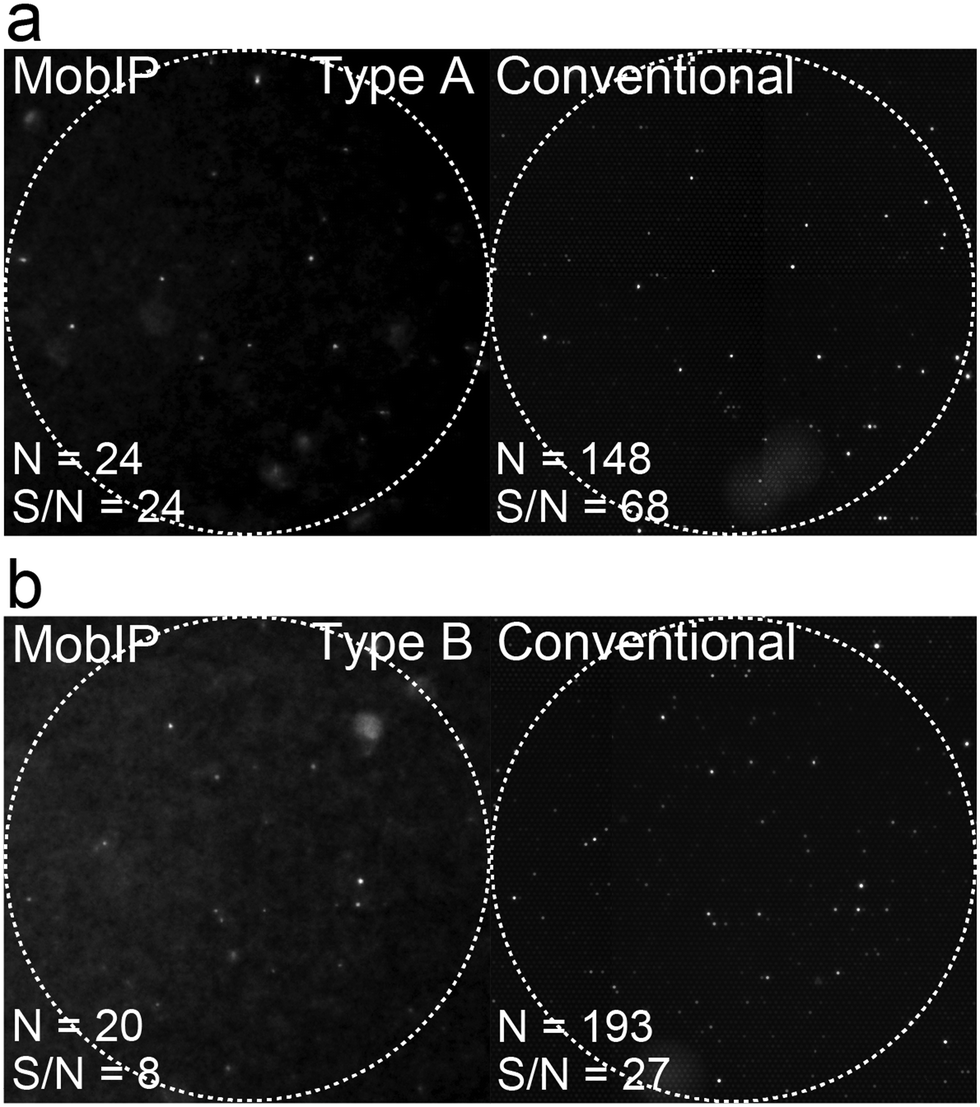 | ||
| Fig. 5 Image of digital influenza virus counting (DIViC) with the mobile imaging platform (MobIP) by the use of clinical samples. Clinical sample test by DIViC with the MobIP. Fluorescence image obtained with the MobIP (left) and a corresponding image taken with a conventional microscope (right) for gargle containing influenza type A (a) and type B (b) identified by RT-PCR. White dashed circles indicate the area subjected to analysis. N means the number of positive reactors. S/N means the signal to noise ratio. | ||
4. Conclusions
We developed a simple smartphone-based mobile imaging platform (MobIP) for the detection of digital bioassays. To achieve low noise fluorescence imaging with a simple optical setup, we employed evanescent field illumination by introducing incident light from the side of a femtoliter reactor array device (FRAD). Background noise was largely reduced, allowing detection of fluorescence from femtoliter reactors encapsulating a single molecule of bovine alkaline phosphatase (bALP) or a single particle of influenza virus. Although the images obtained with the MobIP were distorted due to spherical aberration and the spatial resolution of the MobIP is lower than that of conventional microscopy, the MobIP enabled a quantitative digital bioassay of bALP and digital influenza virus counting (DIViC). The detection efficiency of DIViC with the MobIP was 60%, in relation to DIViC using conventional fluorescence microscopy. This difference is due to the relatively lower S/N of imaging with the MobIP than that of conventional microscopy and the intrinsically higher particle-to-particle variance of neuraminidase activity. Even with this detection sensitivity, DIViC with the MobIP showed 100 times greater sensitivity than a commercial rapid influenza diagnostic test.These results suggest that DIViC with a MobIP is suitable for a new generation of point-of-care testing, enabling extremely sensitive detection of the influenza virus, and therefore diagnostic tests at the early phase of infection. The demonstration of the assay with clinical samples supports this result.
However, there are several technical challenges for further development of diagnostic tests. Firstly, the optical system has to be optimized to improve the spatial aberration and the spatial resolution. This would enable image analysis of more densely arrayed reactors with smaller volume, leading to a wider dynamic range as well as a swifter assay. The higher background signal found in the assays with clinical samples also remains to be addressed for a reliable diagnostic test with clinical samples.
Author contributions
H. N. conceived and coordinated this project; Y. M. and H. U. designed the optics and experimental platform; Y. M. developed the custom smartphone app and performed the digital assay and data analysis; K. V. T. gave technical support and conceptual advice; and H. N. and Y. M. wrote the manuscript.Conflicts of interest
The authors declare no conflicts of interest.Acknowledgements
This research was supported by the ImPACT Program of Council for Science, Technology, and Innovation (Cabinet Office, Government of Japan) to K. V. T. (No. 2015-PM14-01-01). We thank Y. Kawaoka for providing influenza virus samples. We thank Y. Kawaguchi (UTokyo) for conducting digital bioassays for the influenza virus and bALP and data analysis. We thank E. Chiyoda (UTokyo) for FRAD preparation work.References
- D. Witters, B. Sun, S. Begolo, J. Rodriguez-Manzano, W. Robles and R. F. Ismagilov, Lab Chip, 2014, 14, 3225–3232 RSC.
- Y. Zhang and H. Noji, Anal. Chem., 2017, 89, 92–101 CrossRef CAS.
- L. Cohen and D. R. Walt, Annu. Rev. Anal. Chem., 2017, 10, 345–363 CrossRef CAS.
- Y. Rondelez, G. Tresset, T. Nakashima, Y. Kato-Yamada, H. Fujita, S. Takeuchi and H. Noji, Nature, 2005, 433, 773–777 CrossRef CAS.
- Y. Rondelez, G. Tresset, K. V. Tabata, H. Arata, H. Fujita, S. Takeuchi and H. Noji, Nat. Biotechnol., 2005, 23, 361–365 CrossRef CAS.
- D. R. Walt, Chem. Soc. Rev., 2010, 39, 38–50 RSC.
- S. Sakakihara, S. Araki, R. Iino and H. Noji, Lab Chip, 2010, 10, 3355–3362 RSC.
- R. B. Liebherr, M. Renner and H. H. Gorris, J. Am. Chem. Soc., 2014, 136, 5949–5955 CrossRef CAS.
- D. Wu, E. Katilius, E. Olivas, M. Dumont Milutinovic and D. R. Walt, Anal. Chem., 2016, 88, 8385–8389 CrossRef CAS PubMed.
- K. Zhang, D. K. Kang, M. M. Ali, L. Liu, L. Labanieh, M. Lu, H. Riazifar, T. N. Nguyen, J. A. Zell, M. A. Digman, E. Gratton, J. Li and W. Zhao, Lab Chip, 2015, 15, 4217–4226 RSC.
- Z. Guan, Y. Zou, M. Zhang, J. Lv, H. Shen, P. Yang, H. Zhang, Z. Zhu and C. J. Yang, Biomicrofluidics, 2014, 8, 014110 CrossRef.
- R. A. White, 3rd, P. C. Blainey, H. C. Fan and S. R. Quake, BMC Genomics, 2009, 10, 116 CrossRef.
- H. C. Fan and S. R. Quake, Anal. Chem., 2007, 79, 7576–7579 CrossRef CAS.
- B. J. Hindson, K. D. Ness, D. A. Masquelier, P. Belgrader, N. J. Heredia, A. J. Makarewicz, I. J. Bright, M. Y. Lucero, A. L. Hiddessen, T. C. Legler, T. K. Kitano, M. R. Hodel, J. F. Petersen, P. W. Wyatt, E. R. Steenblock, P. H. Shah, L. J. Bousse, C. B. Troup, J. C. Mellen, D. K. Wittmann, N. G. Erndt, T. H. Cauley, R. T. Koehler, A. P. So, S. Dube, K. A. Rose, L. Montesclaros, S. Wang, D. P. Stumbo, S. P. Hodges, S. Romine, F. P. Milanovich, H. E. White, J. F. Regan, G. A. Karlin-Neumann, C. M. Hindson, S. Saxonov and B. W. Colston, Anal. Chem., 2011, 83, 8604–8610 CrossRef CAS.
- S. H. Kim, S. Iwai, S. Araki, S. Sakakihara, R. Iino and H. Noji, Lab Chip, 2012, 12, 4986–4991 RSC.
- D. M. Rissin, C. W. Kan, T. G. Campbell, S. C. Howes, D. R. Fournier, L. Song, T. Piech, P. P. Patel, L. Chang, A. J. Rivnak, E. P. Ferrell, J. D. Randall, G. K. Provuncher, D. R. Walt and D. C. Duffy, Nat. Biotechnol., 2010, 28, 595–599 CrossRef CAS.
- I. E. Araci, M. Robles and S. R. Quake, Lab Chip, 2016, 16, 1573–1578 RSC.
- L. Mazutis, A. F. Araghi, O. J. Miller, J. C. Baret, L. Frenz, A. Janoshazi, V. Taly, B. J. Miller, J. B. Hutchison, D. Link, A. D. Griffiths and M. Ryckelynck, Anal. Chem., 2009, 81, 4813–4821 CrossRef CAS.
- A. Gansen, A. M. Herrick, I. K. Dimov, L. P. Lee and D. T. Chiu, Lab Chip, 2012, 12, 2247–2254 RSC.
- Z. Wu, C. H. Zhou, L. J. Pan, T. Zeng, L. Zhu, D. W. Pang and Z. L. Zhang, Anal. Chem., 2016, 88, 9166–9172 CrossRef CAS.
- R. Watanabe, N. Soga, D. Fujita, K. V. Tabata, L. Yamauchi, S. Hyeon Kim, D. Asanuma, M. Kamiya, Y. Urano, H. Suga and H. Noji, Nat. Commun., 2014, 5, 4519 CrossRef CAS.
- N. Soga, R. Watanabe and H. Noji, Sci. Rep., 2015, 5, 11025 CrossRef.
- R. Watanabe, T. Sakuragi, H. Noji and S. Nagata, Proc. Natl. Acad. Sci. U. S. A., 2018, 115, 3066–3071 CrossRef CAS.
- K. Akama, K. Shirai and S. Suzuki, Anal. Chem., 2016, 88, 7123–7129 CrossRef CAS PubMed.
- S. M. Scherr, D. S. Freedman, K. N. Agans, A. Rosca, E. Carter, M. Kuroda, H. E. Fawcett, C. E. Mire, T. W. Geisbert, M. S. Unlu and J. H. Connor, Lab Chip, 2017, 17, 917–925 RSC.
- D. Sevenler, G. G. Daaboul, F. Ekiz Kanik, N. L. Unlu and M. S. Unlu, ACS Nano, 2018, 12, 5880–5887 CrossRef CAS.
- H. Takehara, K. Miyazawa, T. Noda, K. Sasagawa, T. Tokuda, S. H. Kim, R. Iino, H. Noji and J. Ohta, Jpn. J. Appl. Phys., 2014, 53, 04EL02 CrossRef.
- H. Takehara, M. Nagasaki, K. Sasagawa, H. Takehara, T. Noda, T. Tokuda and J. Ohta, Jpn. J. Appl. Phys., 2016, 55, 3S2 CrossRef.
- M. Zarei, TrAC, Trends Anal. Chem., 2017, 91, 26–41 CrossRef CAS.
- A. Roda, E. Michelini, M. Zangheri, M. Di Fusco, D. Calabria and P. Simoni, TrAC, Trends Anal. Chem., 2016, 79, 317–325 CrossRef CAS.
- S. K. Vashist, P. B. Luppa, L. Y. Yeo, A. Ozcan and J. H. T. Luong, Trends Biotechnol., 2015, 33, 692–705 CrossRef CAS.
- Q. Wei, H. Qi, W. Luo, D. Tseng, S. J. Ki, Z. Wan, Z. Gorocs, L. A. Bentolila, T. T. Wu, R. Sun and A. Ozcan, ACS Nano, 2013, 7, 9147–9155 CrossRef CAS PubMed.
- M. Kuhnemund, Q. Wei, E. Darai, Y. Wang, I. Hernandez-Neuta, Z. Yang, D. Tseng, A. Ahlford, L. Mathot, T. Sjoblom, A. Ozcan and M. Nilsson, Nat. Commun., 2017, 8, 13913 CrossRef CAS.
- H. Zhu, S. Mavandadi, A. F. Coskun, O. Yaglidere and A. Ozcan, Anal. Chem., 2011, 83, 6641–6647 CrossRef CAS.
- S. J. Yeo, K. Choi, B. T. Cuc, N. N. Hong, D. T. Bao, N. M. Ngoc, M. Q. Le, K. Hang Nle, N. C. Thach, S. K. Mallik, H. S. Kim, C. K. Chong, H. S. Choi, H. W. Sung, K. Yu and H. Park, Theranostics, 2016, 6, 231–242 CrossRef CAS.
- L. Shen, J. A. Hagen and I. Papautsky, Lab Chip, 2012, 12, 4240–4243 RSC.
- S. Feng, D. Tseng, D. Di Carlo, O. B. Garner and A. Ozcan, Sci. Rep., 2016, 6, 39203 CrossRef CAS.
- J. E. Kong, Q. Wei, D. Tseng, J. Zhang, E. Pan, M. Lewinski, O. B. Garner, A. Ozcan and D. Di Carlo, ACS Nano, 2017, 11, 2934–2943 CrossRef CAS PubMed.
- P. B. Lillehoj, M. C. Huang, N. Truong and C. M. Ho, Lab Chip, 2013, 13, 2950–2955 RSC.
- H. Guner, E. Ozgur, G. Kokturk, M. Celik, E. Esen, A. E. Topal, S. Ayas, Y. Uludag, C. Elbuken and A. Dana, Sens. Actuators, B, 2017, 239, 571–577 CrossRef CAS.
- Y. Liu, Q. Liu, S. Chen, F. Cheng, H. Wang and W. Peng, Sci. Rep., 2015, 5, 12864 CrossRef CAS.
- T. Laksanasopin, T. W. Guo, S. Nayak, A. A. Sridhara, S. Xie, O. O. Olowookere, P. Cadinu, F. Meng, N. H. Chee, J. Kim, C. D. Chin, E. Munyazesa, P. Mugwaneza, A. J. Rai, V. Mugisha, A. R. Castro, D. Steinmiller, V. Linder, J. E. Justman, S. Nsanzimana and S. K. Sia, Sci. Transl. Med., 2015, 7, 273re271 Search PubMed.
- V. Yelleswarapu, J. R. Buser, M. Haber, J. Baron, E. Inapuri and D. Issadore, Proc. Natl. Acad. Sci. U. S. A., 2019, 116, 10 CrossRef.
- K. V. Tabata, Y. Minagawa, Y. Kawaguchi, M. Ono, Y. Moriizumi, S. Yamayoshi, Y. Fujioka, Y. Ohba, Y. Kawaoka and H. Noji, Sci. Rep., 2019, 9, 1067 CrossRef.
- A. J. Eisfeld, G. Neumann and Y. Kawaoka, Nat. Protoc., 2014, 9, 2663–2681 CrossRef CAS.
- S. Ramachandran, D. A. Cohen, A. P. Quist and R. Lal, Sci. Rep., 2013, 3, 2133 CrossRef PubMed.
Footnotes |
| † Electronic supplementary information (ESI) available. See DOI: 10.1039/c9lc00370c |
| ‡ These authors contributed equally to this work. |
| This journal is © The Royal Society of Chemistry 2019 |