
 Open Access Article
 This Open Access Article is licensed under a Creative Commons Attribution-Non Commercial 3.0 Unported Licence
Relative extent of triple Auger decay in CO and CO2
A.
Hult Roos
a,
J. H. D.
Eland
ab,
J.
Andersson
a,
M.
Wallner
a,
R. J.
Squibb
a and
R.
Feifel
 *a
*a
aDepartment of Physics, University of Gothenburg, Origovägen 6B, 412 96 Gothenburg, Sweden. E-mail: raimund.feifel@physics.gu.se
bDepartment of Chemistry, Physical and Theoretical Chemistry Laboratory, Oxford University, South Parks Road, Oxford OX1 3QZ, UK
First published on 17th April 2019
Abstract
Systematic measurements on single and triple Auger decay in CO and CO2 after the creation of a C 1s or a O 1s core vacancy show that the percentage of triple Auger decay is on the order of 10−2 of the single Auger decay in these molecules. The fractions of triple Auger decay are compared with triple Auger fractions for carbon atoms and some noble gas atoms, and are found to follow a linear trend correlated to the number of valence electrons on the atom with the initial core vacancy and on its closest neighbours. This linear trend for the percentage of triple Auger decay is represented by a predictive equation TA = 0.13·Nve − 0.5.
Multielectron processes upon the relaxation of a core vacancy in atomic and molecular systems are of great interest for many fields in physics. Auger decay is the most common non-radiative process in which a system relaxes after the creation of a core vacancy, and the full understanding of this process is important in fields such as plasma physics1,2 and astrophysics.3,4 The single Auger (SA) decay of a system, in which one electron from an outer shell fills the core vacancy while another electron is ejected into the continuum, results in a final doubly charged ion product and two electrons in the continuum. For higher order Auger decay, such as double Auger (DA) and triple Auger (TA) decay, the relaxation processes are more complex because of increased multi-electron interaction and an increased number of possible intermediate and final triple and quadruple hole states, respectively. The DA decay after creation of a core vacancy in atoms has been interpreted both theoretically5,6 and experimentally,7,8 and the relative extent of DA in atoms can be estimated from ion mass spectra.9,11,12 In molecules, multiple Auger decay is even more complex and has only recently been studied experimentally13–15 in a few cases for DA decay. Molecular vibrations and dissociation mechanics come into play, as well as larger systems with higher number of valence electrons, which greatly increases the difficulty to interpret multiple Auger decays.
Studies of triple Auger decay are still very limited, with just a few experimental7,16,17 and theoretical26,27 investigations on atoms. The relative abundance of triple Auger decay in atoms can be estimated from previous studies on ion mass11 and multi-electron spectroscopy.7,17 However, the relative abundances of triple Auger decay in molecules have, to our knowledge, never been investigated theoretically or experimentally.
We here present a systematic investigation on the relative abundance of triple Auger decay in CO and CO2 after C 1s and O 1s photoionization. The present investigation is based on the combination of synchrotron radiation and a magnetic bottle time-of-flight spectrometer, which is especially suitable for multi-electron coincidence studies because of its very high electron collection and detection efficiency over a large electron kinetic energy interval. The main focus of this investigation is to establish the extent of triple Auger compared to single Auger decay in small, relatively common molecules, complementing our previous studies14,15 on the relative abundance of double Auger decay.
Experimental
The experiments were carried out at beam line UE56-2 PGM-2 of the electron storage ring BESSY-II at the Helmholtz Zentrum Berlin. The electron storage ring was operated in single bunch mode with a ring cycle period of about 800.5 ns for the electron. The Auger decay measurements were performed with a magnetic bottle time-of-flight electron spectrometer, which has been described in detail before (see ref. 28), so here we recount only the specific arrangement and relevant information for the present study. The magnetic bottle collects essentially all electrons over a large kinetic energy interval that are emitted in an ionization event, and guides them through a 2 m long flight tube towards a microchannel plate (MCP) detector. The flight time of the electrons are measured in reference to the synchrotron radiation pulses, and registered in multi-coincidence to each ionization event. The flight times of the electrons are converted to kinetic energy by a comparatively simple formula given in ref. 28. The calibration of the flight time to energy conversion is based on well-known Auger and photoelectron lines of Kr, Ar, and Ne.29–31 The resolution of the spectrometer ranges from about 50 meV at low (1 eV) kinetic energies to about 10 eV for electrons with a kinetic energy of 600 eV.The collection and detection efficiency, which hereafter, in brief, is termed as the composite quantity “collection efficiency”, was kept strictly unchanged throughout all the measurements by keeping all the physical parameters like the electric and magnetic fields constant once optimized for the relevant kinetic energy range. The absolute value of the collection efficiency also depends on the gain of the MCP detector (typically with a detection efficiency of 55–65%), determined by the applied voltage, and on the settings of the gain and discriminator levels in the detector electronics, all of which were kept constant.
Treatment of false coincidences and background
At the count rate used in the present work, there are about 2–4% accidental coincidences in the measurements, because of the relatively high count rate (∼3 kHz) chosen for the experiment. Under these coincidence conditions, a rate of only about 103 TA decay events per hour is obtained. Even though the accidental coincidences are just a few percent of the total, SA and DA events still contaminate the quadruple ionization data because of the low rate of TA events. Accidental coincidences affect the DA signal the most, because of the large overlap between the DA and SA spectra.Many unwanted coincidences are true coincidences derived mainly from SA electrons detected at the same time as a spurious electron of low (0–5 eV) kinetic energy. These “low kinetic” electrons stem mostly from fast Auger or photoelectrons from another ionization events about 0.8–3 μs after the true event that reach the MCP detector within the same time window as the electrons from a relevant Auger event. The amount of such false coincidences in each run can be estimated and carefully subtracted from the DA and TA ionization spectra. Although most of the false coincidences are subtracted in this way, the percentage of DA obtained from these measurements will not be as accurate as in our previous study15 because of the relatively large energy overlap between the SA and DA ionization spectra. The TA spectra are not affected as much as the DA spectra because of the high energy required for quadruple ionization, resulting in a smaller energy overlap. Even though it is a small overlap the accidental coincidences will make a small contribution to the constant background in the TA spectra from both SA and DA, which introduces minor contributions to the relatively large error bars for the percentage of TA to SA decay.
Major sources of false and unwanted coincidences are the secondary electrons released by primary photo- or Auger electrons that collide with surfaces in the spectrometer. These must be minimized during the measurements or subtracted in the data analysis afterwards. The largest contributions of these unwanted coincidences in the TA data can be traced back to SA and DA events, where primary Auger electrons hit a surface and generate secondary electrons while the associated photoelectron is detected normally. The secondary electrons generated are of rather low energy, contributing to the coincidence signal at high apparent triple or quadruple ionization energies. Their effect can be greatly reduced by selection of events with total electron energy sums corresponding to the correct energy range for the relevant Auger electrons. But if a photoelectron from a single or multiple Auger event hits a surface and generates secondary electrons, while the corresponding Auger electrons are detected in the usual way, the summed electron energy is likely to be in an acceptable energy range for the Auger event. This problem can be ameliorated by selection of Auger events coincident with another electron in an acceptable energy range for ionization of the core electron. By such stratagems the majority of the unwanted and accidental coincidences are subtracted from the spectra.
Primary electrons may also lose energy in inelastic collisions with gas or surfaces, but still reach the detector. After background subtraction, the resulting “tails” can have total integrated intensity of the order of 10–20% of the primary triple Auger peak. These tails add to the total uncertainty for the percentage of triple Auger obtained in this study, explaining the relatively wide error bars in the numbers of TA events in the spectra. Much of the background on the lower ionization side of the triple Auger spectrum could be removed by subtracting the amount of SA and DA present (and the respective tail) from the TA spectra, which is estimated as 2–4% in each measurement from the amount of accidental coincidences. After the subtraction of accidental coincidences, a background level to the triple Auger spectrum was estimated from the background in the quadruple ionization coincidence map. The background level was estimated by taking the coincidence counts on the sides of the photoelectron line over a total energy range equal to that of the photoelectron line. The total background subtracted amounted to about 10–15% of the TA counts, and this is fully accounted for in the final uncertainty of the fractions of TA.
Determination of the electron collection efficiency
The combined collection-detection efficiency, fe, was determined over the full energy range from single Auger decay measurements on neon, argon, and krypton. The method used for determining the collection efficiency is explained in detail in ref. 15. The efficiency, which is fitted with a second order polynomial to the data points, is close to 55% at low kinetic energies and goes up to 65% at around 300 eV, before dropping slowly down to about 39% at an electron energy of 780 eV. One of the main sources of uncertainty for the percentage of the amount of Auger decay originates from the uncertainty in the collection efficiency and from the fit. When the collection efficiency is known it is possible to subtract the amount of TA that is present in both the SA and DA spectrum, as well as the amount of DA in the SA spectrum, which has been taken into account for in the uncertainty.By plotting the kinetic energies of the electrons against each other in coincidence maps, we find that the energy sharing between the first and second TA electrons is highly asymmetric, as also occurs in DA decay.5,14,15 Only in a negligible fraction of TA events do two of the electrons share their total kinetic energy equally. This is in agreement with the theoretical work on direct triple Auger decay in atoms by Liu et al.,27 who conclude that the probability density for equal energy sharing between the three Auger electrons is very small, while one fast and two slower electrons are favoured. No clear asymmetric energy sharing with the third electron and any of the other two electrons can be seen in the coincidence maps, which may be explained by the third electron mainly having a low (2–10 eV) kinetic energy. Since a large part of the TA intensity is concentrated at the low and high ends of the energy distribution, the common collection efficiency for the three electrons may be approximated as the geometric mean of the electrons at high respectively low energy in the distribution, just as in the case of double Auger decay.14,15
Results and discussion
Characteristics of the spectra
The triple Auger electron coincidence spectra (quadruple ionization) for CO and CO2 after C 1s and O 1s photoionization can be seen in Fig. 1 and 2, respectively. In the figures the ionization energy is plotted as the photon energy minus the sum of the total kinetic energy of the four electrons emitted in the photoionization and Auger processes. In these spectra the background has been subtracted and the relevant TA data were selected as described above. From the figures it is possible to estimate the onset for quadruple ionization after a C 1s core hole formation as about 125 and 115 eV for CO and CO2, respectively. The onset for quadruple ionization after the creation of a O 1s hole can be estimated as about 105 and 95 eV for CO and CO2, respectively. However with the limited experimental resolution and statistics, the accuracy of these onset values is estimated as ±5 eV.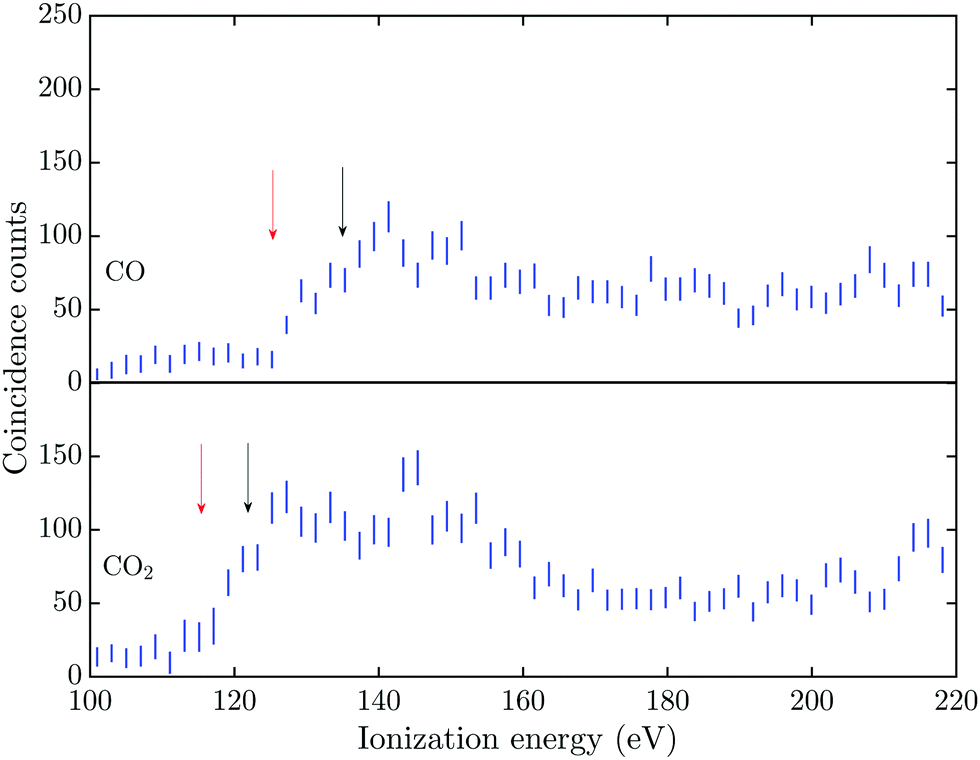 | ||
| Fig. 1 Triple Auger electron coincidence spectra (quadruple ionization), associated with the C 1s photoelectron line, for CO and CO2 taken at a photon energy of 311 eV. Accidental coincidences and background have been subtracted from the spectra and incorporated in the 2σ error bars. The red and black arrows mark the estimated onset and lowest vertical quadruple ionization energies, respectively. | ||
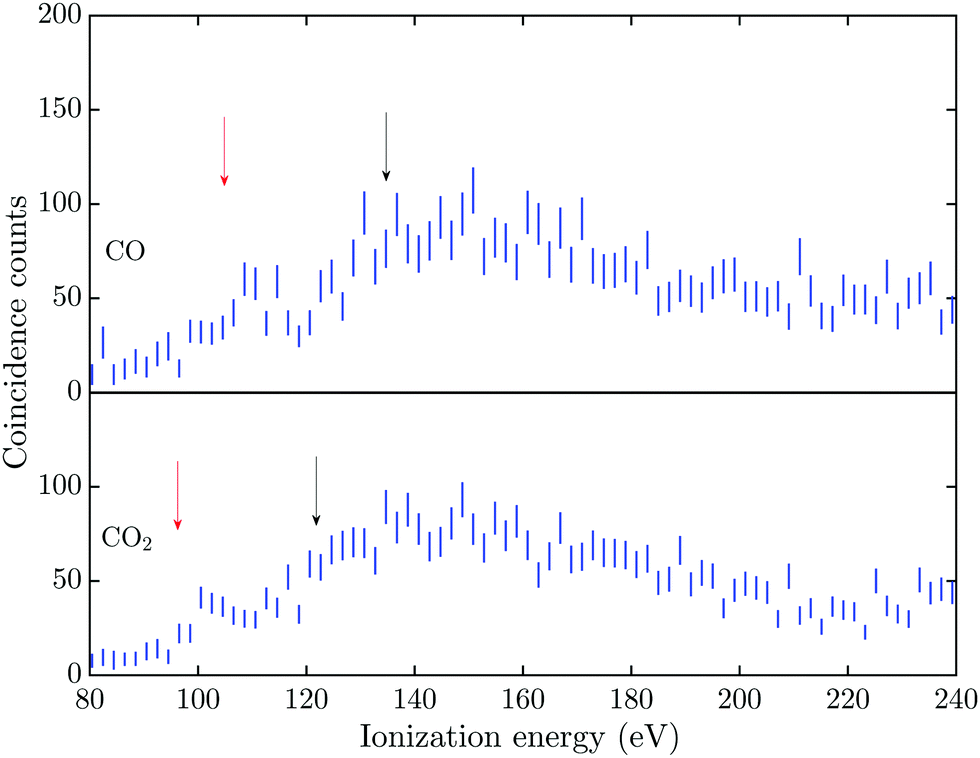 | ||
| Fig. 2 Triple Auger electron coincidence spectra (quadruple ionization), associated with the O 1s photoelectron line, for CO and CO2 taken at a photon energy of 565 eV. Accidental coincidences and background have been subtracted from the spectra and incorporated in the 2σ error bars. The red and black arrows mark the estimated onset and lowest vertical quadruple ionization energies, respectively. | ||
The dissociation processes for CO and CO2 following or leading up to quadruple ionization after photoionization or Auger decay have not been studied in detail, so the direct and indirect electronic pathways are mostly unknown. Quadruply ionized CO has two known fragmentation channels, namely CO4+ → C2+ + O2+ and CO4+ → C3+ + O+,18–20 with the first channel being much more intense than the second.21 The enthalpy of formation, in the electronic ground states, for the C2+ + O2+ channel is about 95.5 eV and for the C3+ + O+ channel it is about 108.3 eV.22,23 With a total kinetic energy release (KER) of about 40 eV and 30 eV for the respective channels,18,20 the vertical quadruple ionization energy to the progenitor states of these dissociation pathways may be estimated as about 135 eV and 138 eV. The two dominant dissociation channels for CO24+ are the CO24+ → C2+ + 2O+![[thin space (1/6-em)]](https://www.rsc.org/images/entities/char_2009.gif) 24 and the CO24+ → CO2+ + O2+ → O+ + C+ + O2+ fragmentation channel,25 with the latter channel being the only one showing evidence of two step fragmentation. The enthalpy of formation, in the electronic ground states, for the C2+ + 2O+ channel is about 79.5 eV and for the O2+ + C+ + O+ channel it is about 90.2 eV.22,23 The total KER for these channels was obtained by Wang et al.,21 with the lowest KER for the C2+ + 2O+ fragmentation being about 42.5 eV and for the O2+ + C+ + O+ channel about 43 eV. This gives a vertical quadruple ionization energy of about 122 eV and 133 eV for formation of the respective progenitor states.
24 and the CO24+ → CO2+ + O2+ → O+ + C+ + O2+ fragmentation channel,25 with the latter channel being the only one showing evidence of two step fragmentation. The enthalpy of formation, in the electronic ground states, for the C2+ + 2O+ channel is about 79.5 eV and for the O2+ + C+ + O+ channel it is about 90.2 eV.22,23 The total KER for these channels was obtained by Wang et al.,21 with the lowest KER for the C2+ + 2O+ fragmentation being about 42.5 eV and for the O2+ + C+ + O+ channel about 43 eV. This gives a vertical quadruple ionization energy of about 122 eV and 133 eV for formation of the respective progenitor states.
The energies for the estimated vertical transitions in CO and CO2 fit reasonably well to the shoulders rising from the onset of the quadruple ionization energies in Fig. 1 after C 1s photoionization, but after O 1s ionization the onsets for quadruple ionization are significantly lower than the estimated vertical energies. This suggests a significant participation by indirect dissociative decay pathways, with lifetimes greater than a few fs, in both CO and CO2 when an O 1s vacancy initiates the triple Auger decay. The true fractions of indirect and direct pathways in CO and CO2 cannot be estimated from the exisiting data, so this study focuses on the total quantity of triple Auger decay by all pathways. Many of the intermediate states in the energy region for direct triple Auger decay will be highly dissociative and consequently give rise to broad overlapping bands. The total triple Auger decay fraction is the prime quantity that has to be taken into account when, for example, interpreting ion yield data upon Auger decay, or in evaluating the true fraction of double Auger decay in simple molecules.14,15
Proportions of triple to single Auger decay and their interpretation
The percentage of triple Auger decay in comparison to single Auger decay, TA/(TA + SA), is obtained from the apparent amount of SA and TA, which have to be corrected for the relevant collection efficiency. The correction factor for the ratio between TA and SA is given by the expression fcorr = fSAe/(fTAe1·fTAe2·fTAe3), where fSAe is the collection efficiency for the SA electron and fSAe1/e2/e3 are the collection efficiencies for the three electrons emitted in the TA process. The expression for the correction factor can be simplified to fe = fSAe/(fTAe)3, where the common collection efficiency for the TA electrons is estimated as the geometric mean of the three Auger electrons, as explained above. The correction factors for CO and CO2 are 3.45 and 3.14 for C 1s and O 1s vacancies, respectively. The real error bars in these correction factors are very hard to estimate because of all the underlying factors specific to each triple Auger event. However, the statistical uncertainty for the factors can be estimated to about ±10%. The percentage of triple Auger decay derived for CO and CO2 upon C 1s and O 1s photoionization can be seen in Table 1.| Sample | DA [%] | TA [%] |
|---|---|---|
| a Values obtained from ref. 9. b Values obtained from ref. 10. c Values obtained from ref. 14. | ||
| Ne 1s | 5.7 ± 0.5 | 0.38a ± 0.05 |
| 0.3b | ||
| Ar 2p | 9.7 ± 0.8 | 0.4 ± 0.12 |
| 0.35b | ||
| Carbon 1s | ||
| CO | 10.9 ± 1.6 | 0.82 ± 0.17 |
| 9.2c ± 0.8 | ||
| CO2 | 17.1 ± 2.4 | 1.44 ± 0.30 |
| 14.3c ± 1.3 | ||
| Oxygen 1s | ||
| CO | 9.4 ± 1.3 | 0.89 ± 0.19 |
| 9.2c ± 0.9 | ||
| CO2 | 10.5 ± 1.5 | 1.00 ± 0.21 |
| 9.7c ± 0.9 | ||
In Table 1 the percentages of DA to SA decay after ionization of 1s in Ne, 2p in Ar, C 1s in CO, O 1s in CO, C 1s in CO2, and O 1s in CO2 are presented as a benchmark for comparison to previously obtained values. The percentage of DA obtained after Ne 1s is in agreement with our previously obtained values of 5.3% and 5.7%,14,15 and it is also in line with the value of about 6% that Kanngiesser et al.9 obtained for Ne3+ relative to the 1s photoionization of Ne. For the percentage of DA decay in Ar, the value of 9.7% is within the error bars of our previously obtained value of about 9%15 upon 2p photoionization, and is in agreement with the values of 9.1% and 9.4% that Lablanquie et al.7 obtained from photoionization measurements involving the 2p3/2−1 and 2p1/2−1 core holes, respectively. Saito and Suzuki11 obtained about 10% from their electron/ion coincidence measurements, which is also still in line with our value.
The values of 9.4% and 10.5% for the DA percentage in CO and CO2 after O 1s photoionization, respectively, are within the error bars of our previously obtained values of 9.2% and 9.7%,14 respectively. The amount of DA decay in CO and CO2 obtained after C 1s photoionization are about 20% larger than what might be expected from previous measurements.14 The amount of DA obtained in the present study will be less accurate because of the relative large number of accidental coincidences present in the data. Even though a majority of these accidental events can be subtracted in the data analysis, it still adds to the uncertainty of these values.
As a further benchmark, our value of 0.4% for TA decay in Ar after 2p photoionization can be compared to the value 0.18% obtained by Lablanquie et al.7 The rather large difference in the values may be understood by the fact that our value is obtained from integrating TA coincidence counts over a larger energy interval (140–170 eV) than shown in the figure over the triple Auger decay presented in the work of Lablanquie et al.7 Our larger interval includes structure in between about 152 and 165 eV, which is not fully present in the ref. 7. If only the structure in the interval between 140–155 eV is integrated we obtain about 0.28 ± 0.1% which is more in line with the indicative value of 0.18 ± 0.1% of Lablanquie et al.,7 considering their measurement was blind to Auger electrons with kinetic energies in the 80–95 eV range. Furthermore, Saito and Suzuki11 obtained 0.35% Ar4+ from Auger decay after 2p ionization, which is in very good agreement with our value to the precision of the error bar.
Our value for the percentage of TA decay in Ar after the decay of a 2p vacancy is also close to the yield of 0.38% triple Auger decay in neon obtained by Kanngiesser et al.9 after 1s ionization, which may be expected because of the similar number of available valence electrons for the Auger decay. Saito and Suzuki obtained a slightly lower value of 0.3% for the percentage of TA in Ne after 1s ionization. The percentage of TA decay in Ne is smaller than in Ar, which may be expected because of the smaller amount of DA decay in Ne compared to Ar (references 14, 15 and therein).
The percentages of triple to single Auger decay in CO and CO2 after C 1s ionization obtained in the present work are 0.82% and 1.44%, respectively, and after O 1s ionization the percentages are 0.89% and 1.0%, respectively. Compared to the percentage of DA in CO and CO2 after the decay of a C 1s and O 1s vacancy decay, respectively, it seems that the amount of TA is on the order 10−1 of the amount of DA decay. This gives the general trend for CO and CO2 where the ratios for SA:DA:TA are on the order of 1:10−1:10−2, for both C 1s and O 1s photoionization. The TA/(TA + SA) ratio increases when the number of available valence electrons for the Auger process increase, which is reminiscent of our related finding in the case of DA decay.14,15
Müller et al.16 found ratios of single- to double- to triple-Auger decay rates in the order of 1:10−2:10−4 in atomic carbon after the creation of a 1s core vacancy, which was later supported theoretically by Zhou et al.26 It may not be surprising that they observe a very low fraction of triple Auger decay in the case of C atoms, as this is the smallest system where the production of triple Auger decay after a K-shell vacancy is possible. The numbers of decay pathways will be very limited in such a system, as the final state will always have the 1s2 electron configuration. The percentage of TA decay in atomic carbon after 1s ionization is about 0.0129%, with an uncertainty of about 50% for the amount of triple Auger decay.
To visualize better and to qualitatively understand the result of this study, and to compare it more easily to previous TA decay studies on atoms, the percentage of triple Auger decay given in Table 1 and the literature values for C and Ne (from ref. 9 and 16) are plotted in Fig. 3versus the number of nearest neighbouring valence electrons available for the Auger process. The reason for plotting the proportion of TA decay in this way is based on a simple model supported by Fermis's golden rule, and is explained in more detail in our previous works on the relative amount of DA decay in molecules.14,15 In molecules the nearest neighbouring valence electrons are all the valence electrons on neighbouring atoms within a range of less than 2 Å from the atom with the initial core hole. This distance is arbitrarily chosen to be less than 2 Å because this is about the O–O distance where the contribution from the inter-atomic transitions in the Auger process may be neglected according to the theoretical investigation by Wormeester et al.32 This simplistic treatment of the percentage of the TA decay will, of course, not include all of the decay pathways and will therefore only be indicative for the general trend for the TA decay.
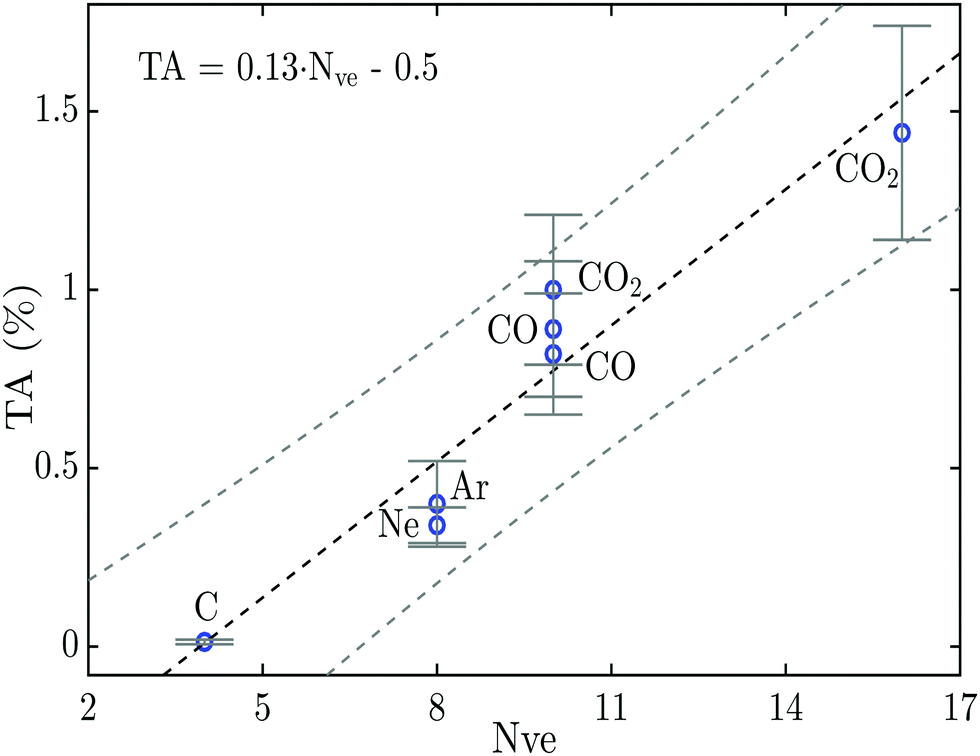 | ||
| Fig. 3 Percentage of triple Auger decay as a function of the closest neighbouring valence electrons. The linear fit (black dashed line) marks the trend for the percentage of TA decay, with a 90% confidence interval (grey dashed lines). | ||
In Fig. 3 a linear trend for the amount of TA decay can be discerned similarly to what was previously seen for the percentage of DA decay in a large numbers of relatively simple molecules.15 The linear trend obtained in Fig. 3 is of the form TA = 0.13·Nve − 0.5, and may be used to get an indicative value for the percentage of TA decay in other atoms and molecules. The value of zero percentage TA decay at 3.8 nearest neighbouring valence electrons seems to fit well with the fact that the carbon atom has 4 electrons available for the Auger process which is the smallest system able to produce TA decay. Even though the linear trend fits well to the data points in Fig. 3, it should be noted that the amount of data on triple Auger decay is still very limited and more measurements are needed to further explore this trend and to assess to what degree atoms and molecules follow the same linear trend.
At the present time, theoretical investigations on TA decay are limited to one study by Liu et al.,27 which is based on calculations with many-body Green's functions for triple Auger decay in the C atom after 1s ionization. They predict that the dominating mechanism for direct triple Auger decay is double knock-out (KO), which is more than one order of magnitude larger than knock-out plus shake-off (SO) or SO + KO, and more than two magnitudes larger than double SO. Sophisticated theoretical TA decay studies on molecules similar to the investigation of DA decay in atoms by Amusia et al.5 will most likely be highly complex; a major problem stems from the need to represent multiple electrons in the continuum and possibly dissociation processes. However, a better understanding of the triple Auger process may help to understand and interpret complex deexcitation mechanisms following highly excited atoms initiated by intense FEL pulses. For small systems such as the carbon atom, the amount of TA decay may be insignificant, but according to the linear trend seen in Fig. 3 the percentage of TA decay could be expected to be on the order of a few percent for larger atoms and molecules. If the trend for TA decay follows the linear trend up above 50 valence electrons, similar to what we could see in our previous studies for the percentage of DA decay,14,15 the percentage of TA would surpass 6%. Therefore it would be highly interesting to have additional experimental and quantum chemical investigations on a larger number of systems and for more complex atoms and molecules.
Conclusions
We have investigated the abundance of triple Auger decay in molecules by means of a highly efficient multi-electron coincidence spectroscopy technique based on a magnetic bottle spectrometer. The relative proportion of triple to single Auger decay in CO and CO2 after C 1s and O 1s photoionization was obtained from experimental quadruple and double ionization spectra, which were carefully corrected in respect to the electron detection and collection efficiency. The measurements show that the triple Auger decay amount to about 0.82% and 1.44% upon the creation of a C 1s vacancy in CO and CO2, respectively, and upon the creation of a O 1s vacancy about 0.89% and 1.0% TA decay was obtained for CO and CO2, respectively. These values were compared to previously obtained values for the percentage of triple Auger decay in the carbon atom and some noble gas atoms, where it was found that the percentage of triple Auger decay seems to follow a linear trend correlated to the number of valence electrons available for the Auger process. Interestingly, the noble gas atoms, and the CO and CO2 molecules seem to follow the same linear trend, based on which one can expect that for systems with a larger number of valence electrons the percentage of triple Auger decay may become significant, up to several percent of the amount of single Auger decay. There is surely a compelling case for further investigation of this subject with additional experiments and quantum chemical calculations.Conflicts of interest
There are no conflicts to declare.Acknowledgements
This work has been financially supported by the Swedish Research Council (VR) and the Knut and Alice Wallenberg Foundation, Sweden. We thank the Helmholtz Zentrum Berlin for the allocation of synchrotron radiation beam time. The research leading to these results has received funding from the European Union's Horizon 2020 research and innovation programme under grant agreement No. 730872. We would also like to warmly acknowledge the staff and colleagues at the Helmholtz Centre for Materials and Energy GmbH BESSY II, Berlin.References
- P. Zimmerer, N. Grün and W. Scheid, Phys. Lett. A, 1990, 148, 457 CrossRef.
- S. M. Vinko, et al. , Phys. Rev. Lett., 2010, 104, 225001 CrossRef CAS PubMed.
- D. L. Mitchell, R. P. Lin, H. Rème, D. H. Crider, P. A. Cloutier, J. E. P. Connerney, M. H. Acuña and N. F. Ness, Geophys. Res. Lett., 2000, 27, 1871 CrossRef CAS.
- C. Mendoza, T. R. Kallman, M. A. Bautista and P. Palmeri, Astron. Astrophys., 2004, 414, 377 CrossRef CAS.
- M. Ya. Amusia, I. S. Lee and V. A. Kilin, Phys. Rev. A: At., Mol., Opt. Phys., 1992, 45, 4576 CrossRef.
- V. A. Kilin and I. S. Li, Sov. Phys. J., 1989, 32, 572 CrossRef.
- P. Lablanquie, L. Andric, J. Palaudoux, U. Becker, M. Braune, J. Viefhaus, J. H. D. Eland and F. Penent, J. Electron Spectrosc. Relat. Phenom., 2007, 156, 51 CrossRef.
- J. Viefhaus, M. Braune, S. Korica, A. Reinköster, D. Rolles and U. Becker, J. Phys. B: At., Mol. Opt. Phys., 2005, 38, 3885 CrossRef CAS.
- B. Kanngiesser, M. Jainz, S. Brünken, W. Benten, Ch. Gerth, K. Godehusen, K. Tiedtke, P. van Kampen, A. Tutay, P. Zimmermann, V. F. Demakhin and A. G. Kochur, Phys. Rev. A: At., Mol., Opt. Phys., 2000, 62, 014702 CrossRef.
- N. Saito and I. H. Suzuki, Phys. Scr., 1994, 49, 80 CrossRef CAS.
- N. Saito and I. H. Suzuki, J. Phys. Soc. Jpn., 1997, 66, 1979 CrossRef CAS.
- D. M. P. Holland, K. Codling, J. B. West and G. V. Marr, J. Phys. B: At. Mol. Phys., 1979, 12, 2465 CrossRef CAS.
- F. Penent, P. Lablanquie, J. Palaudoux, L. Andric, G. Gamblin, Y. Hikosaka, K. Ito and S. Carniato, Phys. Rev. Lett., 2011, 106, 103002 CrossRef CAS PubMed.
- A. Hult Roos, J. H. D. Eland, J. Andersson, S. Zagorodskikh, R. Singh, R. J. Squibb and R. Feifel, Phys. Chem. Chem. Phys., 2016, 18, 25705 RSC.
- A. Hult Roos, J. H. D. Eland, J. Andersson, R. J. Squibb, D. Koulentianos, O. Talaee and R. Feifel, Sci. Rep., 2018, 8, 16405 CrossRef PubMed.
- A. Müller, A. Borovik, Jr., T. Buhr, J. Hellhund, K. Holste, A. L. D. Kilcoyne, S. Klumpp, M. Martins, S. Ricz, J. Viefhaus and S. Schippers, Phys. Rev. Lett., 2015, 114, 013002 CrossRef PubMed.
- P. Lablanquie, M. A. Khalal, L. Andric, J. Palaudoux, F. Penent, J.-M. Bizau, D. Cubaynes, K. Jänkälä, Y. Hikosaka, K. Ito, K. Bučar and M. Žitnik, J. Electron Spectrosc. Relat. Phenom., 2017, 220, 125 CrossRef CAS.
- J. Rajput and C. P. Safvan, Phys. Rev. A: At., Mol., Opt. Phys., 2007, 75, 062709 CrossRef.
- C. Tian and C. R. Vidal, Phys. Rev. A: At., Mol., Opt. Phys., 1999, 59, 1955 CrossRef CAS.
- P. Kumar and N. Sathyamurthy, Pramana, 2010, 74, 49 CrossRef CAS.
- E. Wang, X. Shan, Z. Shen, X. Li, M. Gong, Y. Tang and X. Chen, Phys. Rev. A: At., Mol., Opt. Phys., 2015, 92, 062713 CrossRef.
- B. Ruscic, R. E. Pinzon, M. L. Morton, G. von Laszevski, S. J. Bittner, S. G. Nijsure, K. A. Amin, M. Minkoff and A. F. Wagner, J. Phys. Chem. A, 2004, 108, 9979 CrossRef CAS.
- B. Ruscic, J. Phys. Chem. A, 2015, 119, 7810 CrossRef CAS PubMed.
- C. Wu, C. Wu, Y. Fan, X. Xie, P. Wang, Y. Deng, Y. Liu and Q. Gong, J. Chem. Phys., 2015, 142, 124303 CrossRef PubMed.
- A. Khan, L. C. Tribedi and D. Misra, Phys. Rev. A: At., Mol., Opt. Phys., 2015, 92, 030701(R) CrossRef.
- F. Zhou, Y. Ma and Y. Qu, Phys. Rev. A: At., Mol., Opt. Phys., 2016, 93, 060501(R) CrossRef.
- P. Liu, J. Zeng and J. Yuan, J. Phys. B: At., Mol. Opt. Phys., 2018, 51, 075202 CrossRef.
- J. H. D. Eland, O. Vieuxmarie, T. Kinugawa, P. Lablanquie, R. I. Hall and F. Penent, Phys. Rev. Lett., 2003, 90, 053003 CrossRef CAS PubMed.
- H. Aksela, S. Aksela and H. Pulkkinen, Phys. Rev. A: At., Mol., Opt. Phys., 1984, 30, 2456 CrossRef CAS.
- L. O. Werme, T. Bergmark and K. Siegbahn, Phys. Scr., 1973, 8, 149 CrossRef CAS.
- Y. Hikosaka, T. Kaneyasu, P. Lablanquie, F. Penent, E. Shigemasa and K. Ito, Phys. Rev. A: At., Mol., Opt. Phys., 2015, 92, 033413 CrossRef.
- H. Wormeester, H. J. Borg and A. van Silfhout, Surf. Sci., 1991, 258, 197 CrossRef CAS.
| This journal is © the Owner Societies 2019 |