Risk assessment of inhalation exposure to VOCs in dwellings in Chongqing, China
Zhu
Cheng
ab,
Baizhan
Li
 ab,
Wei
Yu
*ab,
Han
Wang
ab,
Tujingwa
Zhang
ab,
Jie
Xiong
ab and
Zhongming
Bu
ab
ab,
Wei
Yu
*ab,
Han
Wang
ab,
Tujingwa
Zhang
ab,
Jie
Xiong
ab and
Zhongming
Bu
ab
aJoint International Research Laboratory of Green Buildings and Built Environments, Ministry of Education, Chongqing University, Chongqing, China. E-mail: yuweixscq@126.com
bNational Center for International Research of Low-carbon and Green Buildings, Chongqing University, Chongqing, China
First published on 13th October 2017
Abstract
This paper investigated the concentrations of eight types of indoor VOCs – benzene, toluene, xylenes, butyl acetate, styrene, isopropylbenzene, undecane and formaldehyde. The tests were carried out in 50 dwellings in the main urban areas of Chongqing, China. According to the detected concentration, toluene was the most predominant among all the targeted compounds. Benzene and formaldehyde concentrations were lower than the reference levels regulated by the Chinese National Standard (GB/T 50325). Based on the activity patterns and exposure factors of adults in urban Chongqing, we used concentration data to estimate adults’ inhalation exposures as well as health risks using Monte-Carlo simulations. The results indicated that the exposure doses of benzene and formaldehyde exceeded the benchmark. The highest hazard quotient (HQ) values were found in the case of formaldehyde (median = 0.293 for females and 0.292 for males) and the hazard index (HI) values were 0.326 and 0.325 for females and males, respectively. The highest lifetime cancer risk (LCR) values were found in formaldehyde (median = 7.16 × 10⁻⁵ for females; 6.56 × 10⁻⁵ for males). Formaldehyde was found to be the most important pollutant with relatively high toxic and carcinogenic risk levels, based on the exposure and health assessment. This was followed by benzene, toluene, xylenes and butyl acetate. This study can help us better understand the concentration levels of VOC contaminants in residential buildings, and help select appropriate decoration materials for buildings.
Background
In the past 30 years, there have been high concentrations of various organic compounds in the indoor environment of Chinese urban residential buildings, due to the process of urbanization and modernization.1 Almost half of the total estimated lifetime cancer cases could be attributed to hazardous air pollutants (HAPs) such as indoor VOCs.2 Over the past ten years, there have been increasing numbers of studies focusing on indoor VOC emission all over the world, because indoor VOCs may potentially affect the health of the occupants in the dwellings.3 VOCs can be released from building decoration and renovation materials,3 adhesives, solvents,4 cosmetics, new clothes,5 environmental tobacco smoke (ETS) and even cooking activities.6 Indoor exposure to VOCs can affect human health because people spend more than 80% of their time indoors7 and two-thirds of a day inside their homes.8 The indoor air pollution caused by BTX and formaldehyde poses a variety of acute and chronic adverse effects on human health, such as sick building syndrome (SBS) symptoms,9 respiratory and eye irritation,10 dermal allergies, asthma,11,12 neurotoxicity and pulmonary function damage.13Guo (2003) assessed the lifetime cancer risk for housewives in Hong Kong under the exposure to VOCs during normal indoor activities. The estimated cancer risk for housewives was the highest compared to that of cooks, food service workers, office workers and school students, while the school students with an air-conditioner in the classroom had the lowest cancer risk.6 The pollutant of the highest concern was formaldehyde, given its higher toxic and carcinogenic risk levels, and the next was benzene, based on the health assessment in the apartment buildings in Harbin, China.14 A study found that BTX concentrations in urban dwellings were higher than those in suburban dwellings, while the concentrations in recently renovated homes were greater than those in not renovated dwellings, which means the rapid development of urbanization may influence the indoor environment. It also found that, instead of ETS, decoration materials, solvents and new furniture were the dominant domestic sources of BTX.15 A study in Tianjin, China measured personal VOC exposure for the participants, as well as residential indoor/outdoor, workplace and in vehicle VOC concentrations. The results showed that indoor smoking and recent renovation were the two major factors affecting personal exposure to VOCs based on the time-activity pattern and factor analysis.16 Research on cancer and non-cancer risks posed by indoor exposure in dwellings and public buildings was carried out in European Union (EU) countries. It was found that styrene is exclusively linked to specific consumer products and behaviors. Benzene, toluene, strong outdoor emission sources and outdoor-to-indoor air penetration might have more significant contribution than indoor sources. Benzene and toluene concentrations are related to the differing climatic conditions.17 Among these tested VOCs, formaldehyde, benzene, toluene and xylene were considered to be the most important pollutants in the indoor environment and were the most frequently detected compounds in indoor air.15
Exposure to VOCs greatly varies due to different emission sources, housing characteristics and residents’ time-activity patterns.18,19 Due to the vast territory, there are only limited research studies that have been conducted on the VOC levels in residential dwellings in China. Subsequently, detailed information on different functions of rooms is also limited. Personal exposure could be reasonably estimated from the time-weighted concentrations within the indoor micro-environment of the dwellings.20 Nevertheless, the chosen exposure factors are not based on the targeted population considering regional differences.
Chongqing is located in southwestern China, the upper reaches of the Yangtze River. It is one of four municipalities experiencing rapid urbanization during the last few decades. A large quantity of synthetic building materials is used for construction and decoration of buildings. Tight building envelopes, along with low mechanical ventilation rates for energy efficiency, have led to increased VOC concentrations. Although more and more researchers have paid attention to indoor VOC constituents, investigations with regard to the VOC concentrations and the health risks in Chongqing residences are limited. However, more and more new residential dwellings are being built in major urban areas of China, and most of them are brought into use immediately after completion. Occupants spend most of their time inside their apartments including sitting rooms, bedrooms, and other types of indoor environments, which are all newly built, decorated, and laid out. The indoor air quality of these spaces would have a great effect on the physical health of their occupants. Based on this, the current study is aimed at: (1) investigating the indoor VOC concentrations in Chongqing residences, (2) estimating the inhalation exposure in rooms with different functions, and (3) assessing the corresponding health risks due to the exposure estimates. The eight measured VOCs in residential buildings include benzene, toluene, xylenes, butyl acetate, styrene, isopropylbenzene, undecane and formaldehyde.
Methods
Sampling site and study design
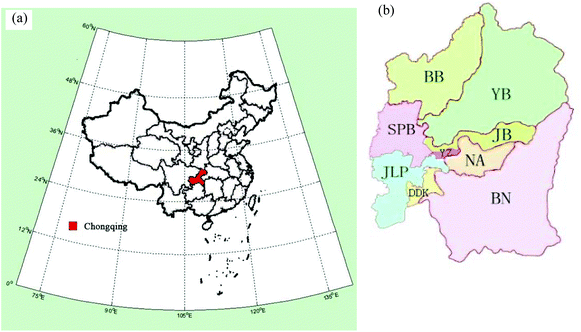
This study was conducted in 50 residential dwellings in Chongqing, China. The on-site tests were performed from November 2014 to February 2015 by the Indoor Environment Test Center at Chongqing University. The fifty tested dwellings were selected from the urban districts of Chongqing, i.e. Shapingba (SPB), Jiangbei (JB), Yubei (YB), Banan (BN), Nanan (NA), Yuzhong (YZ), Dadukou (DDK), Jiulongpo (JLP) and Beibei (BB), as shown in Fig. 1(b). The selected case studies were to meet the following conditions: (1) the dwellings were occupied but not redecorated in the recent 1 year to avoid excessive concentration values from the test results; (2) all the dwellings had to be at least 100 meters away from the main roads to avoid the influence from vehicle emissions; (3) all the dwellings were located in the main urban areas with relatively high population density to conform to the situation of the developing urban areas of China; (4) the house owners were informed about the details of the investigation during the whole sampling process; and (5) the field tests were conducted under sunny weather.Sample collection and chemical analysis
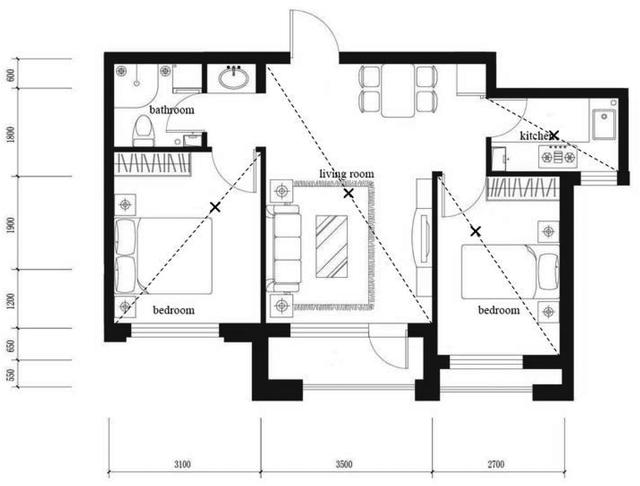
The sampling points were evenly distributed on the diagonal or quincunx of each room as shown in Fig. 2. The number of sampling sites depended on the room size: if the room area is: (1) less than 50 m2, set 1–3 sampling points; (2) 50–100 m2, set 3–5 sampling points; and (3) more than 100 m2, set at least 5 sampling points. Samplers were placed at approximately 1.5 meters above the floor and greater than 0.5 meter to the walls, windows or doors, located as centrally as possible with the given logistic constraints.21 All the sampling points were placed in the rooms by this method.According to the Chinese National Indoor Air Quality Standard (GB/T 18883-2002),21 air samples were collected in 20 minutes at a sampling rate of 500 ml min−1 using an air sampling pump (LP-12, A.P. Buck, Inc.) for formaldehyde. Formaldehyde was absorbed by the 3-methyl-2-benzothiazolinonehydrazone hydrochloride (MBTH) solution and analyzed using UV-VIS spectrometry (WFJ 7200, Unico Corp.) at 630 nm. Benzene, toluene, xylenes, butyl acetate, styrene, isopropylbenzene and undecane were collected in 20 minutes at a sampling rate of 500 ml min−1 using an air sampling pump equipped with Tenax-TA (Markes International Corp.) adsorption tubes. A Dry-cal (Defender 510, Bios International Corp.) was used to calibrate the pumped air flow before and after each sampling process. The tubes were stored at 4 °C in a refrigerator until analysis by gas chromatography-mass spectrometry (GC-MS) based on the Chinese National Standard: Sorbent Adsorption Thermal Desorption and Gas Chromatography (HJ583-2010).22 A GC-MS system (Agilent GC-6890N, MS-5975C) with auto-thermal desorption (TD-100, Markes International Corp.) was used to obtain the VOC concentrations (Table 1). Indoor temperature, relative humidity and atmospheric pressure were recorded when the samples were obtained.
| Device | Type | Temperature | Time |
|---|---|---|---|
| Chromatographic column | HP-5MS 5% | — | — |
| GC | 6890A | 50 °C | 3.2 min |
| Escalation 11 °C min−1 | 13.836 min | ||
| 200 °C | 3 min | ||
| MSD | 5975C | 280 °C | |
| ATD | TD-100 | 325 °C | 5 min |
Pre-cleaned TA-tubes were wrapped in aluminum foil and stored at −20 °C in a refrigerator as field blanks. The repeatability of seven parallel samples had been evaluated in the previous study with the results showing an average repeatability of 7%. The linearity of ATD-GC/MS in response to the target VOCs was evaluated every week, and the linear regression of the spiked masses and the peak areas showed that R2 exceeded 0.998. When the concentration levels were below the method detection limits (MDLs) or were not detected at all, the non-detected values were replaced by half of the MDL for statistical analysis.
Statistical analysis
Statistical analyses were performed with the assistance of Statistical Package for Social Science (SPSS, Version 22, IBM Corp.) with a significance level of p = 0.05. To evaluate the statistical significance of VOC concentration levels in the three different types of rooms, the concentration data were analyzed using t-tests for paired samples. A Shapiro–Wilks test was applied to examine whether the concentration data fit normal or lognormal distribution. In this study, the distribution of pollutants’ concentration matches the lognormal distribution, according to the P–P plot. Since the BTX and formaldehyde concentrations were not normally distributed, the lognormal transformed BTX and formaldehyde concentrations were used for Monte Carlo simulations (see the section Uncertainty and sensitivity analysis).Exposure and health risk assessment
The current standard approach for health risk assessment was originally proposed by the U.S. National Academy of Sciences.23 The four steps of risk assessment are hazard identification, dose–response assessment, exposure assessment, and risk characterization. In this study, we followed the guidelines proposed by the Office of Environmental Health Hazard Assessment (OEHHA) to estimate the exposure doses and health risks.15,24 The targeted areas for adult occupants in the dwellings were living rooms, bedrooms and kitchens.In this study, we used the time-weighted exposure model to predict the personal exposure:
| Ei = ∑Cij × tj, | (1) |
| HQi = Ei/RELi, | (2) |
HQ is the accumulation of non-cancer risks for one compound while the Hazard Index (HI) is the summation of non-cancer risks from multiple compounds.
| HI = ∑HQi. | (3) |
The chronic daily intake associated with inhalation exposure to an individual compound in the dwellings is:
 | (4) |
The lifetime cancer risk (LCR) from a compound/chemical was estimated by a simple multiplication of the CDI and the cancer potency factor (CPF):
| LCRi = CDIi × CPFi | (5) |
Uncertainty and sensitivity analysis
It has been verified from the previous studies that using single point values to estimate the risk for a population can result in great uncertainty.27 Stochastic risk modeling can provide a more accurate population risk assessment than only using field test data. The exposures and risks were estimated by Monte-Carlo simulations.14,28–31 Monte-Carlo simulations and sensitivity analysis were conducted using Oracle Crystal Ball software (Fusion Edition, V. 11.1.2.4).The lognormal distribution was chosen to describe the input data of the BTX and formaldehyde concentrations since it best fit the distributions of naturally occurring pollutants.32 100![[thin space (1/6-em)]](https://www.rsc.org/images/entities/char_2009.gif) 000 trials of Monte-Carlo simulations were performed to calculate the inhalation exposures and health risks. However, in this study, exposure-related parameters, e.g., inhalation rate (IR), exposure frequency (EF) and body mass (BM), can be found in “Time Use Patterns in China”33 and “Exposure Factors Handbook of Chinese Population”.34 These parameters are shown in Table 2.
000 trials of Monte-Carlo simulations were performed to calculate the inhalation exposures and health risks. However, in this study, exposure-related parameters, e.g., inhalation rate (IR), exposure frequency (EF) and body mass (BM), can be found in “Time Use Patterns in China”33 and “Exposure Factors Handbook of Chinese Population”.34 These parameters are shown in Table 2.
| Parameters | Male | Female |
|---|---|---|
| Body weight (kg) | 64 ± 9.90 | 54.9 ± 7.76 |
| Inhalation rate (m3 d−1) | 17.2 ± 1.63 | 14.1 ± 0.82 |
| Exposure duration (years) | 55.16 | 60.6 |
| Average lifetime (years) | 73.16 | 78.60 |
| Time distribution in home (min day−1) | 932 | 1018 |
Results and discussion
The percentages of the different VOCs in the rooms with different functions are presented in Fig. 3. The proportions of BTX and formaldehyde were larger than the others. Styrene was only detected in bedrooms, while undecane was not detected in bedrooms. The concentrations of styrene, isopropylbenzene and undecane were much lower than those of the other VOCs. The percentage of toluene was the highest in all three different types of rooms. Toluene, as a representative of the benzene series, was the most predominant VOC in the dwellings, followed by formaldehyde, xylenes, benzene and butyl acetate. However, BTX was the most abundant type of VOC in indoor air with the mean percentage of 59.9%, 58.9% and 63.6% in living rooms, bedrooms and kitchens, respectively. The mean percentage of formaldehyde was 27.2%, 30.0% and 20.6% in the living rooms, bedrooms and kitchens, respectively, which was lower than those of BTX.The concentrations of isopropylbenzene, styrene and undecane were very low and the detected frequencies were lower than 50%. In particular, styrene was only detected in bedrooms and undecane was only detected in living rooms and kitchens. The contributions of three VOCs, isopropylbenzene, styrene and undecane, were not more than 5% in each room type.
VOC concentrations in indoor air
According to the Chinese standard Code for Indoor Environmental Pollution Control of Civil Building Engineering (GB50325-2010),35 the concentration limits of benzene and formaldehyde in civil buildings are shown in Table 3.| Pollutant | Class 1 civil engineering | Class 2 civil engineering |
|---|---|---|
| Benzene (μg m−3) | ≤90 | ≤90 |
| Formaldehyde (μg m−3) | ≤80 | ≤100 |
Dwellings belong to class 1 civil engineering. Consequently, the concentration limit is 90 μg m−3 for benzene, 50 μg m−3 for TVOC and 80 μg m−3 for formaldehyde. The concentrations of benzene and formaldehyde did not exceed the limits. China has guideline values for only short-term (1 h) exposure to indoor environments.21 The concentration limit for benzene is 110 μg m−3; toluene is 200 μg m−3; xylenes is 200 μg m−3 and formaldehyde is 100 μg m−3. In this study, the mean concentrations of BTX and formaldehyde measured in Chongqing dwellings were lower than the short-term limits. The comparisons with other benchmarks are listed in Table 4.
| Pollutant | WHO | China | Japan |
|---|---|---|---|
| Benzene | 4.4–7.5 × 10⁻⁶ | 110 | — |
| Formaldehyde | 100 | 100 | 100 |
| Toluene | 260 | 200 | 260 |
| Xylene | 870 | 200 | 870 |
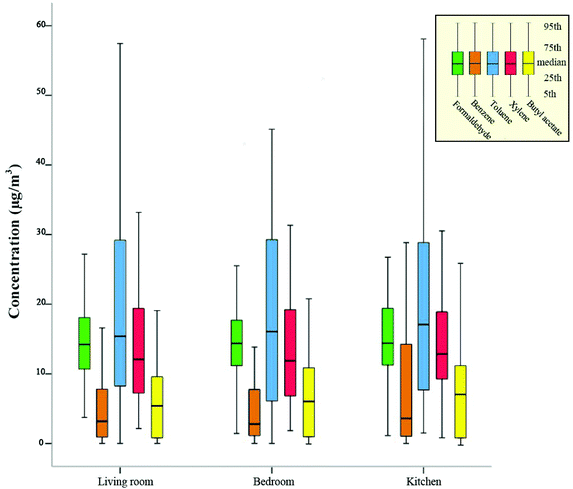
The concentrations of formaldehyde, benzene, toluene, xylenes and butyl acetate in the rooms with different functions are shown in Fig. 4.
All the targeted compounds were detected with over 80% frequencies. Toluene concentrations were the highest among all the compounds with the medians of 15.4, 16.1 and 17.1 μg m−3 in living rooms, bedrooms and kitchens, respectively. Benzene concentration in bedrooms was the lowest with the median of 2.8 μg m−3. And the concentrations of benzene in living rooms and kitchens are 3.2 and 3.6 μg m−3, respectively. The concentrations of benzene, toluene and xylene in kitchens had the highest values compared to those in bedrooms and living rooms. However the concentration of formaldehyde in living room has the highest value. Samples from the three different types of rooms have shown good consistency.
A comparison of BTX and formaldehyde concentrations between the current study and the previous studies is shown in Table 5. It was found that the formaldehyde concentration in the dwellings in Chongqing was roughly 12%–77% of those in other Chinese locations. Compared to other studies, the result of formaldehyde concentration is found to be higher in Huang's study.10 The reason is that Huang tested newly remodeled dwellings in Beijing, while others tested dwellings remodeled more than one year prior to their studies. The benzene concentration obtained from this study was at a similar level as the studies in Athens, Prague and Hong Kong. But it is higher than the concentration values of other European locations, while lower than that of Korea and other Chinese locations (except for Tianjin and Dalian). Toluene concentration was generally lower than that of other locations except for Seoul, Korea. The xylene concentration was similar to that of Beijing, but lower than that of Seoul, Guangzhou and Hong Kong. Since the 1970s, the usage of solvents and adhesives has decreased in developed countries.38 However, renovation and decoration materials (including solvents and adhesives) containing VOCs were widely used in dwellings in China, especially in southwest China.37,39,40 This is the reason that the VOC concentrations in some developed countries were lower than those in Chongqing.
| Ref. | Sampling information | Type | Benzene | Toluene | Xylene | Formaldehyde |
|---|---|---|---|---|---|---|
| Edwards et al. (2001)41 | Helsinki | 2.1 | ||||
| Busoon et al. (2002)18 | Asan, Korean (n = 30) | 20.26 | 17.31 | 19.75 | ||
| Busoon et al. (2002)18 | Seoul, Korean (n = 30) | 43.71 | 170.67 | 60.94 | ||
| Hanninen et al. (2002)42 | Athens (n = 42) | 10.1 | ||||
| Hanninen et al. (2002)42 | Basel (n = 47) | 2.7 | ||||
| Hanninen et al. (2002)42 | Helsinki (n = 188) | 2.2 | ||||
| Hanninen et al. (2002)42 | Milan (n = 41) | 17 | ||||
| Hanninen et al. (2002)42 | Oxford (n = 40) | 3.6 | ||||
| Hanninen et al. (2002)42 | Prague (n = 46) | 8 | ||||
| Stranger et al. (2007)43 | Antwerp, Belgium (n = 18) | 2.5 | ||||
| Schlink et al. (2004)44 | Leipzig, Munchen, Koln (n = 2103) | 3.2 | ||||
| Brown et al. (2002)45 | UK (n = 876) | 3 | ||||
| Colman Lerner et al. (2002)46 | Buenos Aires, Argentina | 2.43 | 7.50 | 7.20 | ||
| Marchand et al. (2008)47 | Strasbourg, France (n = 143) | 32.3 | ||||
| Guo et al. (2003)6 | Hong Kong, China (n = 6) | 4.99 | 59.13 | 8.10 | ||
| Chao et al. (2001)48 | Hong Kong, China (n = 20) | 8.1 | 52.8 | 24.5 | ||
| Zhou et al. (2011)16 | Tianjin, China (n = 10) | 6.13 | 7.47 | 2.02 | 54 | |
| Liu et al. (2009)50 | Beijing, China (n = 152) | 16.3 | 45.2 | 12.3 | ||
| Huang et al. (2013)11 | Beijing, China (n = 410) | 17 | 131 | |||
| Du et al. (2013)15 | Guangzhou, China (n = 43) | 18.5 | 173.2 | 98.9 | ||
| Dalian, China (n = 59) | Bedroom | 2.54 | 13.4 | 7.28 | 33.5 | |
| Kitchen | 2.89 | 13.6 | 7.81 | 32.3 | ||
| Mean | 2.715 | 13.5 | 7.545 | 32.9 | ||
| Zhu et al. (2013)14 | Harbin, China (n = 240) | Bedroom | 15 | 19 | 50 | |
| Living room | 12 | 18 | 100 | |||
| Kitchen | 30 | 24 | 30 | |||
| Study room | 110 | 17 | 110 | |||
| Mean | 41.75 | 19.5 | 72.5 | |||
| Current study | Chongqing, China (n = 50) | Bedroom | 6.6 | 24.4 | 14.3 | 23.2 |
| Living room | 9.1 | 23.6 | 14.2 | 21.3 | ||
| Kitchen | 11.6 | 21.4 | 15.2 | 15.6 |
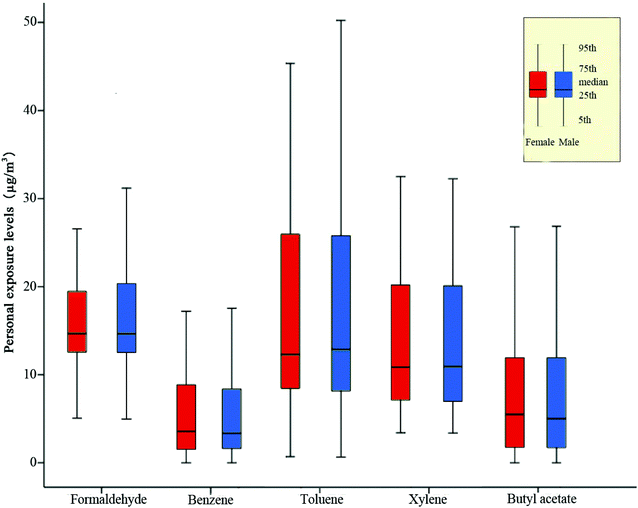
Modeled personal exposure
Fig. 5 shows the statistical summary of the modeled personal exposure to formaldehyde, BTX and butyl acetate. The personal exposure (mean) to every compound in the different types of rooms was lower than 25 μg m−3. Toluene has the highest personal exposure level compared to other compounds. This study focused on the adult population and used the time-weighted exposure model. The exposure durations for male and female are different in the three different types of rooms. The exposure duration (ED) can be calculated from the person's lifetime distribution from “Time Use Patterns in China”.32 As shown in Table 6, the occupants’ time distribution in Chongqing residences is calculated. Occupants spend 57.4% (male) and 53.2% (female) of their time in bedrooms, 27.3% (male) and 30.0% (female) in living rooms, 15.3% (male) and 16.8% (female) in kitchens according to the time use patterns of the Chongqing region.| Room type | Living room | Bedroom | Kitchen |
|---|---|---|---|
| Female | 30.0% | 53.2% | 16.8% |
| Male | 27.3% | 57.4% | 15.3% |
Risk estimation
The targeted compounds and their associated toxicity values are presented in Table 7, including the cancer potency factor (CPF), the inhalation chronic RELs and the cancer benchmark concentrations. In this study, benzene, toluene, xylene, butyl acetate and formaldehyde were selected for risk estimation.| Compounds | Weight of evidence | Cancer potency factor (mg kg−1 day−1) | Cancer benchmark concentrations (μg m−3) | Inhalation chronic RELs (μg m−3) | |
|---|---|---|---|---|---|
| IARC | IRIS | ||||
| IARC: International Agency for Research on Cancer; IRIS: Integrated Risk Information System.a NIOSH (National Institute for Occupational Safety and Health) pocket guide to chemical hazards. | |||||
| Benzene | 1 | A | 1.0 × 10⁻¹ | 0.03 | 60 |
| Toluene | — | — | — | — | 300 |
| Xylene | — | — | — | — | 700 |
| Formaldehyde | 2A | B1 | 2.1 × 10⁻² | 0.17 | 9 |
| Butyl acetatea | 710![[thin space (1/6-em)]](https://www.rsc.org/images/entities/char_2009.gif) 000 000 |
||||
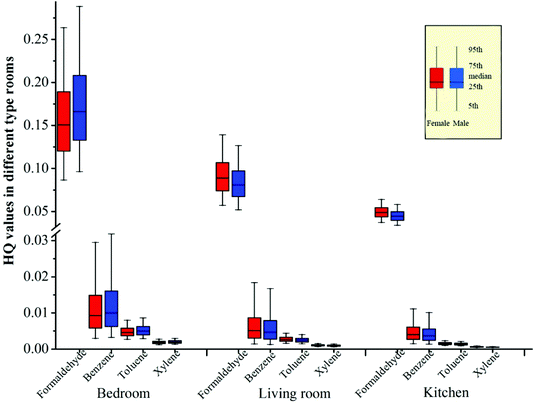
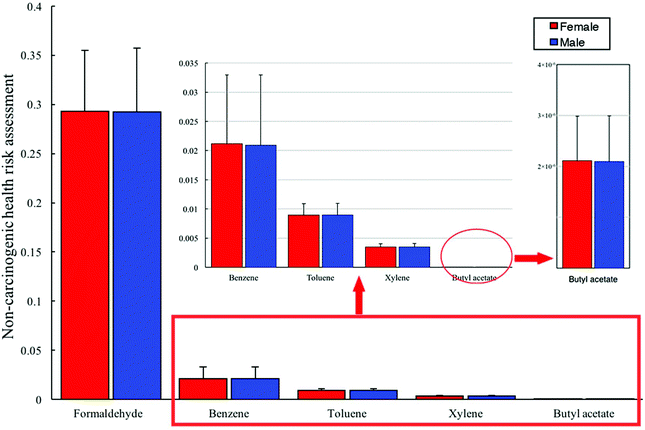
Human health will probably be affected by any compound with a HQ value over 1. The inhalation chronic RELs for BTX and formaldehyde used in this study were 60, 300, 700 and 9 μg m−3 respectively (Table 7). In the Monte Carlo simulations, 100![[thin space (1/6-em)]](https://www.rsc.org/images/entities/char_2009.gif) 000 trials were conducted to guarantee a comprehensive coverage of the distribution. The hazard index (HI) was used to assess the risk associated with BTX. Compared to other VOCs, formaldehyde had the highest HQ values (median) of 0.292 for males and 0.293 for females, while butyl acetate had the lowest HQ values of 2.09 × 10⁻⁶ for males and 2.11 × 10⁻⁶ for females. The HI values of BTX were 0.334 for males and 0.333 for females. The HQ values of benzene, toluene, xylenes and formaldehyde and the HI values of BTX were all lower than 1. The results from the Monte Carlo simulations showed that human health would not be affected by exposure to BTX and formaldehyde. According to Fig. 7, the HQ value of benzene and the HI value of BTX for males were higher than those for females. The risk was mainly from benzene and formaldehyde. Meanwhile, the HQ value of formaldehyde in bedrooms was higher compared to that in other rooms. In order to improve the quality of indoor environments, the first thing to do is to improve the bedroom environment and focus on reducing formaldehyde and benzene concentrations.
000 trials were conducted to guarantee a comprehensive coverage of the distribution. The hazard index (HI) was used to assess the risk associated with BTX. Compared to other VOCs, formaldehyde had the highest HQ values (median) of 0.292 for males and 0.293 for females, while butyl acetate had the lowest HQ values of 2.09 × 10⁻⁶ for males and 2.11 × 10⁻⁶ for females. The HI values of BTX were 0.334 for males and 0.333 for females. The HQ values of benzene, toluene, xylenes and formaldehyde and the HI values of BTX were all lower than 1. The results from the Monte Carlo simulations showed that human health would not be affected by exposure to BTX and formaldehyde. According to Fig. 7, the HQ value of benzene and the HI value of BTX for males were higher than those for females. The risk was mainly from benzene and formaldehyde. Meanwhile, the HQ value of formaldehyde in bedrooms was higher compared to that in other rooms. In order to improve the quality of indoor environments, the first thing to do is to improve the bedroom environment and focus on reducing formaldehyde and benzene concentrations.
Although non-carcinogenic effects rarely reach or exceed the most conservative safety thresholds, the exception is formaldehyde.16 The impact of formaldehyde on human health was the largest in Chongqing.
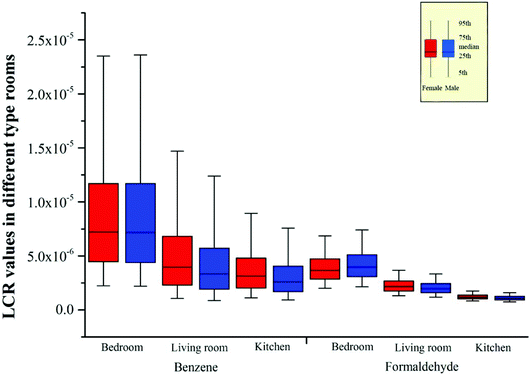
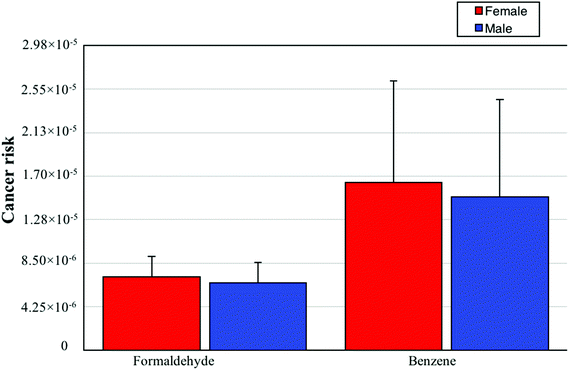
If the LCR value of a compound is higher than 1.0 × 10⁻⁶, it means that the concentration of this compound in this microenvironment imposes cancer risk. Fig. 9 shows that the LCR values of benzene and formaldehyde in dwellings in Chongqing are all higher than the acceptable value (1.0 × 10⁻⁶). Female occupants who are active in the dwellings have a higher cancer risk (1.64 × 10⁻⁵ for benzene and 7.16 × 10⁻⁶ for formaldehyde) than male occupants (1.49 × 10⁻⁵ for benzene and 6.56 × 10⁻⁶ for formaldehyde). This indicates that all the tested dwellings could potentially cause cancer.
Since the LCR values of benzene and formaldehyde for males and females from Monte Carlo simulations are all above 1.0 × 10⁻⁶, it can be concluded that adults would have cancer risk from formaldehyde and benzene.
Although benzene and formaldehyde concentrations in Harbin were higher than those in Chongqing, the LCR posed by formaldehyde and benzene in the 3 different types of rooms are similar in these two areas.6 The reason for such similarity is that the exposure factors such as the inhalation rate were lower, while body weight was higher in Harbin. Bedroom is the part of the residence with the highest LCR. In comparison with Guangzhou, China,15 the LCR in Chongqing was lower than that in Guangzhou. Benzene and formaldehyde concentrations were higher in Guangzhou because the newly renovated dwellings were included in the tests performed in Guangzhou. The exposure factors in Guangzhou were also different from those in Chongqing, and the ED identified is 5 years in Guangzhou's study because of the characteristics of the tested dwellings. Like the studies in Europe, the risk assessment in indoor dwellings indicated that carcinogenic risks are always higher than the 1.0 × 10⁻⁶ “acceptable risk” threshold.16 The most effective way to control the indoor environment is ventilation.
The main indoor sources releasing BTX and formaldehyde include building decoration materials, furniture, toys, consumer products, cosmetics, new clothes, smoking, incense burning, etc. Some measures need to be taken as precautions to reduce the risk to the occupants. To improve the indoor environment, the best way is to increase ventilation which can dilute the concentrations of pollutants and increase the oxygen level. An already existing concept is the use of air cleaners to control the exposure to residential indoor air contaminants.49 In order to reduce the pollutants in indoor air, environmentally friendly building decoration materials and furniture should be used. Ventilation quality should be considered in the design of the dwellings.
Sensitivity analysis
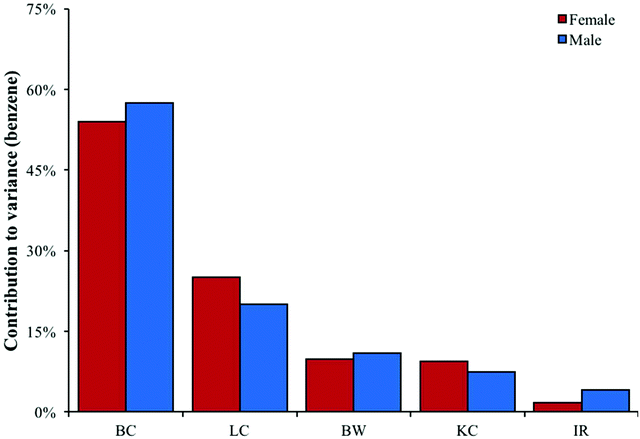
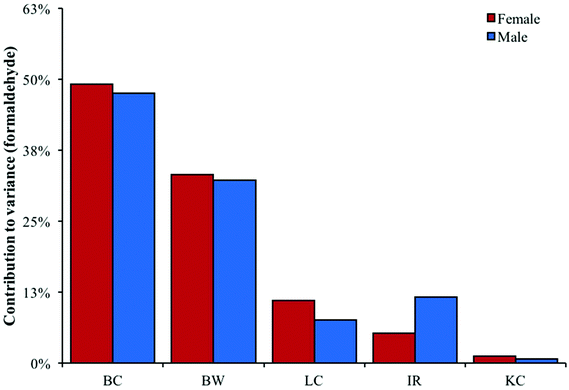
The present study had several limitations with respect to sampling. Firstly, the number of residential dwellings investigated was limited, which may lead to uncertainty and sample bias.51 The emission of indoor VOC sources is highly temperature dependent and can be significantly reduced at lower temperatures. In addition, the indoor gas-phase concentration may be decreased at lower temperatures.37 The impact of variation in input factors on the results for modeled exposures was calculated by sensitivity analysis. The result showed that the bedroom pollutants’ concentrations (BC), living room pollutants’ concentrations (LC) and body weight were predominant in the total exposure variance and kitchen pollutants’ concentrations (KC) and the inhalation rate contributed less than other factors. For benzene exposure, the impact of bedroom concentration, body weight and inhalation rate was greater for males. Nevertheless, for formaldehyde exposure, only the impact of the inhalation rate was greater for males (as shown in Fig. 10 and 11).Limitations
In this study, all the tests were conducted in winter. The emission of pollutants from building materials was highly correlated with temperature. Since Chongqing is located in a hot summer & cold winter climate zone, it is important to consider seasonal variations of indoor VOC levels in the future studies.Inhalation exposure is only a part of health exposure; other pathways such as transdermal absorption and dietary ingestion also need to be considered in order to obtain comprehensive exposure data for human health.
Conclusions
The BTX and formaldehyde concentrations in residences were within the limits suggested by the Chinese standards. As for non-cancer risk, exposures to benzene, toluene, xylenes, butyl acetate and formaldehyde were found to have the HQ values (median) of 0.020, 0.008, 0.003, 2.09 × 10⁻⁶ and 0.292 for males, and 0.021, 0.009, 0.004, 2.11 × 10⁻⁶ and 0.293 for females, respectively. The HI values associated with BTX were 0.033 for males and 0.034 for females. None of the values exceeded the threshold of 1.0. Although the values are below the threshold, it is still recommended to take these pollution factors into consideration, as they can potentially impact the occupants’ health and well-being.The LCR was higher than the threshold of 1.0 × 10⁻⁶, especially the LCR values (median) of benzene are 1.49 × 10⁻⁵ and 1.64 × 10⁻⁵ for males and females, respectively. The LCR values of benzene and formaldehyde for females were higher than those for males, and the LCR values were higher in the bedrooms. According to the research, benzene imposed a higher cancer risk compared to formaldehyde. However, the results indicated that the cancer risks associated with these two compounds were alarmingly higher than others. The estimated cancer risks from benzene for males and females were about ten times higher than the threshold of 1.0 × 10⁻⁶, while the cancer risks from formaldehyde for males (median = 6.56 × 10⁻⁶) and females (median = 7.16 × 10⁻⁶) were still noticeably higher than 1.0 × 10⁻⁶.
The present study provided the details of 8 VOC concentration data and the exposures for males and females in dwellings in the urban area of southwestern China. It can serve as part of a guideline on how to improve the indoor environment in southwestern China. For further research, more data in suburban areas are needed, and the focus of the research will be shifted to other exposure pathways and detailed distributions.
Funding
This study has been supported financially by the China National Key R&D Program “Solutions to heating and cooling of buildings in the Yangtze river region” (Grant No. 2016YFC0700301), and by the National Natural Science Foundation of China Project (NSFC-RCUK_EPSRC) “Low carbon climate-responsive Heating and Cooling of Cities (LoHCool)” (Grant No. 51561135002) and the 111 Program (No. B13041).Ethical statement
The study was approved by the Faculty of Urban Construction and Environmental Engineering, Chongqing University.Conflicts of interest
There are no conflicts of interest to declare.Acknowledgements
We thank all the members of the indoor air quality group in Chongqing University for participating in this study, and all the volunteers for providing information on their apartments. The authors wish to express their special thanks to Xiaoqi Liu for providing help with English language.References
- Y. P. Zhang, J. H. Mo and C. J. Weschler, Reducing Health Risks from Indoor Exposures in Rapidly Developing Urban China, Environ. Health Perspect., 2013, 121(7), 751–755 CrossRef PubMed.
- USEPA, National-Scale Air Toxics Assessment., 2006a, 1999, http://www.epa.gov/ttn/atw/nata1999/index.html, (accessed 1 September 2006) Search PubMed.
- S. K. Brown, Volatile organic compounds in new and established buildings with Melbourne, Australia, Indoor Air, 2002, 12, 55–63 CAS.
- H. Guo, F. Murray and S. Wilkinson, Evaluation of total volatile organic compound emissions from adhesives based on chamber tests, J. Air Waste Manage. Assoc., 2000, 50, 199–206 CAS.
- Indoor Air Quality-A Comprehensive Reference Book, ed. M. Maroni, B. Seifert and T. Lindvall, Elsevier Publishers, 1995 Search PubMed.
- H. Guo, S. C. Lee, W. M. Li and J. J. Cao, Source characterization of BTEX in indoor microenvironments in Hong Kong, Atmos. Environ., 2003, 37, 73–82 CrossRef CAS.
- R. E. Dodson, E. A. Houseman, J. Levy, J. Spengler and J. Shine, et al., Measured and modeled personal exposures to and risks from volatile organic compounds, Environ. Sci. Technol., 2007, 41, 8498–8505 CrossRef CAS PubMed.
- L. P. Zhang and C. Steinmaus, et al., Formaldehyde exposure and leukemia: A new meta-analysis and potential mechanisms, Mutat. Res., 2009, 681, 150–168 CAS.
- A. P. Jones, Indoor air quality and health, Atmos. Environ., 1999, 33, 4535–4564 CrossRef CAS.
- X. J. Tang, Y. Bai, A. Duong, M. Smith and L. Y. Li, et al., Formaldehyde in China: production, consumption, exposure levels, and health effects, Environ. Int., 2009, 35, 1210–1224 CrossRef CAS PubMed.
- L. H. Huang, J. H. Mo, J. Sundell, Z. H. Fan and Y. P. Zhang, Health Risk Assessment of Inhalation Exposure to Formaldehyde and Benzene in Newly Remodeled Buildings, Beijing, PLoS One, 2013, 8(11), e79553, DOI:10.1371/journal.pone.0079553.
- R. E. Dodson, E. A. Houseman, J. Levy, J. Spengler and J. Shine, et al., Measured and modeled personal exposures to and risks from volatile organic compounds, Environ. Sci. Technol., 2007, 41, 8498–8505 CrossRef CAS PubMed.
- L. P. Zhang and C. Steinmaus, et al., Formaldehyde exposure and leukemia: A new meta-analysis and potential mechanisms, Mutat. Res., 2009, 681, 150–168 CAS.
- X. D. Zhu and Y. Liu, Characterization and Risk Assessment of Exposure to Volatile Organic Compounds in Apartment Buildings in Harbin, China, Bull. Environ. Contam. Toxicol., 2014, 92, 96–102 CrossRef CAS PubMed.
- Z. J. Du, J. H. Mo, Y. P. Zhang and Q. J. Xu, Benzene, toluene and xylenes in newly renovated homes and associated health risk in Guangzhou, China, Build. Sci., 2014, 72, 75–81 Search PubMed.
- J. Zhou, Y. You and Z. P. Bai, et al., Health risk assessment of personal inhalation exposure to volatile organic compounds in Tianjin, China, Sci. Total Environ., 2011, 409, 452–459 CrossRef CAS PubMed.
- D. A. Sarigiannis and S. P. Karakitsios, et al., Exposure to major volatile organic compounds and carbonyls in European indoor environments and associated health risk, Environ. Int., 2011, 37, 743–765 CrossRef CAS PubMed.
- B. Son, P. Breysse and W. Yang, Volatile organic compounds concentrations in residential indoor and outdoor and its personal exposure in Korea, Environ. Int., 2003, 29, 79–85 CrossRef CAS PubMed.
- C. D. Jennifer, C. Jia, B. Mukherjee and S. Batterman, Ethnicity, housing and personal factors as determinants of VOC exposures, Atmos. Environ., 2009, 43, 2884–2892 CrossRef.
- R. D. Edwards, J. Jurvelin, K. Saarela and M. Jantunen, VOC concentrations measured in personal samples and residential indoor, outdoor and workplace microenvironments in EXPOLIS-Helsinki, Finland, Atmos. Environ., 2001, 35, 4531–4543 CrossRef CAS.
- GB/T 18883, Standards for indoor air quality, 2002 [in Chinese].
- HJ583, Ambient air-Determination of benzene and its analogies using sorbent adsorption thermal desorption and Gas Chromatography, 2010 [in Chinese].
- National Academy of Sciences, Risk assessment in the federal government: managing the process, National Academy Press, Washington DC, 1983 Search PubMed.
- OEHHA, The air toxics hot spots program guidance manual for preparation of health risk assessments, Office of Environment Health Hazard Assessment, California Environmental protection Agency, 2003 Search PubMed.
- J. C. Caldwell, T. J. Woodruff, R. Morello-Frosch and D. A. Axelrad, Application of health information to hazardous air pollutants modeled in EPA's Cumulative Exposure Project, Toxicol. Ind. Health, 1998, 14, 429–454 CrossRef CAS PubMed.
- T. J. Woodruff, D. A. Axelrad, J. Caldwell, R. Morello-Frosch and A. Rosenbaum, Public health implications of 1990 air toxics concentrations across the United States, Environ. Health Perspect., 1998, 106, 245–251 CrossRef CAS PubMed.
- Z. M. Bu, Y. P. Zhang and D. Mmereki, et al., Indoor phthalate concentration in residential apartments in Chongqing, China: Implications for preschool children's exposure and risk assessment, Atmos. Environ., 2016, 127, 34–45 CrossRef CAS.
- D. Moschandreas, J. Watson, P. D'Abreton, J. Scire, T. Zhu and W. Klein, et al., Chapter three: methodology of exposure modeling, Chemosphere, 2002, 49, 923–946 CrossRef CAS PubMed.
- Y. Hu, Z. Bai, L. Zhang, X. Wang, L. Zhang and Q. Yu, et al., Health risk assessment for traffic policemen exposed to polycyclic aromatic hydrocarbons (PAHs) in Tianjin, China, Sci. Total Environ., 2007, 382, 240–250 CrossRef CAS PubMed.
- Z. Bai, Y. Hu, H. Hu, N. Wu and Y. You, Quantitative health risk assessment of inhalation exposure to polycyclic aromatic hydrocarbons on citizens in Tianjin, China, Bull. Environ. Contam. Toxicol., 2009, 83, 15 CrossRef CAS PubMed; H. M. Liang and C. M. Liao, Modeling VOC-odor exposure risk in livestock buildings, Chemosphere, 2007, 68, 781–789 CrossRef PubMed.
- H. M. Liang and C. M. Liao, Modeling VOC-odor exposure risk in livestock buildings, Chemosphere, 2007, 68, 781–789 CrossRef CAS PubMed.
- W. Ott, A physical explanation of the log normality of pollutant concentrations, J. Air Waste Manage. Assoc., 1990, 40, 1378–1383 CAS.
- NBS, Time Use Patterns in China, China Statistics Press, Department of Social Science and Technology Statistics, National Bureau of Statistics, Beijing, 2010 Search PubMed.
- Ministry of Environmental Protection of the People's Republic of China, Exposure Factors Handbook of Chinese Population, China Environmental Press, 2013, ISBN: 9787511115928 Search PubMed.
- GB50325, Code for indoor environmental pollution control of civil building engineering, 2010 [in Chinese].
- K. Azuma, I. Uchiyama and K. Ikeda, A study on the regulation for indoor air quality in foreign countries, J. Environ. Eng., 2005, 597, 89–96 CrossRef , in Japanese.
- T. Ohura, T. Amagai and X. Y. Shen, et al., Comparative study on indoor air quality in Japan and China: Characteristics of residential indoor and outdoor VOCs, Atmos. Environ., 2009, 43, 6352–6359 CrossRef CAS.
- C. J. Weschler, Changes in indoor pollutants since the 1950s, Atmos. Environ., 2009, 43, 153–169 CrossRef CAS.
- Q. Liu, Y. Liu and M. Zhang, Personal exposure and source characteristics of carbonyl compounds and BTEXs within homes in Beijing, China, Build. Environ., 2013, 61, 210–216 CrossRef.
- H. Liu, Y. X. Liang, S. Bowes, H. Z. Xu, Y. M. Zhou and T. W. Armstrong, et al., Benzene exposure in industries using or manufacturing paint in China e a literature review, 1956–2005, J. Occup. Environ. Hyg., 2009, 6, 659–670 CrossRef CAS PubMed.
- R. D. Edwards, J. Jurvelin, K. Saarela and M. Jantunen, VOC concentrations measured in personal samples and residential indoor, outdoor and workplace microenvironments in EXPOLIS-Helsinki, Finland, Atmos. Environ., 2001, 35, 4531–4543 CrossRef CAS.
- O. O. Hanninen, S. Alm, E. Kaarakainen and M. Jantunen, The EXPOLIS Databases, B13/2002, National Public Health Institute, KTL, Kuopio, 2002 Search PubMed.
- M. Stranger, S. S. Potgieter-Vermaak and R. Van Grieken, Comparative overview of indoor air quality in Antwerp, Belgium, Environ. Int., 2007, 33, 789–797 CrossRef CAS PubMed.
- U. Schlink, M. Rehwagen, M. Damm, M. Richter, M. Borte and O. Herbarth, Seasonal cycle of indoor-VOCs: comparison of apartments and cities, Atmos. Environ., 2004, 38, 1181–1190 CrossRef CAS.
- V. Brown, S. K. D. Coward, D. R. Crump, J. W. Llewellyn, H. S. Mann and J. S. Raw, Indoor air quality in English homes—VOCs, 9th International Conference on Indoor Air Quality and Climate, 2002 Search PubMed.
- J. E. Colman Lerner and E. Y. Sanchez, et al., Characterization and health risk assessment of VOCs in occupational environments in Buenos Aires, Argentina, Atmos. Environ., 2012, 55, 440–447 CrossRef CAS.
- C. Marchand, S. L. Calve, P. Mirabel, N. Glasser, A. Casset and N. Schneider, et al., Concentrations and determinants of gaseous aldehydes in 162 homes in Strasbourg (France), Atmos. Environ., 2008, 42, 505–516 CrossRef CAS.
- C. Y. Chao and G. Y. Chan, Quantification of indoor VOCs in twenty mechanically ventilated buildings in Hong Kong, Atmos. Environ., 2001, 35, 5895–5913 CrossRef CAS.
- R. J. Shaughnessy and R. G. Sextro, What Is an Effective Portable Air Cleaning Device? A Review, J. Occup. Environ. Hyg., 2006, 3, 169–181 CrossRef CAS PubMed.
- Q. Liu, Y. Liu and M. Zhang, Personal exposure and source characteristics of carbonyl compounds and BTEXs within homes in Beijing, China, Build. Environ., 2013, 61, 210–216 CrossRef.
- C. R. Jia, S. A. Batterman and G. E. Relyea, Variability of indoor and outdoor VOC measurements: an analysis using variance components, Environ. Pollut., 2012, 169, 152–159 CrossRef CAS PubMed.
| This journal is © The Royal Society of Chemistry 2018 |

