 Open Access Article
Creative Commons Attribution 3.0 Unported Licence
Thermoelectric stability of Eu- and Na-substituted PbTe†
Xinke
Wang
 a,
Igor
Veremchuk
a,
Ulrich
Burkhardt
a,
Matej
Bobnar
a,
Harald
Böttner
b,
Chang-Yang
Kuo
ac,
Chien-Te
Chen
c,
Chun-Fu
Chang
a,
Jing-Tai
Zhao
a,
Igor
Veremchuk
a,
Ulrich
Burkhardt
a,
Matej
Bobnar
a,
Harald
Böttner
b,
Chang-Yang
Kuo
ac,
Chien-Te
Chen
c,
Chun-Fu
Chang
a,
Jing-Tai
Zhao
 de and
Yuri
Grin
*a
aMax-Planck-Institut für Chemische Physik fester Stoffe, Dresden 01187, Germany. E-mail: grin@cpfs.mpg.de
bRetired from Fraunhofer-Institut für Physikalische Messtechnik, Freiburg 79110, Germany
cNational Synchrotron Radiation Research Center, 101 Hsin-Ann Road, Hsinchu 30076, Taiwan
dSchool of Materials Science and Engineering, Shanghai University, Shanghai 200444, China
eNanophotonics Center, Texas Tech University, Lubbock, Texas 79409, USA
First published on 6th August 2018
Abstract
As one family of the most investigated thermoelectrics (TE), PbTe-based materials have been developed into state-of-the-art p-type and n-type TE materials. However, there are quite a few studies focusing on the reproducibility of TE properties and microstructure evolution during different heat treatments. In this work, Pb0.98−xNa0.02EuxTe (x = 0–0.030) samples were systematically examined after three different kinds of heat treatments: spark plasma sintering (SPS), laser flash measurement (LFA), and long-term annealing. The maximal solubility of Eu (ca. 1.0 atom%) in Pb0.98−xNa0.02EuxTe was established at 873 K. The most inhomogeneous samples (samples after SPS) show highest values of figure-of-merit, ZTmax, of up to 2.1 at 760 K, due to a large number of micrometer-scale sodium- and europium-rich aggregations in them. After additional heat treatment (LFA measurement or long-term annealing), the ZTmax value reduces to 1.6. The distribution of Eu and Na in the samples becomes much more homogeneous, accompanied by increased lattice parameters and decreased carrier concentrations. The long-term annealed samples have the best stable TE properties and good mechanical stability in the cyclic measurements. Surface protection needs to be considered for the temperatures above 773 K in order to avoid material decomposition.
1. Introduction
The efficiency of thermoelectric materials is quantified by the thermoelectric dimensionless figure-of-merit ZT = σS2T/(κel + κL), where T is the absolute temperature, S is the Seebeck coefficient, σ is the electrical conductivity, κel is the electronic thermal conductivity, and κL is the lattice thermal conductivity.1,2 Several approaches have been proposed to enhance ZT in the past few decades, which can mostly be split into two ways: the first is to enhance the power factor (S2σ), e.g. by introducing a resonance level in the valence band,3,4 engineering band convergence,5,6 using electron energy barrier filtering,7–9 and quantum confinement effects.10–12 The other is to reduce the thermal conductivity by nanostructuring,13–17 all-scale hierarchical architectures (atomic/nano/mesostructures),18–20 lattice anharmonicity,21,22 and liquid phonons.23,24 Other ways of thermoelectric improvement are found in some layered anisotropic materials25–27 and even strongly correlated rare-earth or transition metal compounds.28–32Among the thermoelectrics suitable for applications, PbTe-based materials reveal outstanding performance. Sodium and iodine are well documented p- and n-type substituents used for enhancement of the thermoelectric properties of pristine PbTe, respectively.33–36 Significant progress has recently been made in obtaining high ZT in PbTe-based bulk materials using various substitutions.3,18,20,37–46 Lattice thermal conductivity (κL) of PbTe can be minimized by strong phonon scattering through defect formation and nanostructuring.18,41,47 The increase of degenerate valleys of transport bands by reduction of the energy offset between the light (at the L-point of the Brillouin zone) and the heavy (along the Σ-line of the Brillouin zone) sub-valence bands in PbTe leads to an effective band convergence within a few kBT, which improves the Seebeck coefficient without reducing electric conductivity.48–50 Recently reported high ZT p-type materials based on Na-substituted PbTe are summarized in Table 1. Among the 4f rare-earth elements, substitution by Eu has been proven to significantly influence the band structure of PbTe.51,52 Thin films of Pb1−xEuxTe containing quantum wells have been predicted theoretically and confirmed experimentally as a route towards enhanced thermoelectric properties at room temperature (RT).11,53–55 However, no significant influence of the Eu substitution on the thermoelectric figure-of-merit was observed in stoichiometric bulk materials,56 which is in contrast to the behavior of thin films reported in the literature.11,53–55
| Reported systems | Solubility limit of substituents | Temperature range with ZT > 1, along with x values | ZT max, temperature (K) | σ | S | κ L | Ref. |
|---|---|---|---|---|---|---|---|
| a ↓: Decreased with respect to Na-substituted PbTe. ↑: Increased with respect to Na-substituted PbTe. ×: No effect or not mentioned. | |||||||
| Pb0.98Na0.02Te–xSrTe (x ≤ 0.12) | x = 0.05 | 515–923 K | 2.5, 923 | ↓a | ↑a | ↓a | 42 |
| x = 0.08 | |||||||
| Pb0.98Na0.02Te–xMgTe (x ≤ 0.08) | x = 0.04 | 540–923 K | 2.0, 823 | ↓ | ↑ | ↓ | 20 |
| x = 0.06 | |||||||
| Pb1−xYbxTe:Na (x ≤ 0.10) | x > 0.10 | 550–850 K | 1.7, 850 | ↓ | ↑ | × | 41 |
| x = 0.01 | |||||||
| NaxPb0.97−xCd0.03Te (x ≤ 0.02) | No data on the Na solubility limit | 550–800 K | 1.7, 750 | ↓ | × | ↓ | 38 |
| x = 0.012 | |||||||
| PbTe−0.01Na2Te–xHgTe (x ≤ 0.03) | x < 0.02 | 520–800 K | 1.6, 770 | ↓ | ↑ | ↓ | 39 |
| x = 0.02 | |||||||
| Pb1−xMnxTe:Na (x ≤ 0.15) | x < 0.10 | 500–750 K | 1.6, 700 | ↓ | ↑ | ↓ | 44 |
| x = 0.04 | |||||||
| PbTe–0.01Na2Te–xCaTe (x ≤ 0.08) | No data on the CaTe solubility limit | 550–800 K | 1.5, 765 | ↑ | ↓ | ↓ | 37 |
| x = 0.06 | |||||||
| Pb1−x−yEuxNayTe (x ≤ 0.05, y ≤ 0.05) | x > 0.05; no data on the Na solubility limit | 500–850 K | 2.2, 850 | ↓ | ↑ | ↓ | 63 |
| x = 0.03; y = 0.025 | |||||||
All lanthanide (Y, La–Lu) monotellurides adopt the NaCl-type of crystal structure.57,58 It can be expected that all of them may form the respective solid solutions with isostructural PbTe. Almost all of them are three-valent metals and will serve as donors for PbTe.46,58,59 However, in monotellurides, Eu and Sm may be divalent and therefore the electronic balance in a solid solution with PbTe should not change, as was proven experimentally.57,60,61 However, adding a monovalent element like Na to the system may change the electronic configuration of potentially mixed-valence f metal. By introducing Na into the Pb1−xEuxSe system, a part of Eu atoms may change the electron configuration to 4f6.62 Moreover, the study of Pb1−x−yEuxNayTe suggests that the solubility of Na in PbTe increases with increasing EuTe content. With nanometer-scale precipitates and high density of dislocations, a ZTmax of 2.2 at 850 K was reported.63
Nevertheless, the additive role of the Eu- and Na-substitution for ZT enhancement of the PbTe is still unclear, especially from the chemical point of view. The solubility of Na in PbTe was recently shown to be more complex than expected: Na forms two different local arrangements in the crystal structure of PbTe.36 Although there are several previous publications on p-type PbTe materials with high values of ZT (Table 1), and also Pb1−x−yEuxNayTe have been reported,63 there are only a few investigations about the stability (chemical and physical properties) of the studied materials.20,64–66 Moreover, different compositions reported in different publications reveal problems in the reproducibility of the results. That prompts us to carefully consider possible chemical issues for manufacturing quaternary PbTe-based TE materials.
Here we present a systematic investigation of structural and chemical features, carrier transport, and thermoelectric properties in the Eu–Na–PbTe system. We discuss the possibility of using these materials for the thermoelectric applications, based on thermal stability studies of variously heat-treated samples.
2. Experimental details
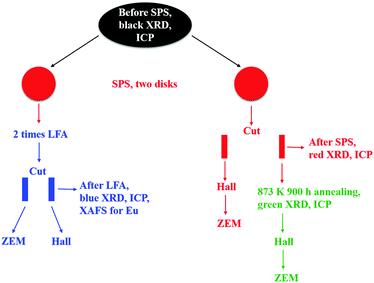
Bulk polycrystalline samples of Pb0.98−xEuxNa0.02Te (x = 0, 0.005, 0.010, 0.015, 0.020, 0.025, 0.030) were synthesized by melting Pb (shot, 99.999 mass%), Te (chunk, 99.9999 mass%), Eu (chunk, 99.95 mass%), and Na (chunk, 99.99 mass%) elements in graphite-coated and fused silica tubes at 1273 K for 6 h under a pressure of around 10−4 Torr, with subsequent annealing at 873 K for six days for homogenization (the as-cast samples are represented by black symbols throughout all figures). The obtained ingots were ground into powders in an agate mortar under an Ar atmosphere before spark-plasma sintering (Fuji SPS-515S setup) at 673 K under a pressure of 60 MPa for 7 minutes. Two disks (∅ = 10 mm, 2 mm thick) for each sample were SPS-manufactured and polished (these samples are represented in figures by red symbols). One disk was first used for thermal diffusivity measurement (Netzsch LFA 457), and then cut for electric transport measurements (the samples are represented in figures by blue symbols). Another one was cut directly for electric property measurements and long-term annealing studies. The cut specimens were sealed in tantalum tubes under an Ar atmosphere around 1 bar in an evacuated fused silica tube for annealing for 900 hours at 873 K (the samples are represented in figures by green symbols). The tubes were quenched in ice water. The experimental strategy of this study is shown in Fig. 1.Phase identification was performed using the X-ray Guinier diffraction technique (Huber G670 camera, Cu Kα1 radiation, λ = 1.54056 Å, Δ2θ = 0.005°, 2θ range 3.0–100°, exposure time 6 × 15 min). The reflection positions, obtained by profile deconvolution, were corrected using an internal standard LaB6 (a = 4.15689(8) Å). Lattice parameter refinement was performed with the program package WinCSD.67
X-ray absorption spectroscopy (XAS) experiments were performed at the Dragon beamline of the National Synchrotron Radiation Research Center (NSRRC) in Taiwan. The Eu M4,5 spectra were recorded at 300 K using the total electron yield (TEY) mode with a photon energy resolution of ∼0.6 eV. Clean sample surfaces were obtained by cleaving the specimens in situ in a vacuum of 1 × 10⁻⁹![[thin space (1/6-em)]](https://www.rsc.org/images/entities/char_2009.gif) mbar. By making weighted sums with the two reference samples EuO and Eu2O3 with the Eu2+ and Eu3+ ions in an octahedron, respectively,68 the relative amounts of Eu2+ and Eu3+ ions were extracted using the “NMimimize” function of the Mathematica software69 to obtain the best fit to the experimental spectrum of each sample.
mbar. By making weighted sums with the two reference samples EuO and Eu2O3 with the Eu2+ and Eu3+ ions in an octahedron, respectively,68 the relative amounts of Eu2+ and Eu3+ ions were extracted using the “NMimimize” function of the Mathematica software69 to obtain the best fit to the experimental spectrum of each sample.
For the metallographic study, the samples were embedded in conductive resin, and subsequently polished, finally using 0.1 μm diamond powder in a slurry. The material homogeneity was examined by optical microscopy (Zeiss Axioplan 2) in bright-field and polarized light. Elemental mappings were produced on an Energy-dispersive X-ray spectroscopy (EDX) system with a silicon-drift detector (SDD: XFlash 6|30; Bruker Quantax 400 system), attached to a Scanning Electron Microscopy (SEM JEOL 7800F) system. Areas of 500 × 500 μm2 were analyzed by stitching 3 × 4 images. A magnification of 200× was chosen to analyze the elemental distribution on a larger scale. All experiments were performed at an acceleration voltage of 10 kV with an exposure time of 60 min per image. Background-subtracted intensities of Pb Mα, Te Lα, Eu Lα, and Na Kα lines are used to visualize the concentration of the elements. Elemental chemical analysis of Pb, Te, Na, and Eu was performed using inductively-coupled plasma optical-emission spectrometry (ICP-OES, Agilent 5100 SVDV setup).
Electrical resistivity (ρ) and Seebeck coefficient (S) were measured simultaneously with the ZEM-3 setup (Ulvac-Riko) in the temperature range from 300 K to 760 K. Thermal diffusivity (D) was established with the Netzsch LFA 457 equipment. The Hall effect (RH) was measured with a standard four-point ac technique in a physical property measurement system (PPMS, Quantum Design), by sweeping magnetic fields up to 9 T. The Hall carrier concentration was calculated as 1/(RH·e), where RH is the Hall coefficient, and e is the charge of an electron. Magnetic susceptibility measurements were performed using a magnetometer system MPMS XL-7 (Quantum Design) in the temperature range 50–400 K and in magnetic fields up to 7 T. The effective magnetic moment per Eu atom was calculated using the Curie–Weiss fitting. Thermal diffusivity (D) was established with Netzsch LFA 457 equipment. The heat capacity per atom (Cp) was estimated from the relation Cp/kB = 3.07 + 0.00047(T − 300).70 Thermal conductivity was calculated as κ = dCpD, where d is the density obtained using the mass and geometric volume of the specimen disk. Lattice thermal conductivity (κL) was calculated by subtracting the electronic part κe = LσT from the total conductivity (the Wiedemann–Franz equation); the Lorenz number is evaluated as L = 1.5 + exp[−(|S|)/116], which is accurate within 20% for PbTe.71 The uncertainty of the Seebeck coefficient and electrical conductivity measurements is 5%, the uncertainty of the thermal conductivity is estimated to be within 8%. The combined uncertainty for the experimental determination of ZT is ∼20%.72
3. Results and discussion
3.1 Phase analysis
The shape of the solid solution of Na and Eu in PbTe is defined by the following lines within the quaternary phase diagram Pb–Eu–Na–Te (Fig. 2a). In the ternary system Pb–Na–Te the substitution method is either according to the scenario Pb1−xNaxTe or Pb1−xNaxTe1−0.5x.36 In the ternary system Pb–Eu–Te the substitution way follows either the scheme Pb1−xEuxTe [ref. 56] or Pb1−xEuxTe1+0.5x [ref. 73]. The homogeneity range of the solid solution of Na and Eu in PbTe is located in the PbTe corner of the orange region in Fig. 2a. The high ZT values of the Pb0.98−xNa0.02EuxTe system are presented in ref. 74 (ZTmax = 1.8) and ref. 63 (ZTmax = 2.2). In order to increase the understanding of those materials, we performed further chemical and physical characterization of the samples on the blue lines Pb0.98−xNa0.02EuxTe (x = 0.005 to 0.030, close to the PbTe corner) located by orange dashed lines (Fig. 2a, bottom). It was found earlier that both of the elements (Eu and Na) individually have limited solubility in binary PbTe, which depends on the substitution scenarios Pb1−xEuxTe (1.0 atom%),56 Pb1−xNaxTe (1.0 atom%),36 and Pb1−xNaxTe1−0.5x (2.5 atom%).36 Under different or additional heat treatments, the solubility of these metals may change.36,56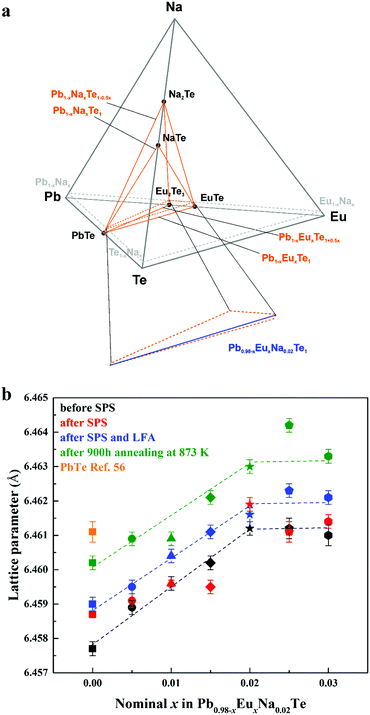 | ||
| Fig. 2 (a) Location of the solid solution of Na and Eu in the phase diagram of the Pb–Eu–Na–Te system. (b) Lattice parameters of Pb0.98−xEuxNa0.02Te before SPS (black), after SPS (red) and LFA (blue), after 900 hours annealing at 873 K (green) along with pristine PbTe (orange square) as a reference.56 | ||
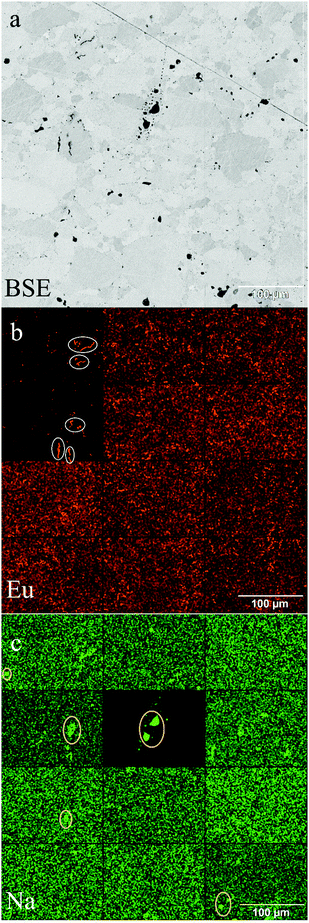
The concentration of 1.0 atom% Na was chosen, because the respective ternary sample revealed the highest charge carrier concentration.36 With increasing Eu content, the lattice parameter increases until x = 0.02 for all studied series of samples, which is unlike the results from ref. 63, where a monotonic increase of the lattice parameter is observed towards x = 0.05. The thermal history of our materials is different in ref. 63. At the same time, additional heat-treatment (SPS, LFA measurements, long-term annealing) increased the lattice parameter, regardless of the sample series (Fig. 2b). The lattice parameters of the samples after SPS and LFA increase linearly; for other series this trend is not so obvious (Fig. 2b). The similar lattice change was observed in the Pb1−xNaxTe series, which was explained by the redistribution of some sodium during the heat treatment.36 Introducing sodium into PbTe leads to either non-balanced Pb-by-Na substitution (rNa < rPb) or aggregation formation of defects in the Te sublattice. In both scenarios, this leads to the reduction of the lattice parameter of the majority phase. The minor amounts of the remaining Te are distributed in the product mixture, and due to the minimal amount cannot be detected easily. The thermal treatment leads to partial removal of sodium from the matrix (Table S1, ESI†) and equilibrium of the structure, which in turn increases the lattice parameter (cf.ref. 36). Introducing europium as the substituent of Pb increases the lattice parameter due to the size difference (rEu > rPb). The latter was already clearly shown in the ternary system Pb–Eu–Te. Based on these and early published data,36 it can be deduced that additional heat treatments increase the homogeneity of the quaternary materials. The analysis of the full width at half maximum (FWHM) of the XRD-reflections indirectly confirms this suggestion (Fig. 3). Only for the samples after long-term annealing, the FWHM values of the respective reflections are the smallest for all series. The inhomogeneity of the samples may originate in the heterogeneous distribution of the sodium and europium (Fig. S1 and S2, ESI†). The metallographic studies for the samples after SPS (believed to be most inhomogeneous) and after long-term annealing (believed to be most homogeneous) were performed. The sample after SPS is strongly inhomogeneous (Fig. 4a). There are a large number of micrometer-sized sodium- and europium-rich aggregations (Fig. 4b and c). The most homogeneous sample (the sample after annealing) looks differently (Fig. 5a). The convex areas are Na-reach zones (Fig. 5c, red circles), the elongated areas are Eu-rich (Fig. 5b, blue circles). Different distributions of Eu and Na, even after long-term annealing, may correspond to the immiscibility of the elements in the liquid state, which can be deduced from the results obtained from investigations of the rare-earth metals–lithium–gallium system.75
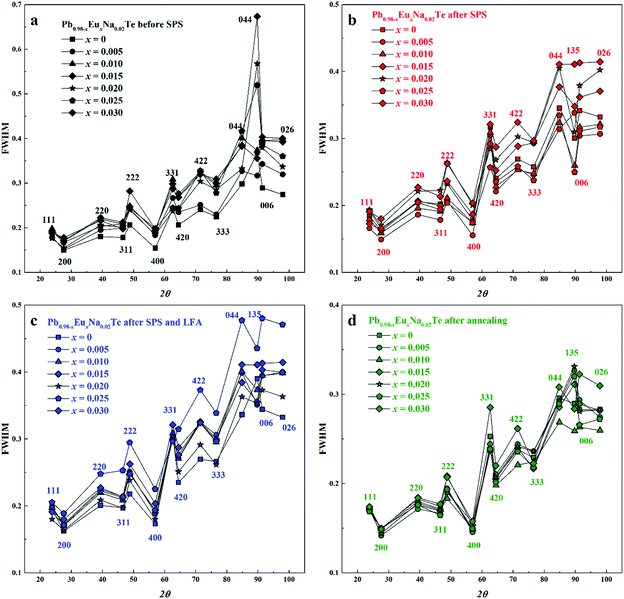 | ||
| Fig. 3 Full width at half maximum (FWHM) of reflections in powder XRD patterns of Pb0.98−xEuxNa0.02Te: (a) before SPS, (b) after SPS, (c) after SPS and LFA, and (d) after annealing. | ||
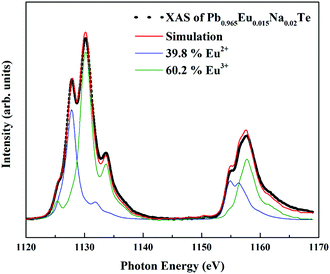
In ternary Pb1−xEuxTe solution (x = 0.01 and 0.02) Eu remains in the 4f7 (Eu2+) state, consistent with reported data.60,76 This excludes the possible presence of europium(III) oxide. The effective magnetic moment of Eu is in good agreement with the theoretical value for the S = 7/2 Eu state. In the composition of the ternary samples which is located on the line, Pb1−xEuxTe1+0.5x, the effective magnetic moment is reduced (red point in Fig. S3, ESI†), suggesting the presence of Eu in the 4f6 state. The addition of sodium depending on the substitution scenario may force oxidation of europium towards Eu3+ in order to compensate the charge disbalance in the system. The effective magnetic moment of Eu in the quaternary samples is smaller (Fig. S3, ESI†). Since the magnetic susceptibility measurements cannot provide a precise evaluation of the 4f7/4f6 ratio, we performed XAS measurements for a series of samples after SPS and LFA, for which the lattice parameters obey Vegard's rule. Eu atoms were found to be in a mixed-valence state (Fig. 6). The amount of Eu in the 4f6 state increases with the Eu concentration until the solubility limit, the non-monotonicity of the Eu3+ ratio could originate from different deviations of the sample composition from the blue line in Fig. 2a towards the Te-rich region (Table S2, ESI†). For understanding this effect, we assume that adding Na moves the Fermi level towards the Eu 4f states, which leads to instability of the 4f7 configuration and drives the 4f7–4f6 transition.62
3.2 Thermoelectric properties
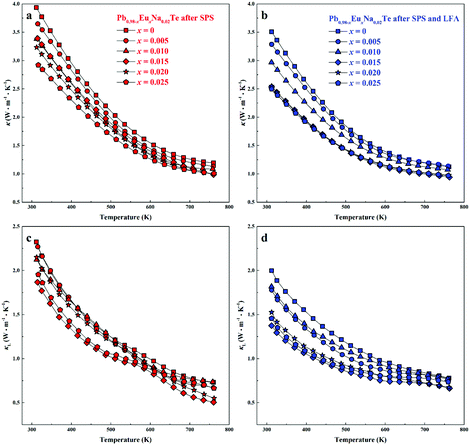
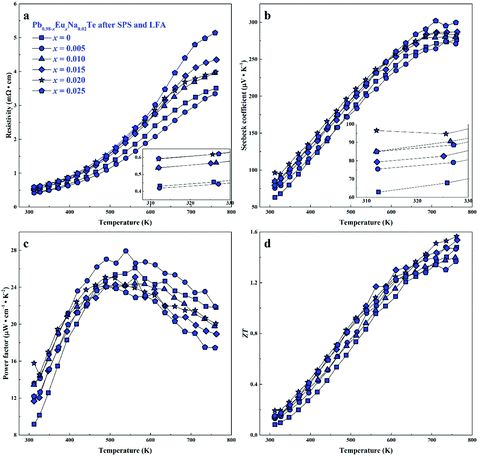
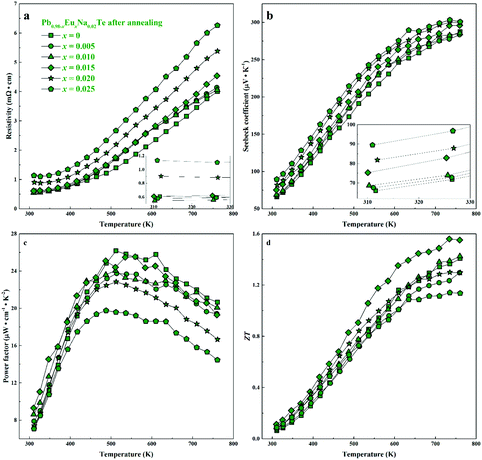
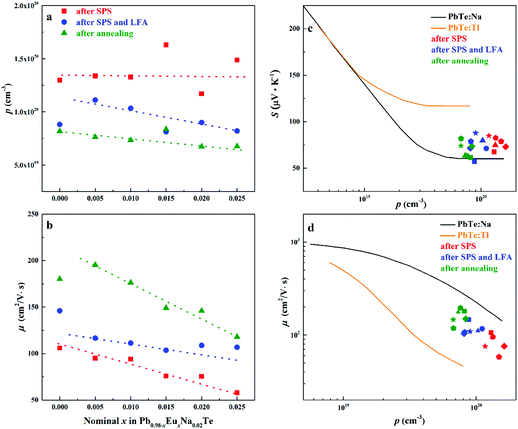
For all samples, a complex distribution of Na and Eu in the PbTe matrix (see above) was found. Thus, measured thermoelectric properties reflect not only the intrinsic behavior of the main phase, but also all other constituents of the microstructure (Fig. 4 and 5). That is why it is difficult to discuss the dependence of TE properties on lattice parameters or nominal chemical composition of the main phase. In order to understand the role of material homogeneity, the thermoelectric behavior is presented here as a function of the thermal history of the sample. Similar to Na-substituted materials,36 for all series investigated here, p-type metal-like behavior was observed due to substitution of Pb by Na (Fig. 7–9). However, the presence of Eu affects the electrical and transport properties. With increased Eu concentration, the electrical resistivity is increased for all samples in the series. The presence of Eu also increases the Seebeck coefficient (Fig. 10c). ZT values above 2 were established for the most inhomogeneous series Pb0.98−xEuxNa0.02Te (x = 0.015 and 0.02. Fig. 7d, the first heating cycle of thermal conductivity data was used for the ZT calculation, see below). After subsequent heat treatments (LFA measurements or long-term annealing), the ZTmax value reduces to 1.6 (the second cooling cycle of thermal conductivity data was used for the ZT calculation). This is attributed to increasing electrical resistivity. Since the Hall mobility shows higher values after LFA and after annealing compared to after SPS samples (Fig. 10b), the increased resistivity of samples after additional heat treatments should associate with a decrease in charge carrier concentration (Fig. 10a).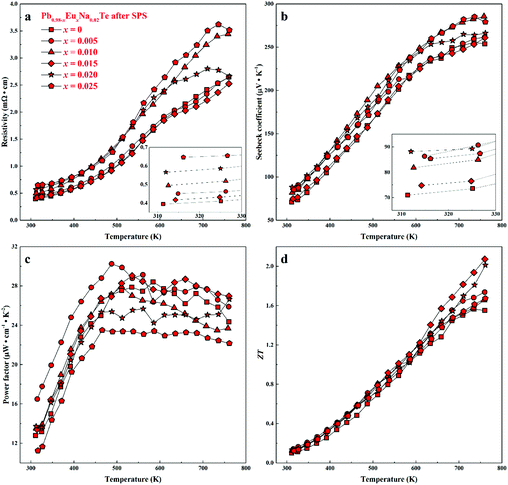 | ||
| Fig. 7 Thermoelectric properties of Pb0.98−xEuxNa0.02Te after SPS: (a) resistivity, (b) Seebeck coefficient, (c) power factor, and (d) thermoelectric figure-of-merit ZT. | ||
 | ||
| Fig. 8 Thermoelectric properties of Pb0.98−xEuxNa0.02Te after SPS and LFA: (a) resistivity, (b) Seebeck coefficient, (c) power factor, and (d) thermoelectric figure-of-merit ZT. | ||
 | ||
| Fig. 9 Thermoelectric properties of Pb0.98−xEuxNa0.02Te after 900 h annealing at 873 K: (a) resistivity, (b) Seebeck coefficient, (c) power factor, and (d) thermoelectric figure-of-merit ZT. | ||
 | ||
| Fig. 10 (a) Hall carrier concentration p and (b) carrier mobility μ of Pb0.98−xEuxNa0.02Te after SPS (red), after SPS and LFA (blue), and after annealing at 873 K (green). Dashed lines are a guide to the eye. (c) Room temperature Seebeck coefficient S and (d) room temperature Hall mobility μ versus Hall carrier concentration p for Pb0.98−xEuxNa0.02Te, PbTe: Na,15,35,41 and PbTe: Tl.4,44,77 | ||
Highest values of the charge carrier concentration were observed for the series of samples after SPS. The carrier concentration practically does not change within the Eu solubility range (Fig. 10a, red symbols, Fig. S5, ESI†). Additional heat treatment reduces the carrier concentration drastically, which is due to redistribution of sodium during the heat treatment,36 consistent with the lattice parameter changes, and to the reduction of metal-rich aggregations into the microstructure (Fig. 4 and 5). The carrier concentration after long-term annealing (Fig. 10a, green symbols) is reduced by 40–50%, compared to the samples just only after SPS (Fig. 10a, red symbols). For samples after LFA and after annealing, the carrier concentration decreases slightly with the increasing Eu content, which may be attributed also to the increase of Eu3+ concentrations after additional heat-treatment. At the same time, samples after SPS are characterized as the most inhomogeneous, showing the lowest values of carrier mobility (Fig. 10b). Due to homogenization by heat treatment, the mobility increases for other series of samples. Comparing these values with PbTe: Na,15,35,41 Eu-substituted samples reveal higher Seebeck coefficients (Fig. 10c) and lower carrier mobilities (Fig. 10d). In the case of PbTe: Tl,4,44,77 the Seebeck coefficient is lower and the mobility is significantly higher (Fig. 10c and d). This indicates the effect of the Eu substitution on the band structure of pristine PbTe. As shown in Fig. 4 and 5, different thermal treatments have changed the distribution of Eu in samples, which will influence the electronic band structure of PbTe (as investigated in ref. 63). Therefore, a large dispersion of the Seebeck coefficient dependent on thermal treatments (Fig. 10d) was found. Thermal conductivity for all series decreases with increasing Eu concentration (Fig. 11a and b). The structural disorder, introduced by Eu substitution, and additional inhomogeneity (Fig. S4, ESI†) enhance the phonon scattering, which directly affects the lattice thermal conductivity (Fig. 11c and d). Interestingly, the samples just after SPS show higher values of thermal conductivity (with respect to the consecutive heat treatments), which is mainly due to higher contribution from electric thermal conductivity, since the samples after SPS have the highest carrier concentrations. The high lattice thermal conductivity of the samples after SPS is most probably caused by metal-rich aggregations remaining in the microstructure (Fig. 4). They are strongly reduced after enhanced thermal treatment (Fig. 5), and the thermal conductivity of the material has more intrinsic character, i.e. shows lower values. Similar to the Pb1−xNaxTe series,36 a jump-like decrease is observed in the vicinity of 650 K in the first heating cycle (Fig. 12). We used the first heating LFA data to calculate the total and lattice thermal conductivity for the samples after SPS. Since at high temperature (>650 K), the first heating LFA data are almost the same compared to the following cyclic LFA data, so the total thermal conductivity of after SPS samples and after LFA samples is almost the same (Fig. 11 and 12). However, the after-SPS samples have higher values of electric thermal conductivity at high temperature due to lower resistivity. According to the Wiedemann–Franz equation, the calculated lattice thermal conductivity show lower values in the high temperature range compared to after LFA samples (Fig. 11).
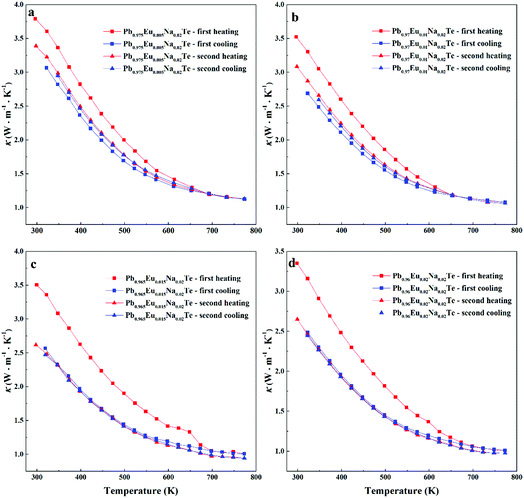 | ||
| Fig. 12 Cyclic measurement of total thermal conductivity (κ) of Pb0.98−xEuxNa0.02Te: (a) x = 0.005, (b) x = 0.010, (c) x = 0.015, and (d) x = 0.020. | ||
3.3. Thermal cycling experiments
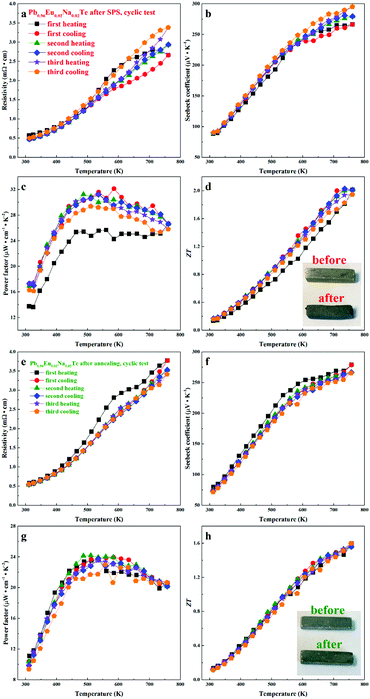
Material stability with respect to the operating temperature range is crucial for device engineering. The LFA cyclic measurements (Fig. 12) indicate that the samples are not stable directly after SPS. The first heating cycle of the thermal conductivity measurement for all samples shows higher values, compared to the following cycles. There is an obvious drop for each sample at the temperature above 600 K, after which the thermal conductivities show quite stable values. This may indicate that the materials are structurally or chemically changed during heat treatment. The Pb0.96Eu0.02Na0.02Te sample, which shows the highest calculated ZT, was used for cyclic measurements (Fig. 13). After SPS (most inhomogeneous state), the sample maintains high ZT values within cycling measurements, but the resistivity and the Seebeck coefficient change (Fig. 13a and b), especially in the high temperature range (500–760 K). After cycling, the specimen, which was a perfect shiny-gray parallelepiped (inset of Fig. 13d, top), is bent and the surface becomes black and coarse (inset of Fig. 13d, bottom). In contrast to the SPS sample, all properties of the long-term annealed sample are quite reproducible and the specimen did not show obvious changes after measurements (Fig. 13e–h, inset). The slight evolution of the electrical resistivity and Seebeck coefficient during the first heating–cooling cycle (Fig. 13e and f) can be attributed to the elimination of the quenching effect, i.e. stress in the microstructure. For the evaluation of these materials in potential high-temperature applications, further characterization of the thermal stability at 873 K was carried out (Fig. S6–S8, ESI†).4. Conclusions
The sample series Pb0.98−xEuxNa0.02Te (x = 0–0.030) were systematically investigated after different heat treatments: spark plasma sintering (SPS), laser flash measurement (LFA), and long-term annealing. The solubility of Eu (ca. 1.0 atom%) in Pb0.98−xEuxNa0.02Te was established at 873 K. A part of Eu becomes Eu3+ within the homogeneity range due to the charge compensation caused by Pb2+-by-Na1+ substitution or by a change in the sample composition towards the Te-rich side.The most inhomogeneous samples (after SPS) reveal the highest values of ZTmax up to 2.1 at 760 K. However, metallographic studies show that there are a large number of micrometer-scale sodium- and europium-rich aggregations. After additional heat treatment (LFA measurement or long-term annealing), the ZTmax value reduces to 1.6. The distribution of Eu and Na within the samples becomes much more homogeneous, while the lattice parameters increase and the carrier concentrations decrease.
The structural disorder introduced by Na and Eu substitutions and the non-homogeneity of materials increase the phonon scattering, which decrease the total and lattice thermal conductivities. The cyclic measurements of thermal conductivity show a significant difference between the first heating cycle and the subsequent cycles.
The cyclic TE properties were investigated for all three sample series. The long-term annealed samples show the best reproducible TE properties and good mechanical stability. In summary, these materials can be used in thermoelectric modules, just only after long-term annealing. In order to avoid material decomposition, surface protection need to be considered for working temperatures above 773 K.
This study clearly demonstrates that out-of-equilibrium materials may have promising high ZT values under certain circumstances, but these ZT values will generally approach lower values after heat treatment similar to the “working conditions”.
Conflicts of interest
There are no conflicts to declare.Acknowledgements
The authors thank Dr Gudrun Auffermann (MPI CPfS) for chemical analysis, the structure group of MPI CPfS for powder XRD measurements, Dr Eteri Svanidze for valuable discussions. C.-Y. Kuo, C.-T. Chen and C.-F. Chang would like to acknowledge support from the Max Planck-POSTECH/Hsinchu Center for Complex Phase Materials. Open Access funding provided by the Max Planck Society.References
- A. F. Ioffe, Semiconductor Thermoelements and Thermoelectric Cooling, Infosearsh, London, 1957 Search PubMed.
- G. J. Snyder and E. S. Toberer, Nat. Mater., 2008, 7, 105–114 CrossRef PubMed.
- J. P. Heremans, B. Wiendlocha and A. M. Chamoire, Energy Environ. Sci., 2012, 5, 5510–5530 RSC.
- J. P. Heremans, V. Jovovic, E. S. Toberer, A. Saramat, K. Kurosaki, A. Charoenphakdee, S. Yamanaka and G. J. Snyder, Science, 2008, 321, 554–557 CrossRef PubMed.
- W. Liu, X. Tan, K. Yin, H. Liu, X. Tang, J. Shi, Q. Zhang and C. Uher, Phys. Rev. Lett., 2012, 108, 166601 CrossRef PubMed.
- Y. Z. Pei, X. Y. Shi, A. LaLonde, H. Wang, L. D. Chen and G. J. Snyder, Nature, 2011, 473, 66–69 CrossRef PubMed.
- J. P. Heremans, C. M. Thrush and D. T. Morelli, Phys. Rev. B: Condens. Matter Mater. Phys., 2004, 70, 115334 CrossRef.
- J. Martin, L. Wang, L. Chen and G. S. Nolas, Phys. Rev. B: Condens. Matter Mater. Phys., 2009, 79, 115311 CrossRef.
- J.-H. Bahk, Z. Bian and A. Shakouri, Phys. Rev. B: Condens. Matter Mater. Phys., 2013, 87, 075204 CrossRef.
- M. S. Dresselhaus, G. Chen, M. Y. Tang, R. G. Yang, H. Lee, D. Z. Wang, Z. F. Ren, J. P. Fleurial and P. Gogna, Adv. Mater., 2007, 19, 1043–1053 CrossRef.
- T. C. Harman, D. L. Spears and M. J. Manfra, J. Electron. Mater., 1996, 25, 1121–1127 CrossRef.
- T. C. Harman, P. J. Taylor, M. P. Walsh and B. E. LaForge, Science, 2002, 297, 2229–2232 CrossRef PubMed.
- K. F. Hsu, S. Loo, F. Guo, W. Chen, J. S. Dyck, C. Uher, T. Hogan, E. K. Polychroniadis and M. G. Kanatzidis, Science, 2004, 303, 818–821 CrossRef PubMed.
- K. Biswas, J. Q. He, Q. C. Zhang, G. Y. Wang, C. Uher, V. P. Dravid and M. G. Kanatzidis, Nat. Chem., 2011, 3, 160–166 CrossRef PubMed.
- M. Ohta, K. Biswas, S.-H. Lo, J. He, D. Y. Chung, V. P. Dravid and M. G. Kanatzidis, Adv. Energy Mater., 2012, 2, 1117–1123 CrossRef.
- L.-D. Zhao, J. He, C.-I. Wu, T. P. Hogan, X. Zhou, C. Uher, V. P. Dravid and M. G. Kanatzidis, J. Am. Chem. Soc., 2012, 134, 7902–7912 CrossRef PubMed.
- M. G. Kanatzidis, Chem. Mat., 2010, 22, 648–659 CrossRef.
- K. Biswas, J. Q. He, I. D. Blum, C. I. Wu, T. P. Hogan, D. N. Seidman, V. P. Dravid and M. G. Kanatzidis, Nature, 2012, 489, 414–418 CrossRef PubMed.
- Y. Lee, S.-H. Lo, J. Androulakis, C.-I. Wu, L.-D. Zhao, D.-Y. Chung, T. P. Hogan, V. P. Dravid and M. G. Kanatzidis, J. Am. Chem. Soc., 2013, 135, 5152–5160 CrossRef PubMed.
- L. D. Zhao, H. J. Wu, S. Q. Hao, C. I. Wu, X. Y. Zhou, K. Biswas, J. Q. He, T. P. Hogan, C. Uher, C. Wolverton, V. P. Dravid and M. G. Kanatzidis, Energy Environ. Sci., 2013, 6, 3346–3355 RSC.
- D. T. Morelli, V. Jovovic and J. P. Heremans, Phys. Rev. Lett., 2008, 101, 035901 CrossRef PubMed.
- C. W. Li, J. Ma, H. B. Cao, A. F. May, D. L. Abernathy, G. Ehlers, C. Hoffmann, X. Wang, T. Hong, A. Huq, O. Gourdon and O. Delaire, Phys. Rev. B: Condens. Matter Mater. Phys., 2014, 90, 214303 CrossRef.
- H. L. Liu, X. Shi, F. F. Xu, L. L. Zhang, W. Q. Zhang, L. D. Chen, Q. Li, C. Uher, T. Day and G. J. Snyder, Nat. Mater., 2012, 11, 422–425 CrossRef PubMed.
- W. Qiu, L. Xi, P. Wei, X. Ke, J. Yang and W. Zhang, PNAS, 2014, 111, 15031–15035 CrossRef PubMed.
- L.-D. Zhao, S.-H. Lo, Y. Zhang, H. Sun, G. Tan, C. Uher, C. Wolverton, V. P. Dravid and M. G. Kanatzidis, Nature, 2014, 508, 373–377 CrossRef PubMed.
- L.-D. Zhao, G. Tan, S. Hao, J. He, Y. Pei, H. Chi, H. Wang, S. Gong, H. Xu, V. P. Dravid, C. Uher, G. J. Snyder, C. Wolverton and M. G. Kanatzidis, Science, 2016, 351, 141–144 CrossRef PubMed.
- J. R. Sootsman, D. Y. Chung and M. G. Kanatzidis, Angew. Chem., Int. Ed., 2009, 48, 8616–8639 CrossRef PubMed.
- D. M. Rowe, V. L. Kuznetsov, L. A. Kuznetsova and G. Min, J. Phys. D: Appl. Phys., 2002, 35, 2183–2186 CrossRef.
- V. Zlatić and R. Monnier, Phys. Rev. B: Condens. Matter Mater. Phys., 2005, 71, 165109 CrossRef.
- A. Prokofiev, A. Sidorenko, K. Hradil, M. Ikeda, R. Svagera, M. Waas, H. Winkler, K. Neumaier and S. Paschen, Nat. Mater., 2013, 12, 1096–1101 CrossRef PubMed.
- S. Lin, P. Tong, B. Wang, J. Lin, Y. Huang and Y. Sun, Inorg. Chem., 2014, 53, 3709–3715 CrossRef PubMed.
- V. N. Nikiforov, A. V. Morozkin and V. Y. Irkhin, Phys. Met. Metallogr., 2013, 114, 654–666 CrossRef.
- S. Ahmad, S. D. Mahanti, K. Hoang and M. G. Kanatzidis, Phys. Rev. B: Condens. Matter Mater. Phys., 2006, 74, 155205 CrossRef.
- A. D. LaLonde, Y. Z. Pei and G. J. Snyder, Energy Environ. Sci., 2011, 4, 2090–2096 RSC.
- Y. Z. Pei, A. LaLonde, S. Iwanaga and G. J. Snyder, Energy Environ. Sci., 2011, 4, 2085–2089 RSC.
- X. Wang, I. Veremchuk, M. Bobnar, U. Burkhardt, J.-T. Zhao and Y. Grin, Chem. Mat., 2018, 30, 1362–1372 CrossRef.
- K. Biswas, J. He, G. Wang, S.-H. Lo, C. Uher, V. P. Dravid and M. G. Kanatzidis, Energy Environ. Sci., 2011, 4, 4675–4684 RSC.
- Y. Z. Pei, A. D. LaLonde, N. A. Heinz and G. J. Snyder, Adv. Energy Mater., 2012, 2, 670–675 CrossRef.
- K. Ahn, K. Biswas, J. He, I. Chung, V. Dravid and M. G. Kanatzidis, Energy Environ. Sci., 2013, 6, 1529–1537 RSC.
- P. K. Rawat, B. Paul and P. Banerji, ACS Appl. Mater. Interfaces, 2014, 6, 3995–4004 CrossRef PubMed.
- Z. Jian, Z. Chen, W. Li, J. Yang, W. Zhang and Y. Pei, J. Mater. Chem. C, 2015, 3, 12410–12417 RSC.
- G. Tan, F. Shi, S. Hao, L.-D. Zhao, H. Chi, X. Zhang, C. Uher, C. Wolverton, V. P. Dravid and M. G. Kanatzidis, Nat. Commun., 2016, 7, 1–9 Search PubMed.
- L. Ruan, J. Luo, H. Zhu, H. Zhao and J. Liang, J. Electron. Mater., 2015, 44, 3556–3562 CrossRef.
- Y. Z. Pei, H. Wang, Z. M. Gibbs, A. D. LaLonde and G. J. Snyder, NPG Asia Mater., 2012, 4, 1–6 CrossRef.
- Y. Z. Pei, J. Lensch-Falk, E. S. Toberer, D. L. Medlin and G. J. Snyder, Adv. Funct. Mater., 2011, 21, 241–249 CrossRef.
- Y. Pei, Z. M. Gibbs, A. Gloskovskii, B. Balke, W. G. Zeier and G. J. Snyder, Adv. Energy Mater., 2014, 4, 1400486 CrossRef.
- T. J. Zhu, Y. T. Liu, C. G. Fu, J. P. Heremans, J. G. Snyder and X. B. Zhao, Adv. Mater., 2017, 29, 1605884 CrossRef PubMed.
- R. S. Allgaier, J. Appl. Phys., 1961, 32, 2185–2189 CrossRef.
- A. J. Crocker and L. M. Rogers, Br. J. Appl. Phys., 1967, 18, 563 CrossRef.
- Y. Pei, A. D. LaLonde, H. Wang and G. J. Snyder, Energy Environ. Sci., 2012, 5, 7963–7969 RSC.
- M. Iida, T. Shimizu, H. Enomoto and H. Ozaki, Jpn. J. Appl. Phys., Part 1, 1993, 32, 4449–4453 CrossRef.
- T. Syoji, Y. Miyahara and H. Ozaki, Jpn. J. Appl. Phys., Part 2, 1996, 35, L471–L472 CrossRef.
- A. Casian, I. Sur, H. Scherrer and Z. Dashevsky, Phys. Rev. B: Condens. Matter Mater. Phys., 2000, 61, 15965–15974 CrossRef.
- I. Sur, A. Casian and A. Balandin, Phys. Rev. B: Condens. Matter Mater. Phys., 2004, 69, 035306 CrossRef.
- A. Ishida, T. Yamada, D. Cao, Y. Inoue, M. Veis and T. Kita, J. Appl. Phys., 2009, 106, 023718 CrossRef.
- X.-K. Wang, I. Veremchuk, M. Bobnar, J.-T. Zhao and Y. Grin, Inorg. Chem. Front., 2016, 3, 1152–1159 RSC.
- D. L. Partin, J. Appl. Phys., 1985, 57, 1997–2000 CrossRef.
- G. T. Alekseeva, M. V. Vedernikov, E. A. Gurieva, P. P. Konstantinov, L. V. Prokof’eva and Y. I. Ravich, Semiconductors, 1998, 32, 716–719 CrossRef.
- J. Q. Li, S. P. Li, Q. B. Wang, L. Wang, F. S. Liu and W. Q. Ao, J. Electron. Mater., 2011, 40, 2063–2068 CrossRef.
- Y. S. Gromovoi, S. D. Darchuk, V. N. Konovalov, V. M. Lakeenkov, S. V. Plyatsko and F. F. Sizov, Soviet Physics Semiconductors-Ussr, 1989, 23, 639–643 Search PubMed.
- B. A. Volkov, L. I. Ryabova and D. R. Khokhlov, Phys.-Usp., 2002, 45, 819–846 CrossRef.
- B. Wiendlocha, S. Kim, Y. Lee, B. He, G. Lehr, M. G. Kanatzidis, D. T. Morelli and J. P. Heremans, Phys. Chem. Chem. Phys., 2017, 19, 9606–9616 RSC.
- Z. Chen, Z. Jian, W. Li, Y. Chang, B. Ge, R. Hanus, J. Yang, Y. Chen, M. Huang, G. J. Snyder and Y. Pei, Adv. Mater., 2017, 29, 1606768 CrossRef PubMed.
- S. A. Yamini, M. Brewis, J. Byrnes, R. Santos, A. Manettas and Y. Z. Pei, J. Mater. Chem. C, 2015, 3, 10610–10615 RSC.
- F. Ren, R. Schmidt, J. K. Keum, B. S. Qian, E. D. Case, K. C. Littrell and K. An, Appl. Phys. Lett., 2016, 109, 081903 CrossRef.
- C. H. Su, Mater. Sci. Semicond. Process., 2016, 56, 94–99 CrossRef.
- L. Akselrud and Y. Grin, J. Appl. Crystallogr., 2014, 47, 803–805 CrossRef.
- B. T. Thole, G. van der Laan, J. C. Fuggle, G. A. Sawatzky, R. C. Karnatak and J. M. Esteva, Phys. Rev. B: Condens. Matter Mater. Phys., 1985, 32, 5107–5118 CrossRef.
- I. Wolfram, Research, Mathematica, Version 8.0, 2010 Search PubMed.
- Y. Z. Pei, A. D. LaLonde, N. A. Heinz, X. Y. Shi, S. Iwanaga, H. Wang, L. D. Chen and G. J. Snyder, Adv. Mater., 2011, 23, 5674–5678 CrossRef PubMed.
- H.-S. Kim, Z. M. Gibbs, Y. Tang, H. Wang and G. J. Snyder, APL Mater., 2015, 3, 041506 CrossRef.
- K. A. Borup, J. de Boor, H. Wang, F. Drymiotis, F. Gascoin, X. Shi, L. Chen, M. I. Fedorov, E. Muller, B. B. Iversen and G. J. Snyder, Energy Environ. Sci., 2015, 8, 423–435 RSC.
- I. O. Nasibov, T. I. Sultanov, V. K. Valiev and S. M. Alidzhanova, Inorg. Mater. (translated from Izvestiya Akademii Nauk SSSR, Neorganicheskie Materialy), 1987, 23, 457–458 Search PubMed.
- X. Wang, K. Guo, I. Veremchuk, U. Burkhardt, Y. Prots and J.-T. Zhao, ICT & ECT 2015, Dresden, abstract, oral presentation 11A.1, 2015.
- Y. Grin and A. A. Fedorchuk, Russ. Metall., 1992, 5, 197–200 Search PubMed.
- J. A. H. Coaquira, V. A. Chitta, N. F. Oliveira, P. H. O. Rappl, A. Y. Ueta, E. Abramof and G. Bauer, J. Supercond., 2003, 16, 115–118 CrossRef.
- S. A. Nemov and Y. I. Ravich, Uspekhi Fiz. Nauk, 1998, 168, 817–842 CrossRef.
Footnote |
| † Electronic supplementary information (ESI) available. See DOI: 10.1039/c8tc03142h |
| This journal is © The Royal Society of Chemistry 2018 |

