
 Open Access Article
 This Open Access Article is licensed under a Creative Commons Attribution-Non Commercial 3.0 Unported Licence
New red-emitting Schiff base chelates: promising dyes for sensing and imaging of temperature and oxygen via phosphorescence decay time†
Sergey M.
Borisov
 *a,
Reinhold
Pommer
a,
Jan
Svec
b,
Sven
Peters
c,
Veronika
Novakova
b and
Ingo
Klimant
a
*a,
Reinhold
Pommer
a,
Jan
Svec
b,
Sven
Peters
c,
Veronika
Novakova
b and
Ingo
Klimant
a
aInstitute of Analytical Chemistry and Food Chemistry, Graz University of Technology, Stremayrgasse 9, 8010, Graz, Austria. E-mail: sergey.borisov@tugraz.at
bDepartment of Pharmaceutical Chemistry and Pharmaceutical Analysis, Faculty of Pharmacy in Hradec Kralove, Charles University, Akademika Heyrovskeho 1203, Hradec Kralove, Czech Republic
cDepartment of Ophthalmology, University Hospital Jena, Jena, Germany
First published on 2nd August 2018
Abstract
New complexes of Zn(II), Pd(II) and Pt(II) with Schiff bases are prepared in a one-step condensation of 4-(dibutylamino)-2-hydroxybenzaldehyde and 4,5-diaminophthalonitrile in the presence of a metal salt. The complexes possess efficient absorption in the blue-green part of the spectrum with molar absorption coefficients up to 98![[thin space (1/6-em)]](https://www.rsc.org/images/entities/char_2009.gif) 000 M−1 cm−1. The Pt(II) complex shows very strong red phosphorescence in anoxic solutions at room temperature with a quantum yield of 65% in toluene which places it among the brightest emitters available for this spectral range. The phosphorescence of the Pd(II) complex under the same conditions is very weak (Φ < 1%) but is enhanced to Φ > 10% upon immobilization into polymers. Optical thermometers based on self-referenced lifetime read-out are prepared upon immobilization of the dyes into gas-blocking poly(vinylidene chloride-co-acrylonitrile). At 25 °C, the materials based on Pd(II) and Pt(II) complexes show sensitivities of −2.1 and −0.52%τ/K, respectively. Application of the sensors for imaging of temperature on surfaces (planar optode) and for monitoring of fast temperature fluctuations (fiber-optic microsensor) is demonstrated. Immobilized into a gas-permeable matrix, the Pt(II) complex also performs as a promising oxygen-sensing material. The new systems are also attractive for imaging of oxygen or temperature with the help of multi-photon microscopy, due to a good match with the biological optical window and much better brightness under two photon excitation compared to that of the conventional Pt(II) meso-tetra-(pentafluorophenyl)porphyrin.
000 M−1 cm−1. The Pt(II) complex shows very strong red phosphorescence in anoxic solutions at room temperature with a quantum yield of 65% in toluene which places it among the brightest emitters available for this spectral range. The phosphorescence of the Pd(II) complex under the same conditions is very weak (Φ < 1%) but is enhanced to Φ > 10% upon immobilization into polymers. Optical thermometers based on self-referenced lifetime read-out are prepared upon immobilization of the dyes into gas-blocking poly(vinylidene chloride-co-acrylonitrile). At 25 °C, the materials based on Pd(II) and Pt(II) complexes show sensitivities of −2.1 and −0.52%τ/K, respectively. Application of the sensors for imaging of temperature on surfaces (planar optode) and for monitoring of fast temperature fluctuations (fiber-optic microsensor) is demonstrated. Immobilized into a gas-permeable matrix, the Pt(II) complex also performs as a promising oxygen-sensing material. The new systems are also attractive for imaging of oxygen or temperature with the help of multi-photon microscopy, due to a good match with the biological optical window and much better brightness under two photon excitation compared to that of the conventional Pt(II) meso-tetra-(pentafluorophenyl)porphyrin.
1. Introduction
Recent years have seen a great interest in new dyes which show thermally activated delayed fluorescence (TADF)1–4 or phosphorescence,5–8 at room temperature primarily due to their high potential as emitters in OLEDs.6,7,9–11 Phosphorescent dyes have also been applied in various materials for optical sensing12,13 (for example of oxygen,14,15 glucose,16 pH17 or temperature18) and for bioimaging.19–21 They also act as efficient sensitizers in triplet–triplet annihilation (TTA) based upconversion systems.22–24 For sensing and imaging applications high brightness (defined as the product of the molar absorption coefficient ε and the luminescence quantum yield Φ) is of primary importance.Although numerous metal-free emitters have been reported lately25–30 most phosphorescent dyes are still covered by metal complexes. Platinum(II) and palladium(II) complexes with porphyrins and their derivatives (porphyrin lactones,31 ketones,32etc.) are very popular phosphorescent emitters.6,12 They feature tuneable spectral properties and good luminescence brightness. Ruthenium(II) polypyridyl complexes33 and platinum(II) and iridium(III) cyclometalated complexes34 with numerous ligands show long-lived metal-to-ligand charge-transfer luminescence but possess a lower brightness due to moderate ε. Therefore, they are less attractive for sensing and light conversion applications, except for a few representatives.35,36 The same is true for TADF emitters which often have very high Φ, but low to moderate ε in the visible part of the spectrum.37 Schiff bases form phosphorescent chelates with platinum(II) and palladium(II),38–41 but the luminescence brightness is moderate either due to low ε38–40 or low Φ.41,42 Nevertheless, they were shown to be promising for application in OLEDs,38–40 optical sensing41 and TTA upconversion41,43 and other energy-related applications.44
Sensors utilizing luminescent materials offer many advantages compared to conventional analytical methods including minimal invasiveness, comparably low cost, suitability for imaging of analyte distribution and possibility of multi-parameter sensing with a single material. Temperature is undoubtedly one of the most important parameters which, among other methods, can be measured via change in the luminescent properties of an indicator,18,45 in most cases either a (metal)organic dye or an inorganic phosphor. Materials which utilize change of the comparably long luminescence lifetimes (μs–ms) are particularly attractive due to the self-reference character of the measurement and inexpensive equipment needed for the sensor read-out. Unfortunately, among numerous materials published18 only a few are suitable for this read-out.
In this contribution we report new metal complexes of Schiff bases which can be conveniently accessed in a one-step procedure. We will show that the phosphorescent properties of the dyes enable their application as advanced molecular thermometers with lifetime-based read-out.
2. Experimental section
2.1 Materials
Zinc acetate dihydrate and palladium acetate were obtained from Aldrich, and methanesulfonic acid was obtained from ABCR. Polystyrene (PS; MW = 260000 Da) was purchased from Acros Organics and poly(vinylidene chloride-co-acrylonitrile) (PViCl-PAN, 20 wt% acrylonitrile content, MW = 125000 Da) was obtained from Scientific Polymer (http://www.scientificpolymer.com). Eudragit RL-100 copolymer (poly(ethylacrylate-co-methylmethacrylate-co-trimethyl-aminoethyl methacrylate), 8.85–11.96 wt% trimethyl-aminoethyl methacrylate units on a dry substance), MW = 150000 Da, was obtained from Degussa (http://www.evonik.com). N,N-Bis(2,6-diisopropylphenyl)-1,6,7,12-tetraphenoxyperylene-3,4:9,10-tetracarboxylic acid bisimide (Lumogen Red) was obtained from Kremer Pigmente GmbH and Co. KG (Germany). Poly(ethylene terephthalate) (PET) support Melinex 505 was purchased from Pütz (Germany). Platinum(II) meso-(pentafluorophenyl)porphyrin (Pt-TFPP) was acquired from Frontier Scientific (Logan, UT, USA). Solvents were obtained from VWR and both were used as received. Nitrogen, argon and oxygen (both 99.999% purity) were purchased from Air Liquide (Austria) and Linde Gas (Austria), respectively.
Platinum(II) bis(benzonitrile)dichloride (Pt(BN)2Cl2) and 4-(dibutylamino)-2-hydroxybenzaldehyde were prepared according to the literature procedures.41 The preparation of 4,5-diaminophthalonitrile is described elsewhere.46,47
Zn(II) complex of (4E,5E)-4,5-bis(4-(dibutylamino)-2-hydroxybenzylideneamino)benzene-1,2-dinitrile (Zn-1). 4-(Dibutylamino)-2-hydroxybenzaldehyde (196 mg, 0.79 mmol, 4.1 eq.) and 4,5-diaminophthalonitrile (30 mg, 0.19 mmol, 1 eq.) were dissolved in 8 mL of methanol and zinc acetate dihydrate (62 mg, 0.28 mmol, 1.5 eq.) was added. The suspension was ultrasonicated and transferred under nitrogen counterflow into a Schlenk flask. Methanesulfonic acid (10 μL, 15 mg, 0.15 mmol, 0.8 eq.) was added under vigorous stirring. The obtained solution was stirred at 40 °C resulting in the formation of a red sediment. After 120 minutes, the dispersion was cooled down to room temperature and the sediment isolated via centrifugation. The product was washed several times with methanol and cyclohexane to remove the excess of 4-(dibutylamino)-2-hydroxybenzaldehyde and dried in a drying cabinet. Yield: 75 mg (0.110 mmol, 58%).
1H-NMR: (300 MHz, DMSO-d6): δ [ppm] = 8.77 (s, 2H), 8.36 (s, 2H), 7.13 (m, 2H), 6.19 (d, 2H), 5.78 (s, 2H), 3.40 (m, 8H), 1.50 (m, 8H), 1.34 (m, 8H), 0.92 (m, 12H).
IR, (cm−1): 2958, 2927, 2858, 2219, 1597, 1556, 1515, 1487, 1432, 1355, 1283, 1252, 1213, 1181, 1140, 1071, 1020, 920, 871, 820, 773, 732, 660, 598, 534.
HR MS (MALFDI-TOF) [m/z]: calc.: 682.2974, found: 682.3397.
Pt(II) complex of (4E,5E)-4,5-bis(4-(dibutylamino)-2-hydroxybenzylideneamino)benzene-1,2-dinitrile (Pt-1). 4-(Dibutylamino)-2-hydroxybenzaldehyde (321 mg, 1.29 mmol, 4.0 eq.) and 4,5-diaminophralonitrile (50.3 mg, 0.32 mmol, 1 eq.) were dissolved in a 15 mL ethanol
:methanol mixture (2:1 v/v) and Pt(BN)2Cl2 (229 mg, 0.49 mmol, 1.5 eq.) was added. The yellow suspension was ultrasonicated and transferred under nitrogen counterflow into a round bottom flask. Methanesulfonic acid (15 μL, 22.2 mg, 0.23 mmol, 0.7 eq.) was added. The resulting red solution was stirred overnight at 60 °C.
The product was purified via column chromatography on silica gel (dichloromethane/cyclohexane 9:1 v/v, then dichloromethane/ethyl acetate 19:1). Yield: 14.5 mg (5.6%) of dark red powder.
1H-NMR: (300 MHz, CDCl3): δ [ppm] = 7.58 (s, 2H), 7.53 (s, 2H), 6.90 (d, 2H), 6.25 (s, 2H), 6.15 (d, 2H), 3.31 (m, 8H), 1.67 (m, 8H), 1.40 (m, 8H), 0.95 (t, 12H).
13C-NMR: (76 MHz, CDCl3): δ [ppm] = 167.2, 154.8, 147.1, 144.5, 136.3, 118.8, 115.9, 114.0, 109.5, 107.1, 100.0, 51.1, 29.8, 20.4, 14.0.
IR, (cm−1): 2956, 2930, 2870, 2226, 1614, 1553, 1515, 1483, 1412, 1353, 1289, 1253, 1214, 1189, 1144, 1110, 1071, 918, 822, 775, 753, 659, 578, 536.
HR MS (MALFDI-TOF) [m/z]: calc.: 813.3308, found: 813.3668.
Pd(II) complex of (4E,5E)-4,5-bis(4-(dibutylamino)-2-hydroxybenzylideneamino)benzene-1,2-dinitrile (Pd-1). Pd-1 was prepared analogously to Pt-1 but using palladium acetate (144 mg, 0.64 mmol, 2 eq.) instead of Pt(BN)2Cl2. Yield: 131 mg (55%) of red powder.
1H-NMR: (300 MHz, CDCl3): δ [ppm] = 7.77 (s, 2H), 7.73 (s, 2H), 7.02 (d, 2H), 6.32 (s, 2H), 6.22 (d, 2H), 3.33 (m, 8H), 1.67 (m, 8H), 1.39 (m, 8H), 0.97 (t, 12H).
13C-NMR: (75 MHz, CDCl3): δ [ppm] = 168.9, 155.5, 148.2, 146.4, 137.0, 119.3, 115.9, 113.6, 109.9, 106.9, 99.7, 51.1, 29.9, 20.3, 14.0.
IR, (cm−1): 2956, 2923, 2862, 2220, 1610, 1544, 1512, 1477, 1410, 1344, 1293, 1250, 1213, 1179, 1140, 1112, 1067, 900, 820, 769, 728, 654, 577, 533.
HR MS (MALFDI-TOF) [m/z]: calc.: 724.2674, found: 724.3104.
The Pd-1/PViCl-PAN layer was additionally coated by a light-scattering layer prepared by coating a “cocktail” containing 200 mg of liphophilic titanium dioxide (P170, Kemira, Finland), 500 mg of silicone E4 (Wacker, Germany) and 800 mg of hexane. This layer was allowed to cure under ambient conditions for 24 h and was covered by a black layer using a graphite spray from Conrad (Austria).
:acetone mixture (1:1 v/v; 0.2 wt% of the polymer in the solvent mixture). The nanoparticles were formed by rapid addition of water under vigorous stirring followed by evaporation of the organic solvents under reduced pressure. The nanoparticles contained 1 wt% of dye with respect to the polymer.
2.2 Measurements
The absorption spectra were recorded on a CARY 50 UV-Vis spectrophotometer from Varian (Palo Alto, United States). Luminescence spectra were acquired on a FluoroLog 3 spectrofluorometer from Horiba Scientific equipped with a NIR-sensitive R2658 photomultiplier from Hamamatsu. Relative luminescence quantum yields were determined according to Crosby and Demas49 using solutions of Lumogen red in chloroform (Φ = 0.96)50 and platinum(II) octaethylporphyrin in toluene (Φ = 0.41)51 as references. The quantum yield of Zn-1 was estimated using fluorescein as a standard (Φ = 0.90).49 The solutions of the complexes were deoxygenated in a screw-cap cuvette (Hellma; Müllheim, Germany) by bubbling argon through the solution for 10 minutes. Absolute luminescence quantum yields of the dyes embedded in polymers and nanoparticles were measured using a Quanta-ϕ integrating sphere from Horiba. Deep temperature measurements were performed on a FluoroLog 3 spectrofluorometer with a solution of dyes in a mixture of toluene and tetrahydrofuran (4:6 v/v) which forms frozen glass at 77 K.
Luminescence decays were acquired in a time domain on a FluoroLog 3 spectrofluorometer equipped with a DeltaHub module (Horiba Scientific) controlling a SpectraLED-390 (λ = 392 nm) and using DAS-6 Analysis software for data analysis. In order to acquire the temperature dependence of the luminescence spectra/decay time, a sensor foil was placed in a 1 cm glass cuvette filled with water with the temperature adjusted with a Peltier-element cuvette adaptor from Varian.
The fiber-optic temperature microsensor was read-out with a modified Firesting-mini phase fluorometer from PyroScience (http://www.pyro-science.com). The device was equipped with a 465 nm excitation LED, a Linos DT-cyan dichroic mirror and a Schott OG 590 long-pass filter used in combination with a Deep Golden Amber plastic filter from Lee filters (http://www.leefilters.com). The modulation frequency of 12 kHz was used. The fiber-optic probe was rapidly transferred between two water-filled beakers kept at 40 °C and ∼1 °C (ice water). The PT-100 resistance thermometer used for comparison studies was read-out with a Firesting oxygen meter from PyroScience.
Imaging of the temperature planar sensor was performed with a Sensicam time-gated CCD camera (PCO, Germany) with the general set-up reported elsewhere.52 Excitation was performed with a high power 458 nm 10 W LED array (http://www.led-tech.de). The average decay time was calculated from the luminescence intensities measured in two time windows.52
3. Results and discussion
3.1 Synthesis
The complexes were synthesized in one step upon condensation of 4-(dibutylamino)-2-hydroxybenzaldehyde with 4,5-diaminophthalonitrile in the presence of a salt of the respective metal and under acidic conditions (Fig. 1). While Zn(II) and Pd(II) could be obtained in good yield (>50%) the yield of the corresponding Pt(II) complex is much lower (∼5%). Our attempts to prepare the corresponding metal-free ligand via reaction of 4-(dibutylamino)-2-hydroxybenzaldehyde with 4,5-diaminophthalonitrile under acidic conditions failed since only a monosubstituted product was formed (ESI†). We also attempted to prepare chelates with other metal ions such as Gd(III) and Yb(III). Despite intriguing photophysical properties (see below) these derivatives could not be isolated due to poor stability and have an unknown stoichiometry. | ||
| Fig. 1 Synthesis of the Schiff base complexes with 1. | ||
The complexes of Pt(II) and Pd(II) show good solubility in organic solvents. In contrast, the Zn(II) complex is poorly soluble in non-coordinating solvents but dissolves fairly well in dimethylformamide. Addition of small amounts of coordinating pyridine strongly enhances the solubility of the Zn(II) complex in other solvents.
3.2 Photophysical properties
The absorption of the new complexes is shown in Fig. 2. As can be seen, the dyes efficiently absorb in the blue-green part of the electromagnetic spectrum. The absorption of the Pt(II) and Pd(II) complexes is particularly efficient with the molar absorption coefficients ε exceeding 85000 M−1 cm−1 (Table 1) which is explained by the donor–acceptor character of the chromophore. In fact, similar Pt(II) complexes of Schiff bases lacking the donor–acceptor character feature about 10-fold lower molar absorption coefficients in the visible part of the spectrum.39 The ε values are also much higher than those for most reported Pt(II) and Pd(II) complexes with the exception of π-extended porphyrins. Interestingly, the absorption bands of the Pt(II) complex are ∼12 nm bathochromically shifted compared to the Pd(II) dye. This trend is in good agreement with the effect observed for reported Schiff base complexes.41
 | ||
| Fig. 2 Spectral properties of the Schiff base complexes with 1. (A) Absorption spectra in toluene at room temperature; (B) excitation spectra in toluene:THF (4:6, v/v) at 77 K; (C) emission spectra in toluene:THF (4:6, v/v) at 77 K. The inset shows the emission of Pt-1 in anoxic (left) and air-saturated (right) toluene at room temperature. | ||
| Complex | λ max abs (ε), nm (M−1 cm−1)a | λ max em, nm at 293 Ka | Φ at 293 Ka | τ, s at 293 Ka | λ max em, nm at 77 Kb | Φ at 77 Kb | τ, s at 77 Kb |
|---|---|---|---|---|---|---|---|
|
a In toluene.
b In toluene:THF (4:6), v/v.
c Small amount of pyridine added to increase the solubility.
|
|||||||
| Zn-1 | 426 (65000); 513 (44600) |
554 (fl) | 0.31 (fl), 0.03 (df) | n.d. | 541 (fl); 579 (fl); 622 (phos), 683 (phos) | 0.58 (fl), 0.15 (phos) | 0.17 (phos) |
| Pd-1 | 447 (60800); 487 (55000); 520 (85600) |
613 (phos) | 0.0006 | n.d. | 607 | 0.62 | 325 × 10−6 |
| Pt-1 | 448 (45500); 499 (52200); 532 (96700) |
627 (phos) | 0.65 | 10.3 × 10⁻⁶ | 622 | 0.61 | 12.7 × 10⁻⁶ |
Among the new dyes, the Pt(II) complex Pt-1 was found to be highly emissive in anoxic solutions at room temperature (Fig. 2C, inset; Fig. S1, ESI,†Table 1). The emission is attributed to phosphorescence due to the decay time in the microsecond time domain (10.3 μs). The phosphorescence quantum yield is very high (65%) resulting in unmatched overall brightness of the compound. The brightness of the Pt(II) complex (ε·Φ = 63000) is comparable to that of the Ir(III) coumarin complexes (ε·Φ = 50000 for Ir(CS)2(acac))35 which are among the brightest phosphorescent emitters reported so far. Notably, the absorption and emission bands of Pt-1 are bathochromically shifted by ∼60 nm compared to the Ir(III) complex (λmax 472 and 563 nm for absorption and emission, respectively).35 Thus, Pt-1 covers a very important spectral range complementing the existing palette of bright phosphorescent emitters. The most intense band (λmax 532 nm) shows excellent compatibility with the emission of bright green LEDs which is highly attractive for realization of compact devices for sensing applications.
In contrast to Pt-1, the Pd(II) complex Pd-1 is only weakly emissive in solution at room temperature with the phosphorescence quantum yield well below 1%. Interestingly, at 77 K the phosphorescence of both complexes is similarly efficient (Fig. 2C and Table 1).
The Zn(II) complex Zn-1, shows bright green fluorescence in solution at room temperature (Fig. S2, ESI,†λmax 554 nm, Φ = 31%). The absorption and emission spectra match very well with those obtained in the literature for a very similar complex of Zn(II) which bears ethyl groups instead of butyl groups.53 The fluorescence intensity is enhanced upon deoxygenation, indicating the contribution of thermally-activated delayed fluorescence (TADF). In good agreement with this observation, in frozen glass at 77 K phosphorescence is observed instead of TADF (Fig. 2C). The phosphorescence decay time at 77 K is extremely long (0.17 s). Under the same conditions, the phosphorescence decay time of the Pd(II) and Pt(II) complexes is much shorter (325 and 12.7 μs, respectively) which is explained by the heavy atom effect in these complexes. Due to the ability of Zn(II) to coordinate additional ligands, investigation of complexes with pyridyl-functionalized ligands54,55 may be an interesting direction for future work particularly in view of the potential applications of such dyes in light-emitting diodes.54
Encouraged by the excellent photophysical properties of the new Pt(II) complex we evaluated the ability of the new ligand to act as a sensitizer of the lanthanide luminescence. Although the complexes could not be isolated in a pure form and readily hydrolysed upon purification, the spectral properties in solution indicate the high potential of the new Schiff base to act as an efficient antenna. In fact, the Gd(III) chelate (stabilized in basic media in the presence of PF6− ions) showed efficient phosphorescence (λmax = 618 nm, τ = 66 μs) in anoxic solutions at room temperature (Fig. S3, ESI†). When complexed with Yb(III), the Schiff base was able to sensitize the luminescence of this lanthanide with characteristic peaks at 974 and 1020 nm (Fig. S4, ESI†). Evidently, to make full use of the excellent sensitization properties of the new antenna, the stability of the complexes has to be enhanced, for instance by exploring the stabilization strategies reported in the literature (additional coordination sites in the Schiff base structure).56,57
High brightness of the Pt(II) complex suggests many potential applications, for instance as an advanced label for time-resolved measurement or as an oxygen probe. Suitability for multi-photon excitation is of particular interest since despite the large number of multi-photon emitters reported in the last few years58,59 rather few analyte-sensitive probes suitable for this method have been reported. For example, several probes for two-photon (2-P) imaging of oxygen distribution have been reported by Vinogradov and co-workers60–62 but a rather sophisticated design is important to achieve high multi-photon excitability. The new Pt(II) chelate may represent a simple alternative to these systems due to the push–pull character favouring 2-P absorption. Indeed, similar structures were demonstrated to possess significantly higher 2-P absorption cross-sections than conventional dyes.53 In order to evaluate the potential of Pt-1 for 2-P imaging the dye was embedded into polymeric nanoparticles. We used Rl-100 as a matrix since the nanoparticles prepared from this polymer were previously demonstrated to have high potential for intracellular imaging.48 For comparison, we also stained the Rl-100 beads with platinum(II) tetra-pentafluorophenylporphyrin (Pt-TFPP) which is the most commonly used oxygen indicator. The emission spectrum of both dyes is very similar (Fig. 3A). The 2-P emission spectrum of Pt-1 matches very well with the emission of the dye under 1-P excitation (Fig. S1, ESI†). As can be seen from Fig. 3B, the 2-P emission of Pt-TFPP is excitable at about 1000 nm. In contrast, the 2-P excitation spectrum of Pt-1 is very broad and extends over the whole NIR part of the spectrum. Overall, the emission of the Schiff base under 2-P excitation is 10-fold stronger than that of PtTFPP. This difference is even higher if the Schiff base is excited at about 840 nm and not at 1050 nm. Estimation of phosphorescence quantum yields (anoxic conditions) for both dyes in Rl-100 nanoparticles revealed the values of 0.16 and 0.26 for Pt-1 and PtTFPP, respectively. Thus, the Φ of Pt-1 in Rl-100 beads is significantly lower than that in toluene solution (∼4-fold) and polystyrene (∼2-fold; see below). This is likely caused by some aggregation of the very lipophilic dye in the water-swollen polar Rl-100 polymer and indicates large room for potential improvement. Increased compatibility of the dye with the polymer might be achieved via chemical modification of the dye with functional groups for better solubilisation or covalent immobilization. Assuming that the quantum yields under 1-P and 2-P excitation are identical, it can be concluded that the 2-P absorption cross-section of Pt-1 is much higher (about 16-fold) compared to that of PtTFPP. This correlates well with the results of Xie and co-workers who determined a high 2-P absorption cross-section (190 GM) for a close analogue of Zn-1 bearing ethyl groups instead of butyl groups.53 It can be concluded here that the new phosphorescent emitter represents a very interesting system for potential application in 2-P microscopy due to the good match with the NIR optical window and the excellent separation of the 2-P excitation and emission peaks preventing undesired interference.
 | ||
| Fig. 3 Emission (A) and two photon excitation (B) spectra of Rl-100 nanoparticles stained with Pt-1 and Pt-TFPP. For the emission spectra, λexc was 1050 nm and 1000 nm for Pt-1 and Pt-TFPP, respectively; for the excitation spectra λem was 626 ± 5 nm and 646 ± 5 nm, respectively. The measurements were performed under anoxic conditions. | ||
3.3 Photostability
To assess the photostability of the new Pd(II) and Pt(II) complexes, the solutions were irradiated with a high power blue LED array. The phosphorescent iridium(III) coumarin complex Ir(CS)2acac35 was used for comparison since its photophysical properties (absorption and emission, brightness, decay time) are similar to that of Pt(II) and it proved to be a good indicator for oxygen sensing applications.35 As can be seen (Fig. 4), the photostability of the new dyes is much better than that of the Ir(III) complex. For instance, about 3.5% of Pt-1 is degraded upon irradiation of the air-saturated solution for 10 min. Under the same conditions, about 55% of the Ir(III) complex is destroyed. Deoxygenation of the solution of Pt-1 improves the photostability, which may indicate participation of photosensitized singlet oxygen in the photodegradation mechanism. Considering the very high intensities of the excitation light it can be concluded that the photostability of the new dyes is sufficiently good to enable virtually all potential applications. | ||
| Fig. 4 Photodegradation of Pd-1, Pt-1 and Ir(CS)2acac complexes in toluene upon irradiation with a high power 458 nm 10 W LED array (photon flux 5600 μmol s−1 m−2). | ||
3.4 Optical oxygen sensing
The excellent phosphorescence brightness and comparably long decay time of the Pt-1 make it an attractive candidate for optical oxygen sensing. In order to evaluate the oxygen sensing capabilities, the dye was immobilized into polystyrene which is an attractive matrix due to high optical transparency, good mechanical properties, chemical robustness and favourable oxygen permeability. The photophysical properties of the immobilized dye (Fig. S7, ESI†) are similar to those of the solution. The absorption maxima are located at 451, 504 and 537 nm and the phosphorescence peak is at 633 nm. Upon immobilization, some decrease of the luminescence quantum yield and decay time is observed (Φ = 0.38 and τ = 7.3 μs at 25 °C and under anoxic conditions) compared to the solution, which may be due to some aggregation of the dye in the polymer since its concentration is comparably high (1 wt%).As can be observed (Fig. 5), the oxygen sensing properties of Pt-1 in polystyrene are similar to those of the reported phosphorescent oxygen indicators.12 In agreement with the comparably short luminescence decay time, the dynamic range of the sensor spans from about 0.1 to 100 kPa O2. The quenching efficiency increases with temperature. A pronounced thermal quenching of the luminescence of Pt-1 is observed, manifested by decrease of the phosphorescence decay time in the absence of oxygen (Fig. 5A). The temperature coefficient at 25 °C is ∼−0.32%τ/K. This value is significantly higher than that for Pt(II) tetraphenyltetrabenzoporphyrin (−0.06%/K)63 but is comparable to that of the Pd(II) tetraphenyltetrabenzoporphyrin (−0.33%/K),63 NIR-emitting Pt(II) Schiff base complexes (−0.31%/K)41 and ruthenium(II) tris(4,7-diphenyl-1,10-phenanthroline) (−0.46%/K).35 The results suggest that the oxygen-sensing materials based on Pt-1 can represent an alternative to the state-of-the-art sensors. They may be particularly beneficial as 2-photon oxygen probes due to fairly strong emission under 2-P excitation and excellent compatibility with the 2-P lasers and detectors (photomultipliers) used in microscopes.
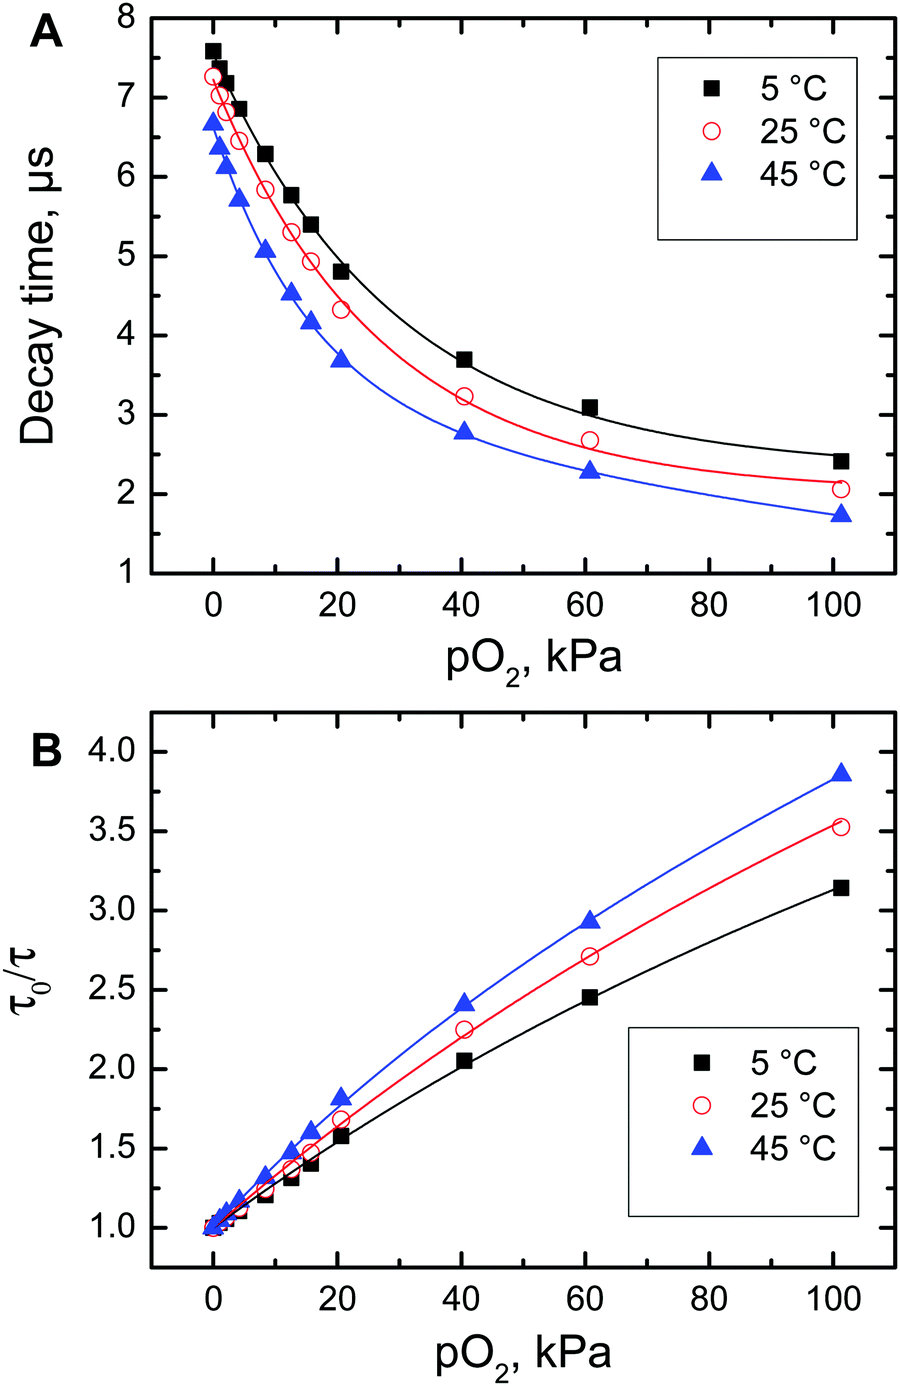 | ||
| Fig. 5 Decay time (A) and Stern–Volmer (B) plots for luminescence quenching of polystyrene-immobilized Pt-1 by oxygen. | ||
3.5 Optical temperature sensing and imaging
Oxygen-sensing experiments demonstrated significant thermal quenching of the luminescence of Pt-1 in polystyrene. In the case of Pd-1, on one hand, very strong phosphorescence was observed in frozen glass in the 77 K solution, and, on the other hand, very weak emission at room temperature, suggesting even stronger temperature effects. In order to explore the potential temperature-sensing capabilities of the new dyes, they were embedded into poly(vinylidene chloride-co-acrylonitrile) (PViCl-PAN) which is a polymer with extremely low oxygen permeability (P = 0.0031 × 10⁻¹³ cm3(STP) cm cm−2 s−1 Pa−1;64 compared to polystyrene with P = 2 × 10⁻¹³ cm3(STP) cm cm−2 s−1 Pa−1).65Upon immobilization into the rigid polymer matrix the phosphorescence quantum yield of Pd-1 increased to an appreciable 14% at 25 °C. Considering the high molar absorption coefficients the brightness of this material is high enough to enable sensing and imaging applications. Fig. 6A shows that the phosphorescence intensity is highly temperature-dependent. An almost linear decrease of the intensity with temperature is observed (Fig. 6A, insert). Some increase in the intensity at the shorter wavelengths may be due to appearance of the thermally-activated delayed fluorescence. Fig. 6B demonstrates that the phosphorescence decay time of Pd-1 in PViCl-PAN also strongly decreases with temperature. Comparison of the normalized intensity and decay time dependencies (Fig. S8, ESI†) reveals the identical effect of temperature on both parameters. The temperature dependence of the luminescence decay time is of particular interest since the decay time is a self-referenced parameter which is not affected by the intensity of the excitation source, sensitivity of the photodetector, scattering and coloration of the probe etc. Moreover, only a few decay-time based probes (based on small molecules or inorganic phosphors) for measurements at ambient temperatures have been reported. The temperature coefficient of the decay time for the Pd-1/PViCl-PAN material is −2.07%/K at 25 °C and −2.76%/K at 37 °C which places the new thermometer among the most sensitive ones reported so far. For instance, the temperature coefficient at 25 °C was around −2.2%/K for Eu(III) complexes66,67 and varied from −2.0 to −3.7%/K for the recently reported TADF emitters,37 whereas for a ruthenium(II) tris-phenanthroline complex68 and Cr(III)-activated yttrium aluminium borate69 it was −0.64 and −0.9%/K, respectively. Notably, even some commercial optical thermometers utilize ruby with its moderate temperature coefficient of −0.25%/K.70,71
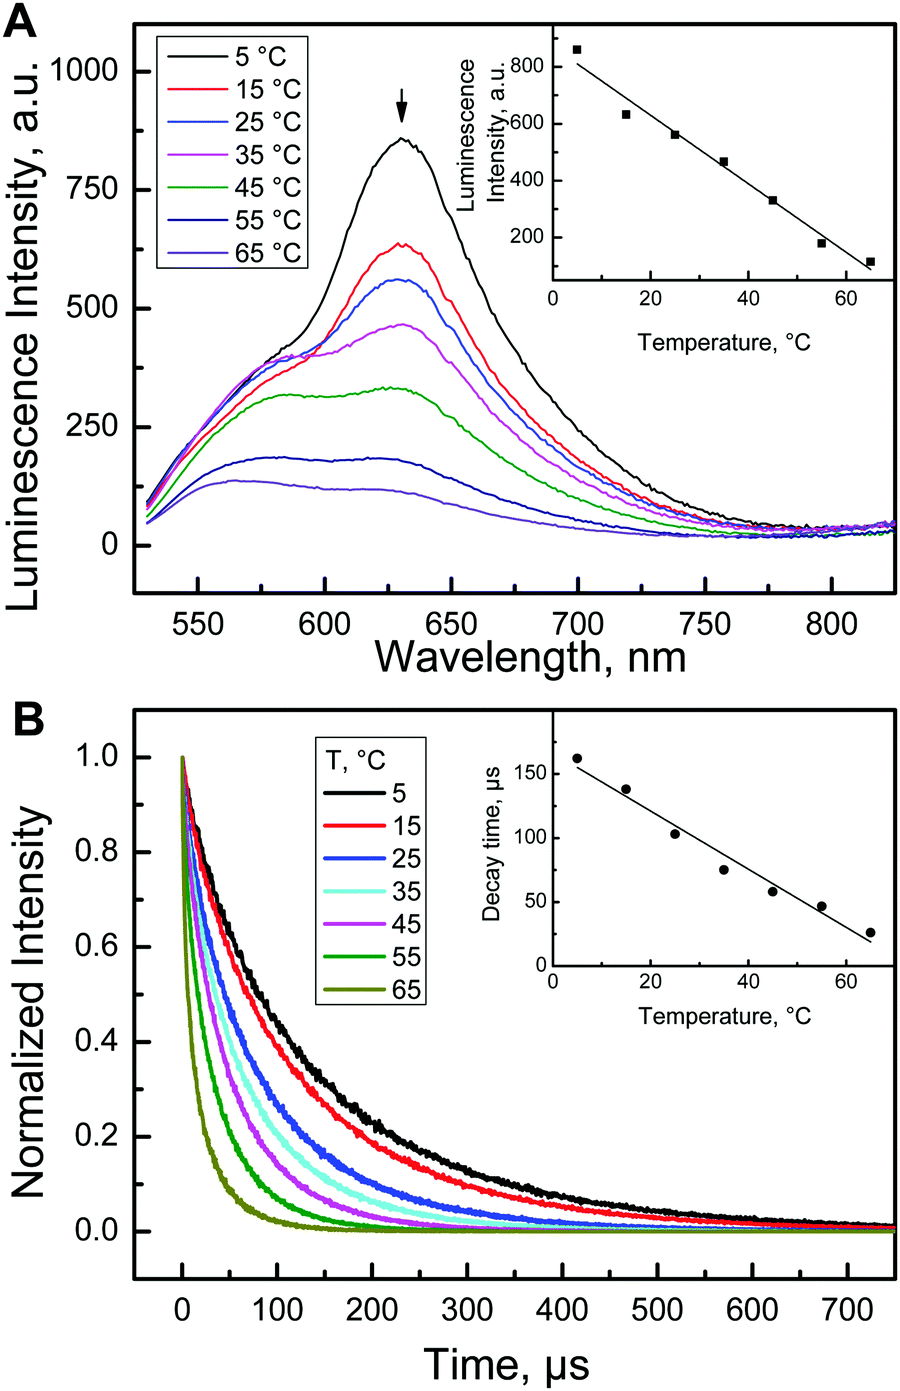 | ||
| Fig. 6 Temperature-sensing properties of Pd-1 immobilized in PViCl-PAN. (A) Temperature dependence of the emission spectra; (B) temperature dependence of the luminescence decay time. | ||
Although PViCl-PAN possesses very low oxygen permeability, some cross-talk of the temperature optode to oxygen is still possible. Indeed, at 25 °C the measured decay time changed from 103 μs in nitrogen atmosphere to 98 μs in air. This corresponds to an error of 1.2 °C if the oxygen concentration is unknown and varies over the whole range.
Imaging of the temperature distribution is another important application of molecular thermometers,18 for instance for compensation of the temperature cross-talk of pressure-sensitive paints.72,73Fig. 7 demonstrates an imaging experiment performed with a gated CCD camera. The calibration plot (Fig. S9, ESI†) is similar but not fully identical to that seen in Fig. 6B. This is likely due to the fact that in the imaging experiment the so called rapid lifetime determination method52 was used, i.e. the decay time is calculated from measuring the luminescence intensity in two time windows.
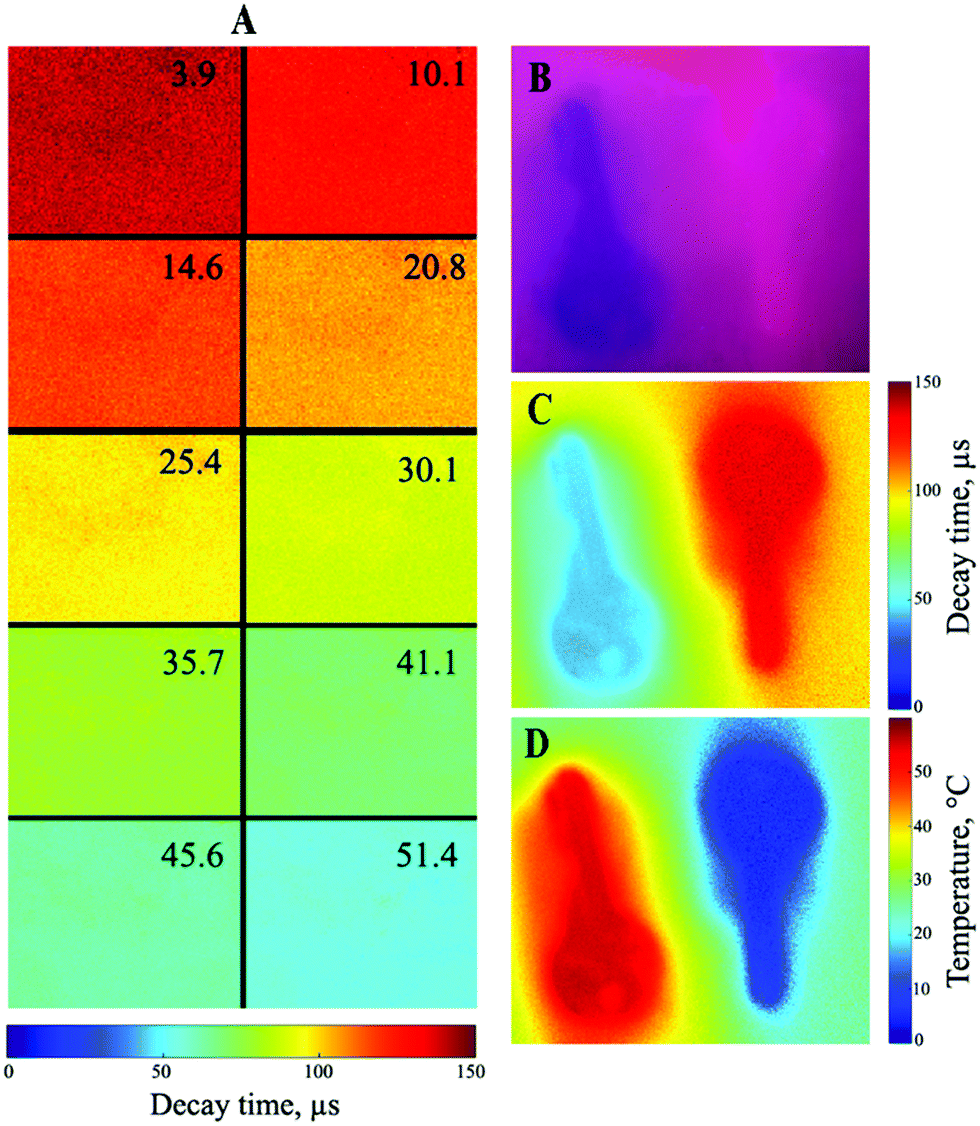 | ||
| Fig. 7 Application of the Pd-1/PViCl-PAN planar optode for lifetime imaging of temperature. (A) False color decay time images of a sensor foil with temperatures (°C) indicated in the upper right corner. (B–D) Time-resolved imaging with the help of the same planar optode positioned over two keys. (B) RGB image of emission under excitation with a blue 465 nm LED; (C) false color decay time distribution; (D) corresponding false color image of temperature distribution. | ||
Fiber-optic temperature microsensors may represent a promising alternative to conventional resistance thermometers. Optical microsensors can be manufactured in different sizes which is determined by the diameter of the fiber used and whether the tip of the fiber is tapered or not. Similar to other types of luminescent microsensors, the manufacture of new temperature probes is very straightforward since the temperature-sensitive “cocktail” is directly coated onto the tip of the fiber (Fig. 8A). Here we use Pt-1 embedded into PViCl-PAN although application of Pd-1 in the same material is also possible. The behaviour of the Pt-1/PViCl-PAN-based material is generally similar to that of the sensor based on Pd-1; linear decrease of the decay time with temperature is observed (Fig. 8B). Although the temperature coefficient at 25 °C is moderate (−0.52%τ/K), it is still sufficient for reliable temperature sensing.
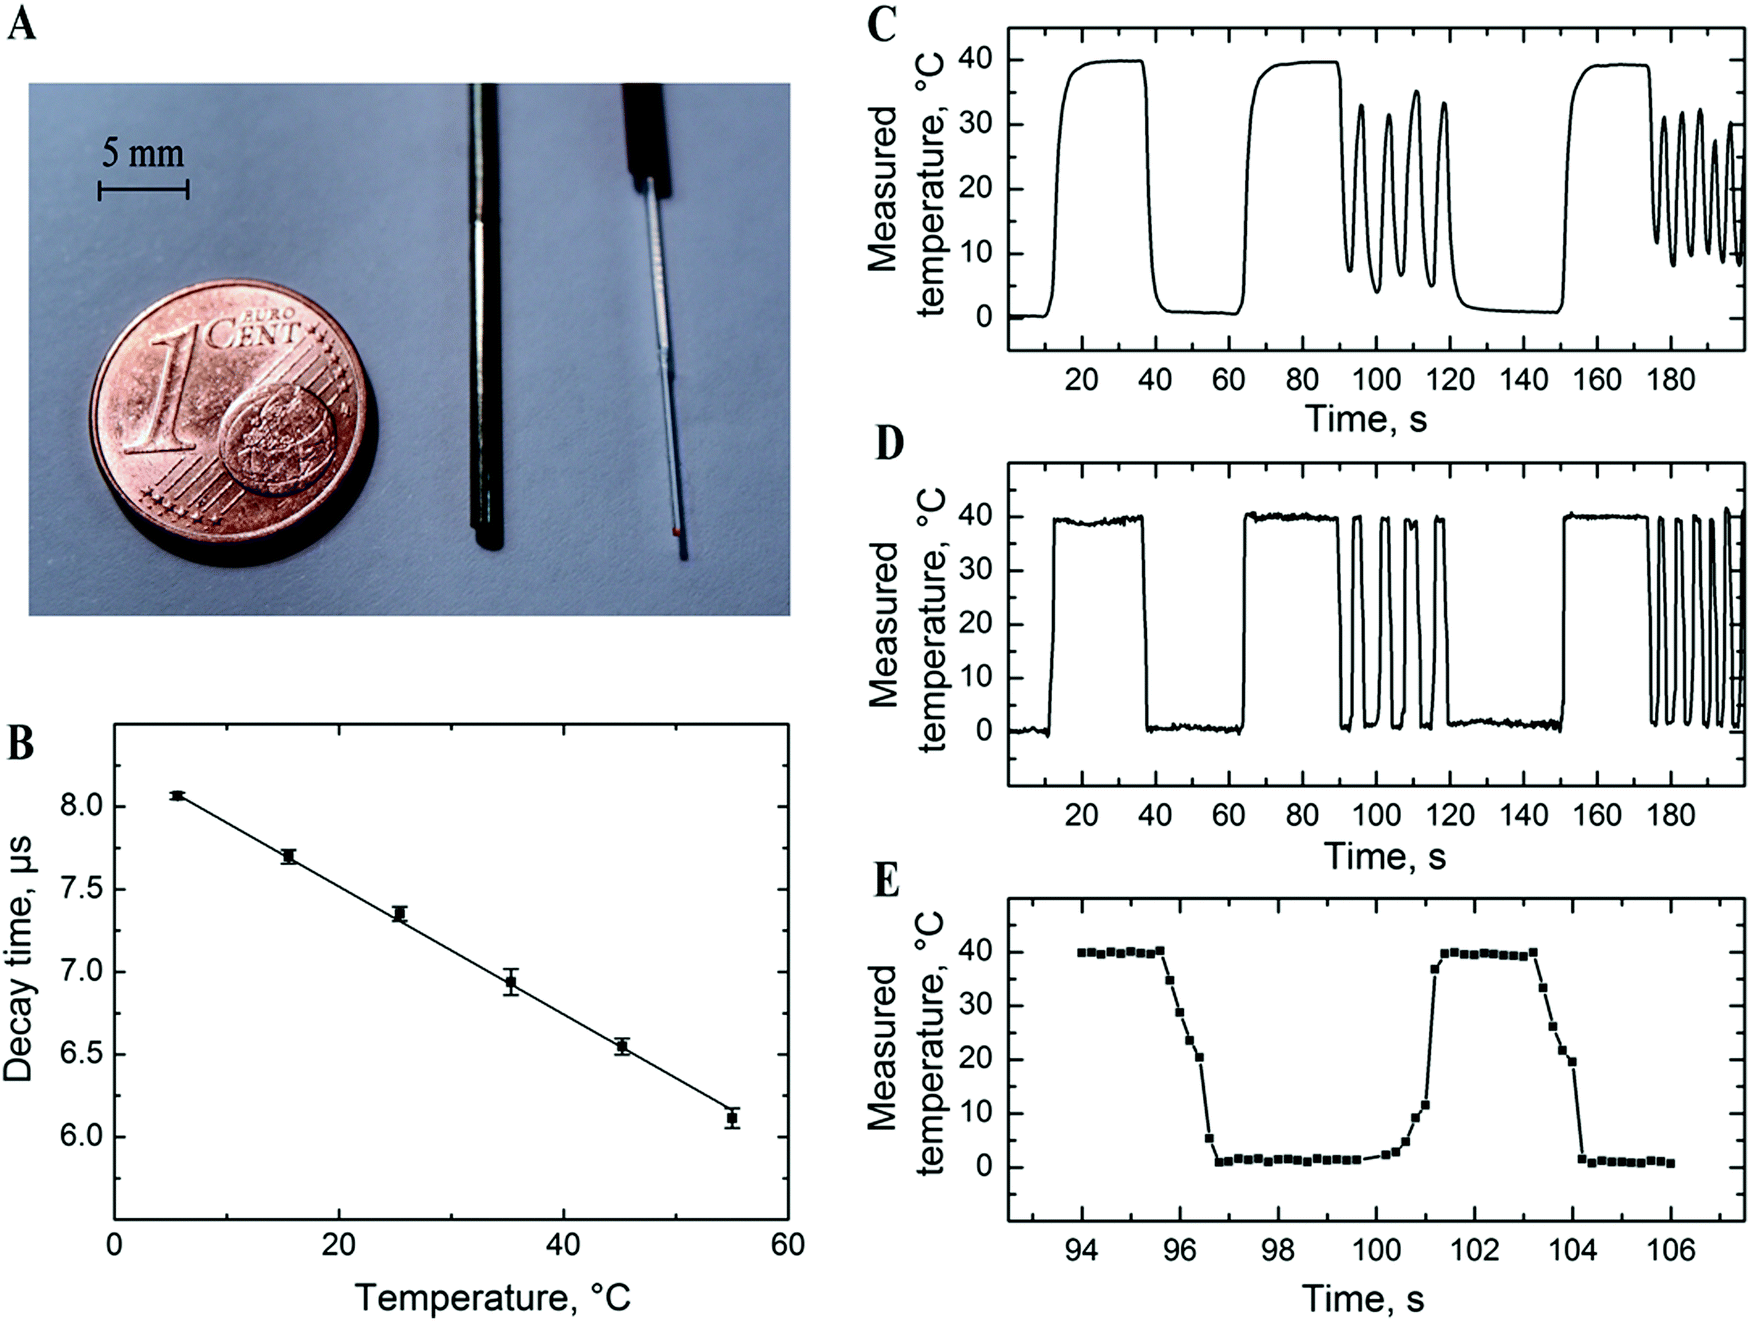 | ||
| Fig. 8 Temperature-sensing properties of the Pt-1/PViCl-PAN microsensor. (A) Photographic image of the fiber optic microoptode (right) along with the conventional resistance thermometer PT-100 (middle) and 1 euro cent coin (left). (B) Temperature dependence of the luminescence lifetime of the sensor read-out with a Firesting compact phase fluorometer from PyroScience. (C–E) Fast temperature changes monitored by the PT 100 resistance thermometer (C) and the optical microsensor (D and E). The sensors were rapidly changed between the beakers kept at 40 °C and ∼1 °C (ice water). (E) Zoom-in for the interval 94–106 s corresponding to the curve in graph D. | ||
Due to their small size (Fig. 8A), optical temperature microsensors not only offer the advantage of measuring in small volumes but also are expected to show a fast dynamic response. The experiment shown in Fig. 8C–E confirms the above expectations. In fact, the optical microsensor excellently resolves both slow and fast temperature fluctuations (Fig. 8D). In contrast, the resistance thermometer (PT-100) followed adequately only comparably slow temperature changes but fails if the changes are too fast (Fig. 8C). The full response time of the new optical microsensor in water is less than 1 s (Fig. 8D) but is likely to be much faster since the recorded response was limited by the time necessary to transfer the sensor from one beaker into the other.
4. Conclusions
The new Schiff base metal complexes feature remarkable photophysical properties including very efficient absorption in the blue-green part of the electromagnetic spectra, room temperature phosphorescence (Pt(II) and Pd(II) complexes) or thermally-activated delayed fluorescence (Zn(II) complex) and good photostability. Moreover, the new Schiff base antenna shows efficient sensitization capabilities for generation of lanthanide luminescence. The Pt(II) complex belongs to one of the brightest phosphorescent emitters reported so far due to the combination of a high molar absorption coefficient and luminescence quantum yield. Immobilization of the Pt(II) complex into an oxygen-permeable matrix leads to a new optical oxygen sensor. Although this material is not necessarily advantageous compared to many state-of-the-art planar optodes and fiber-optic sensors, the nanoparticle-based version may be of high interest to multiphoton imaging of oxygen. Under two photon excitation, the brightness of nanobead-embedded Pt-1 is much higher than for the Pt(II) tetra(pentafluorophenyl)porphyrin dye. Moreover, the 2-P excitation and emission spectra of Pt-1 show excellent compatibility with the biological optical window. Other advantages include excellent separation of the excitation and emission wavelengths and emission in the red part of the spectrum making standard photomultipliers excellently suitable for read-out.Embedding the Pd(II) and Pt(II) dyes into a gas-blocking polymer results in powerful optical thermometers for ambient temperatures. The sensors are realized in several formats such as planar optodes and fiber-optic microsensors. These materials are essentially self-referenced since the phosphorescence decay time acts as the analytical parameter. Remarkably, the temperature coefficients for the material based on the Pd(II) complex are among the highest reported in the literature. Whereas the planar optodes are primarily intended for imaging of temperature on surfaces, the fiber-optic sensors are demonstrated to enable monitoring of very fast temperature fluctuations. In conclusion, the new group of phosphorescent emitters represents a promising platform for the design of optical sensing materials promising for a broad variety of applications.
Conflicts of interest
There are no conflicts to declare.Acknowledgements
We thank Dr Roland Thar (PyroScience GmbH, Germany) for providing the Firesting-mini modified compact phase fluorometer and Petr Zimcik (Charles University, Hradec Kralove) for the valuable discussion. Financial Support from the ERC project “Oxygen” (No. 267233) and from the project EFSA-CDN (No. CZ.02.1.01/0.0/0.0/16_019/0000841) co-funded by ERDF is gratefully acknowledged.References
- Z. Yang, Z. Mao, Z. Xie, Y. Zhang, S. Liu, J. Zhao, J. Xu, Z. Chi and M. P. Aldred, Chem. Soc. Rev., 2017, 46, 915–1016 RSC.
- M. Y. Wong and E. Zysman-Colman, Adv. Mater., 2017, 29, 1605444 CrossRef PubMed.
- Y. Im, M. Kim, Y. J. Cho, J.-A. Seo, K. S. Yook and J. Y. Lee, Chem. Mater., 2017, 29, 1946–1963 CrossRef.
- Y. Tao, K. Yuan, T. Chen, P. Xu, H. Li, R. Chen, C. Zheng, L. Zhang and W. Huang, Adv. Mater., 2014, 26, 7931–7958 CrossRef PubMed.
- H. Xiang, J. Cheng, X. Ma, X. Zhou and J. J. Chruma, Chem. Soc. Rev., 2013, 42, 6128–6185 RSC.
- R. C. Evans, P. Douglas and C. J. Winscom, Coord. Chem. Rev., 2006, 250, 2093–2126 CrossRef.
- J. Kalinowski, V. Fattori, M. Cocchi and J. A. G. Williams, Coord. Chem. Rev., 2011, 255, 2401–2425 CrossRef.
- S. Hirata, K. Totani, J. Zhang, T. Yamashita, H. Kaji, S. R. Marder, T. Watanabe and C. Adachi, Adv. Funct. Mater., 2013, 23, 3386–3397 CrossRef.
- X. Lixin, C. Zhijian, Q. Bo, L. Jiaxiu, K. Sheng, G. Qihuang and K. Junji, Adv. Mater., 2011, 23, 926–952 CrossRef PubMed.
- C. Bizzarri, F. Hundemer, J. Busch and S. Bräse, Polyhedron, 2018, 140, 51–66 CrossRef.
- H. Uoyama, K. Goushi, K. Shizu, H. Nomura and C. Adachi, Nature, 2012, 492, 234–238 CrossRef PubMed.
- M. Quaranta, S. M. Borisov and I. Klimant, Bioanal. Rev., 2012, 4, 115–157 CrossRef PubMed.
- Q. Zhao, F. Li and C. Huang, Chem. Soc. Rev., 2010, 39, 3007–3030 RSC.
- X. Wang and O. S. Wolfbeis, Chem. Soc. Rev., 2014, 43, 3666–3761 RSC.
- D. B. Papkovsky and R. I. Dmitriev, Chem. Soc. Rev., 2013, 42, 8700–8732 RSC.
- B. Nacht, C. Larndorfer, S. Sax, S. M. Borisov, M. Hajnsek, F. Sinner, E. J. W. List-Kratochvil and I. Klimant, Biosens. Bioelectron., 2015, 64, 102–110 CrossRef PubMed.
- L. Tormo, N. Bustamante, G. Colmenarejo and G. Orellana, Anal. Chem., 2010, 82, 5195–5204 CrossRef PubMed.
- X. Wang, O. S. Wolfbeis and R. J. Meier, Chem. Soc. Rev., 2013, 42, 7834–7869 RSC.
- D. B. Papkovsky and T. C. O’Riordan, J. Fluoresc., 2005, 15, 569–584 CrossRef PubMed.
- Q. Zhao, C. Huang and F. Li, Chem. Soc. Rev., 2011, 40, 2508–2524 RSC.
- Y. You, Curr. Opin. Chem. Biol., 2013, 17, 699–707 CrossRef PubMed.
- T. N. Singh-Rachford and F. N. Castellano, Coord. Chem. Rev., 2010, 254, 2560–2573 CrossRef.
- J. Zhao, S. Ji and H. Guo, RSC Adv., 2011, 1, 937–950 RSC.
- J. Zhou, Q. Liu, W. Feng, Y. Sun and F. Li, Chem. Rev., 2015, 115, 395–465 CrossRef PubMed.
- S. Mukherjee and P. Thilagar, Chem. Commun., 2015, 51, 10988–11003 RSC.
- G. He, B. D. Wiltshire, P. Choi, A. Savin, S. Sun, A. Mohammadpour, M. J. Ferguson, R. McDonald, S. Farsinezhad, A. Brown, K. Shankar and E. Rivard, Chem. Commun., 2014, 51, 5444–5447 RSC.
- M. S. Kwon, D. Lee, S. Seo, J. Jung and J. Kim, Angew. Chem., Int. Ed., 2014, 126, 11359–11363 CrossRef.
- Y. Gong, G. Chen, Q. Peng, W. Z. Yuan, Y. Xie, S. Li, Y. Zhang and B. Z. Tang, Adv. Mater., 2015, 27, 6195–6201 CrossRef PubMed.
- Z. An, C. Zheng, Y. Tao, R. Chen, H. Shi, T. Chen, Z. Wang, H. Li, R. Deng, X. Liu and W. Huang, Nat. Mater., 2015, 14, 685–690 CrossRef PubMed.
- C. Zhou, T. Xie, R. Zhou, C. O. Trindle, Y. Tikman, X. Zhang and G. Zhang, ACS Appl. Mater. Interfaces, 2015, 7, 17209–17216 CrossRef PubMed.
- G. Khalil, M. Gouterman, S. Ching, C. Costin, L. Coyle, S. Gouin, E. Green, M. Sadilek, R. Wan, J. Yearyean and B. Zelelow, J. Porphyrins Phthalocyanines, 2002, 6, 135–145 CrossRef.
- D. B. Papkovsky, G. V. Ponomarev, W. Trettnak and P. O’Leary, Anal. Chem., 1995, 67, 4112–4117 CrossRef.
- P. C. Alford, M. J. Cook, A. P. Lewis, G. S. G. McAuliffe, V. Skarda, A. J. Thomson, J. L. Glasper and D. J. Robbins, J. Chem. Soc., Perkin Trans. 2, 1985, 705–709 RSC.
- Y. Chi and P.-T. Chou, Chem. Soc. Rev., 2010, 39, 638–655 RSC.
- S. M. Borisov and I. Klimant, Anal. Chem., 2007, 79, 7501–7509 CrossRef PubMed.
- P. Duan, N. Yanai and N. Kimizuka, Chem. Commun., 2014, 50, 13111–13113 RSC.
- A. Steinegger, I. Klimant and S. M. Borisov, Adv. Opt. Mater., 2017, 5, 1700372 CrossRef.
- C.-M. Che, S.-C. Chan, H.-F. Xiang, M. C. W. Chan, Y. Liu and Y. Wang, Chem. Commun., 2004, 1484 RSC.
- C.-M. Che, C.-C. Kwok, S.-W. Lai, A. F. Rausch, W. J. Finkenzeller, N. Zhu and H. Yersin, Chem. – Eur. J., 2010, 16, 233–247 CrossRef PubMed.
- J. Zhang, F. Zhao, X. Zhu, W.-K. Wong, D. Ma and W.-Y. Wong, J. Mater. Chem., 2012, 22, 16448–16457 RSC.
- S. M. Borisov, R. Saf, R. Fischer and I. Klimant, Inorg. Chem., 2013, 52, 1206–1216 CrossRef PubMed.
- J. Zhang, G. Dai, F. Wu, D. Li, D. Gao, H. Jin, S. Chen, X. Zhu, C. Huang and D. Han, J. Photochem. Photobiol., A, 2016, 316, 12–18 CrossRef.
- A. Monguzzi, S. M. Borisov, J. Pedrini, I. Klimant, M. Salvalaggio, P. Biagini, F. Melchiorre, C. Lelii and F. Meinardi, Adv. Funct. Mater., 2015, 25, 5617–5624 CrossRef.
- J. Zhang, L. Xu and W.-Y. Wong, Coord. Chem. Rev., 2018, 355, 180–198 CrossRef.
- M. Dramicanin, Luminescence Thermometry, Methods, Materials, and Applications, Elsevier, Woodhead Publishing, 1st edn, 2018 Search PubMed.
- W. J. Youngblood, J. Org. Chem., 2006, 71, 3345–3356 CrossRef PubMed.
- P. Zimcik, M. Miletin, H. Radilova, V. Novakova, K. Kopecky, J. Svec and E. Rudolf, Photochem. Photobiol., 2010, 86, 168–175 CrossRef PubMed.
- A. Fercher, S. M. Borisov, A. V. Zhdanov, I. Klimant and D. B. Papkovsky, ACS Nano, 2011, 5, 5499–5508 CrossRef PubMed.
- G. A. Crosby and J. N. Demas, J. Phys. Chem., 1971, 75, 991–1024 CrossRef.
- G. Seybold and G. Wagenblast, Dyes Pigm., 1989, 11, 303–317 CrossRef.
- A. K. Bansal, W. Holzer, A. Penzkofer and T. Tsuboi, Chem. Phys., 2006, 330, 118–129 CrossRef.
- G. Liebsch, I. Klimant, B. Frank, G. Holst and O. Wolfbeis, Appl. Spectrosc., 2000, 54, 548–559 CrossRef.
- D. Xie, J. Jing, Y.-B. Cai, J. Tang, J.-J. Chen and J.-L. Zhang, Chem. Sci., 2014, 5, 2318–2327 RSC.
- J. Zhao, F. Dang, B. Liu, Y. Wu, X. Yang, G. Zhou, Z. Wu and W.-Y. Wong, Dalton Trans., 2017, 46, 6098–6110 RSC.
- J. Zhao, B. Liu, Z. Feng, D. Jin, W. Dang, X. Yang, G. Zhou, Z. Wu and W.-Y. Wong, Polym. Chem., 2017, 8, 6368–6377 RSC.
- X. Zhu, W.-K. Wong, W.-Y. Wong and X. Yang, Eur. J. Inorg. Chem., 2011, 4651–4674 CrossRef.
- X. Yang, R. A. Jones and W.-K. Wong, Dalton Trans., 2008, 1676–1678 RSC.
- G. S. He, L.-S. Tan, Q. Zheng and P. N. Prasad, Chem. Rev., 2008, 108, 1245–1330 CrossRef PubMed.
- Y. Chen, R. Guan, C. Zhang, J. Huang, L. Ji and H. Chao, Coord. Chem. Rev., 2016, 310, 16–40 CrossRef.
- T. V. Esipova and S. A. Vinogradov, J. Org. Chem., 2014, 79, 8812–8825 CrossRef PubMed.
- E. Roussakis, J. A. Spencer, C. P. Lin and S. A. Vinogradov, Anal. Chem., 2014, 86, 5937–5945 CrossRef PubMed.
- T. V. Esipova, H. J. Rivera-Jacquez, B. Weber, A. E. Masunov and S. A. Vinogradov, J. Phys. Chem. A, 2017, 121, 6243–6255 CrossRef PubMed.
- S. M. Borisov, G. Nuss and I. Klimant, Anal. Chem., 2008, 80, 9435–9442 CrossRef PubMed.
- R. A. Wessling, D. S. Gibbs, B. E. Obi, D. E. Beyer, P. T. DeLassus and B. A. Howell, Encyclopedia of Polymer Science and Technology, John Wiley & Sons, Inc, Hoboken, 2002, pp. 458–510 Search PubMed.
- J. Brandrup, E. H. Immergut and E. A. Grulke, Polymer Handbook, John Wiley & Sons Inc, New York, 1999 Search PubMed.
- G. E. Khalil, K. Lau, G. D. Phelan, B. Carlson, M. Gouterman, J. B. Callis and L. R. Dalton, Rev. Sci. Instrum., 2004, 75, 192 CrossRef.
- H. Peng, M. I. J. Stich, J. Yu, L. Sun, L. H. Fischer and O. S. Wolfbeis, Adv. Mater., 2010, 22, 716–719 CrossRef PubMed.
- G. Liebsch, I. Klimant and O. S. Wolfbeis, Adv. Mater., 1999, 11, 1296–1299 CrossRef.
- S. M. Bori‘sov, K. Gatterer, B. Bitschnau and I. Klimant, J. Phys. Chem. C, 2010, 114, 9118–9124 CrossRef PubMed.
- H. Aizawa, N. Ohishi, S. Ogawa, T. Katsumata, S. Komuro, T. Morikawa and E. Toba, Rev. Sci. Instrum., 2002, 73, 3656–3658 CrossRef.
- Y. L. Hu, Z. Y. Zhang, K. T. V. Grattan, A. W. Palmer and B. T. Meggitt, Sens. Actuators, A, 1997, 63, 85–90 CrossRef.
- J. Hradil, C. Davis, K. Mongey, C. McDonagh and B. D. MacCraith, Meas. Sci. Technol., 2002, 13, 1552–1557 CrossRef.
- M. E. Köse, B. F. Carroll and K. S. Schanze, Langmuir, 2005, 21, 9121–9129 CrossRef PubMed.
Footnote |
| † Electronic supplementary information (ESI) available: Details on photophysical properties and calibrations, NMR, IR and mass-spectra. See DOI: 10.1039/c8tc02726a |
| This journal is © The Royal Society of Chemistry 2018 |