 Open Access Article
Creative Commons Attribution 3.0 Unported Licence
Synthesis, crystal structure, magnetic and electronic properties of the caesium-based transition metal halide Cs3Fe2Br9†
Fengxia
Wei
 ab,
Federico
Brivio
 a,
Yue
Wu
 a,
Shijing
Sun
a,
Paul D.
Bristowe
a,
Shijing
Sun
a,
Paul D.
Bristowe
 *a and
Anthony K.
Cheetham
 *a
*a
aDepartment of Materials Science and Metallurgy, University of Cambridge, CB3 0FS, UK. E-mail: akc30@cam.ac.uk; pdb1000@cam.ac.uk
bInstitute of Materials Research and Engineering, Agency for Science, Technology and Research, 2 Fusionopolis Way, Singapore
First published on 13th November 2017
Abstract
The diversity of halide materials related to important solar energy systems such as CsPbX3 (X = Cl, Br, I) is explored by introducing the transition metal element Fe. In particular a new compound, Cs3Fe2Br9 (space group P63/mmc with a = 7.5427(8) and c = 18.5849(13) Å), has been synthesized and found to contain 0D face-sharing Fe2Br9 octahedral dimers. Unlike its isomorph, Cs3Bi2I9, it is black in color, has a low optical bandgap of 1.65 eV and exhibits antiferromagnetic behavior below TN = 13 K. Density functional theory calculations shed further light on these properties and also predict that the material should have anisotropic transport characteristics.
1. Introduction
In the past few years, lead halide perovskites such as APbI3 (A = methylammonium, MA, and cesium) have attracted much attention as photovoltaic materials because of their remarkable photo-conversion efficiency in solar cell devices.1,2 Due to the toxicity of lead and the intrinsic moisture sensitivity of the lead(II) compounds, a search for environmentally friendly alternatives has been undertaken.3 Several perovskite-related families have been proposed, such as double perovskites where Pb2+ is replaced by isoelectronic Bi/In/Sb3+ and a monovalent cation, e.g. (MA)2KBiCl6, (MA)2TlBiBr6, (MA)2AgBiBr6 and the inorganic phases Cs2AgBX6 (X = Cl, Br and B = Bi, In).4–11 Another popular candidate family is A3M2I9, where A = K+, Rb+, NH4+, MA+, Cs+etc., M = Bi3+ and Sb3+, consisting of either corner- and edge-sharing MI6 octahedral layers or face-sharing MI6 dimers.12–16 All of the above systems exhibit very interesting optoelectronic properties.Transition metals have attracted our attention as a method of tuning the optoelectronic properties. For example, using Fe3+ to replace Bi3+ can reduce the bandgap: Cs2NaFeCl6, which adopts a double perovskite architecture (Fig. S1, ESI†) is red, while its Cl analogues with other trivalent cations show much lighter colours. For instance, Cs2NaBiCl6 is yellow17 while the Cs2NaLnCl6 (Ln = Lanthanide) phases are mostly white.18 A much darker color is expected for the hypothetical Cs2NaFeBr6, but our attempts to synthesize this compound yielded black octahedral crystals of composition Cs2FeBr5·H2O (Fig. S2, ESI†), crystallizing in space group Pnma. This material consists of 0D FeBr5O octahedral monomers in which the oxygen is part of a water molecule, as in the known Cs2FeCl5·H2O.19 The dimensionality indicates the degree of connectivity of the octahedra. In this case the octahedra are discrete.
Incorporating Fe into the A3Bi2X9 (X = Cl, Br and I) family turns out to have a long history. Cs3Fe2Cl9, which is dark red in color, was reported to form two polymorphs: a 2D layered system with P![[3 with combining macron]](https://www.rsc.org/images/entities/char_0033_0304.gif) m1 symmetry and 0D dimeric system in space group P63/mmc,20,21 In the latter, both intradimer and interdimer magnetic interactions are present, and the two competing interactions lead to very interesting magnetic properties. In the present work, we report a new compound, Cs3Fe2Br9 (CCDC 1575068), which is isostructural with Cs3Bi2I9 (red)13 and (MA)3Bi2I9 (red),14 yet is black in color. Its variable temperature behavior, thermal stability, optical and magnetic properties are investigated in combination with density functional theory (DFT) calculations.
m1 symmetry and 0D dimeric system in space group P63/mmc,20,21 In the latter, both intradimer and interdimer magnetic interactions are present, and the two competing interactions lead to very interesting magnetic properties. In the present work, we report a new compound, Cs3Fe2Br9 (CCDC 1575068), which is isostructural with Cs3Bi2I9 (red)13 and (MA)3Bi2I9 (red),14 yet is black in color. Its variable temperature behavior, thermal stability, optical and magnetic properties are investigated in combination with density functional theory (DFT) calculations.
2. Experimental and computational methods and results
2.1 Synthesis
A two-step synthesis method was used, involving both hydrothermal and room temperature crystallization. 2 mmol CsBr (99.9%, Sigma Aldrich), 1 mmol FeCl3·6H2O (>99%, Sigma Aldrich) together with 1.5 ml HBr acid (47 wt%) were placed in a 23 ml stainless steel Parr autoclave and heated at 160 °C for 3 days. Intermediate products of brown needle shaped crystals of CsFeBr4 (Fig. S3, ESI†) were formed. The Teflon autoclave was then left in the fume hood at room temperature (>15 °C) and black crystals formed after one week. The following chemical reactions take place during the synthesis:| CsBr + FeCl3·6H2O + 3HBr → CsFeBr4 + 3HCl + 6H2O | (1) |
| CsBr + 2CsFeBr4 → Cs3Fe2Br9 | (2) |
During the hydrothermal process, reaction (1) dominates and almost no black Cs3Fe2Br9 is formed. Even using exact stoichiometric ratios of the starting reagents does not result in the target material. However, black octahedral crystals of Cs3Fe2Br9, ∼0.5 mm in size, can be collected after standing at room temperature for 3 weeks. The sample is soluble in most polar solvents, including water, ethanol and acetone.
2.2 Crystallographic studies
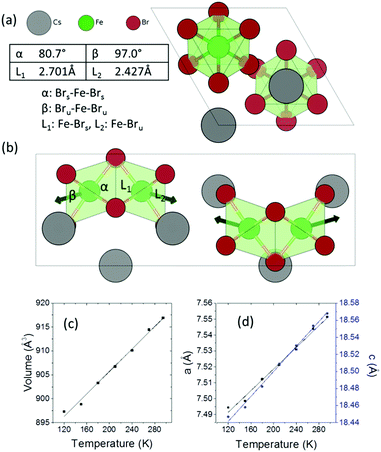
Cs3Fe2Br9 crystallizes in the hexagonal space group P63/mmc (a = 7.5427(8) and c = 18.5849(13) Å). It consists of face-sharing Fe2Br9 octahedral dimers with Cs serving as bridging atoms between the dimers (Fig. 1a and b). The octahedra are slightly distorted, with two sets of Fe–Br bonds (2.427(1) Å and 2.701(2) Å) and distorted Br–Fe–Br angles (80.76(6)°, 90.55(3)° and 97.01(7)°), compared to the nominal octahedral angle of 90°. Due to the Coulombic repulsive force between the cations within the dimer (Fe–Fe distance = 3.585(3) Å), the Fe3+ ions are displaced outwards with respect to the shared face. Therefore, the smallest octahedral angles and longer Fe–Br bonds are found with the shared Br− ions (Fig. 1) and the largest angles and shorter Fe–Br distances are from the unshared ones. According to the interatomic distances, the bond strengths between Fe3+ and unshared Br− are stronger than those with shared Br− ions. Moreover, the angular distortion of the Brshared–Fe–Brunshared angle is minor (90.55°). The shortest distance between Cs and Br is 3.762(1) Å.Variable temperature single crystal diffraction suggests no phase transition down to 120 K. The thermal expansion coefficients are approximately linear with αa = 45.3 MK−1, αc = 39.6 MK−1, giving αv = 131.2 MK−1. The repulsion between the Fe3+ ions in the dimeric unit decreases upon cooling, as shown by the less distorted octahedral dimer and reduced interatomic Fe⋯Fe distances (Fig. S4, ESI†). As a result, negative expansion occurs for the shorter bonds and positive thermal expansion is found for the longer bonds. A similar phenomenon is observed for the octahedral angles: on cooling, the smaller angles tend to increase, while the larger angles decrease.
2.3 Thermal analysis
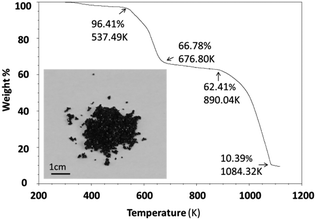
Thermal stability was investigated using an SDT (simultaneous differential scanning calorimetry (DSC) – thermogravimetric analysis (TGA)) Q600 instrument. Powder samples were heated from room temperature to 1123 K at 10 K min−1 under an air flow of 100 ml min−1. Cs3Fe2Br9 is stable until 537.5 K and then experiences a two-step decomposition process (Fig. 2). When the sample is heated, moisture and residual HBr at the particle surfaces start to evaporate, resulting in a small weight loss (∼3.6%) at the beginning of the curve. For comparison, the thermal stability of its bismuth analogues Cs3Bi2I9 and MA3Bi2I9 were also measured; the former decomposed at 636.4 K, while the latter was stable until 529.3 K (Fig. S5 and S6, ESI†).2.4 Optical characterization
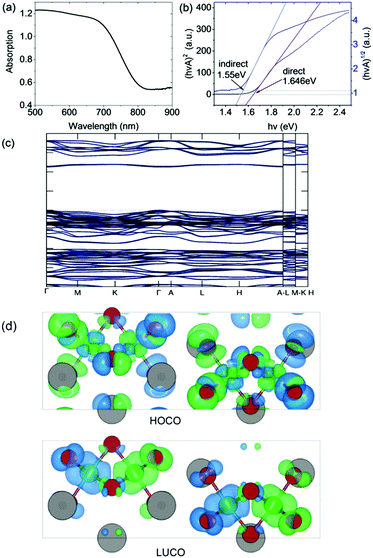
The optical bandgap was measured on a PerkinElmer Lambda 750 UV-Visible spectrometer in the absorption mode with a 2 nm slit width. The scan interval was 1 nm and the scan range was between 500 and 1100 nm. The absorption edge is observed at ∼800 nm (i.e. 1.55 eV). In accordance with our DFT calculation (see below), we deduced a direct optical bandgap of ∼1.65 eV from the Tauc plot derived from the reflectance spectrum (Fig. 3). Note that the analogous A3Bi2I9 phases (A = Cs and MA) were reported to have indirect bandgaps which are larger in the range 1.9 eV to 2.2 eV.22,23 | ||
| Fig. 3 (a) Absorption spectrum and (b) Tauc plot for indirect and direct bandgaps. (c) Band structure (non-magnetic case) calculated using the HSE06 exchange–correlation functional. (d) Charge density isosurfaces (antiferromagnetic case) calculated using the PBEsol exchange–correlation functional and viewed along the b-axis. The top and bottom panels show the Highest Occupied Crystal Orbital (HOCO) and Lowest Unoccupied Crystal Orbital (LUCO) respectively. The charge is displayed using a threshold of 0.001 e Bohr−3. The different spin channels are shown in blue and green. Atom colors are the same as in Fig. 1. | ||
2.5 Density functional calculations
The DFT calculations were performed using the projector augmented wave (PAW) method as implemented in VASP.24 The experimental structure obtained at room temperature was fully optimized using the PBEsol exchange–correlation functional25 which reduced the atomic forces below 1 meV Å−1 at effectively zero Kelvin (see ESI† for further computational details). The resulting atomic positions are given in Table S1 (ESI†). The presence of Fe in the material suggests that it could exhibit magnetic ordering due to unpaired 3d electrons. To examine this possibility, spin-polarized calculations were performed on the optimized structure in the ferromagnetic (FM) state and three possible antiferromagnetic (AFM) states. It was found that one of the AFM states in which neighboring Fe atoms have opposite spin orientation is significantly lower in energy than either the FM or non-magnetic states, by 80 meV f.u.−1 and 335 meV f.u.−1 respectively (see Table S2 (ESI†) for details). The calculations therefore predict that at very low temperatures Cs3Fe2Br9 prefers to be antiferromagnetic. The calculated magnetic moment on each Fe atom is 3.38 μB. This value is lower than the value of 5.79 μB obtained from analysis of the magnetic susceptibility data in the higher temperature paramagnetic region (see below). There are several reasons for this, including the well-known reduction in spin in magnetically ordered structures due to covalency. For example, neutron scattering measurements on FeCl3 show that the spin is reduced to 4.7(3) μB in the antiferromagnetic phase.26Fig. 3 shows charge density isosurfaces corresponding to the HOCO and LUCO for the lowest energy AFM state.In order to determine an improved band structure for Cs3Fe2Br9 the HSE06 hybrid exchange–correlation functional was used,27 although it is acknowledged that GW would normally be the preferred method. The calculation was performed on the non-magnetic state to contain the cost of the calculation and because previous work has indicated that, while HSE06 provides a reasonable band structure, it may not be adequate for magnetic properties.28 The material is found to have a 2.254 eV direct band gap which occurs at the Γ point with a relatively flat band structure (Fig. 3). At the band edge it is possible to calculate the effective masses in the parabolic approximation (Table 1). The values indicate a high anisotropy with reduced transport along the c-direction (Γ → A). The Fe atoms have been described with 3p63d74s1 as valence electrons, while other core states have been substituted by the pseudopotential. The valence band maximum (VBM) contains Fe 3d and Br 4p states, whereas the conduction band minimum (CBM) contains mostly Fe 3d, Fe 4s and Br 4p states.
| Γ → M | Γ → K | Γ → A | |
|---|---|---|---|
| m h*/mo | −0.11 | −0.06 | −1.02 |
| m e*/mo | 0.25 | 0.16 | 13.87 |
2.6 Magnetic measurements
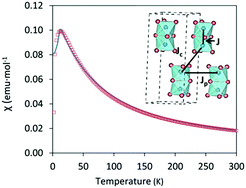
Magnetic susceptibility measurements, χ(T) = M(T)/H, were conducted using a Quantum Design Magnetic Properties Measurement System (MPMS3) with a superconducting interference device (SQUID) magnetometer. Measurements were made after cooling in zero field (ZFC) and in a measuring field (FC) of μ0H = 0.01![[thin space (1/6-em)]](https://www.rsc.org/images/entities/char_2009.gif) T over the temperature range 2 ≤ T ≤ 300
T over the temperature range 2 ≤ T ≤ 300![[thin space (1/6-em)]](https://www.rsc.org/images/entities/char_2009.gif) K. Cs3Fe2Br9 shows antiferromagnetic behavior with a Néel temperature TN = 13 K (Fig. 4), higher than that of analogous Cs3Fe2Cl9 which also exhibits an antiferromagnetic long range order at TN = 5.3 K.29 The results are in good agreement with the DFT calculations.
K. Cs3Fe2Br9 shows antiferromagnetic behavior with a Néel temperature TN = 13 K (Fig. 4), higher than that of analogous Cs3Fe2Cl9 which also exhibits an antiferromagnetic long range order at TN = 5.3 K.29 The results are in good agreement with the DFT calculations.
Appling the Curie–Weiss law in the paramagnetic region (from 50 K to 300 K), a negative Weiss constant of −36.10(3) K was obtained, as expected for an antiferromagnetic compound (Fig. S7, ESI†) and the calculated effective magnetic moment μeff was 5.79(4) μB. In order to obtain a comprehensive χ fitting from 2 K to 300 K, a weakly coupled dimer model was applied (see ESI† for fitting formula).30 This system contains Fe3+ ions as dimeric units Fe2Br9, with three distinct Fe–Fe distances (3.585(3), 7.179(2) and 7.543(1) Å) corresponding to intradimer (J) and interdimer (Jc + Jp) interactions, respectively. The dominant intradimer exchange yields J = −8.2 K, while the weak interdimer interactions between the Fe3+ of neighbouring dimers are given as Jp + Jc = −3.4 K. The intradimer interactions are weaker than those in the Cr counterpart, Cs3Cr2Br9, which was reported to have J = −10.3 K, corresponding to a shorter Cr–Cr distance ∼3.317(4) Å. On the other hand, the interdimer interactions of Cs3Cr2Br9 are weaker with Jp + Jc = −1.1 K due to the longer distances (7.420(1) and 7.507(1) Å).30 In the case of Cs3Fe2Cl9, both intra- and interdimer interactions are smaller (J = −2.4 K and Jp + Jc = −1.2 K for single crystals).29
3. Conclusions
We have synthesized black crystals of Cs3Fe2Br9 and determined its crystal structure. Cs3Fe2Br9 crystallizes in the hexagonal space group P63/mmc and the structure contains Fe2Br9 face-sharing octahedral dimers. The Fe–Br bond strengths differ between the shared and unshared faces, and the distorted octahedra tend to become more symmetrical upon cooling due to the reduced cation–cation Coulombic repulsion. The compound is thermally stable up to 537.5 K, and has an optical bandgap of 1.65 eV. DFT calculations indicate that the band gap is direct and also predict reduced transport along the c-direction. Magnetic susceptibility measurements show antiferromagnetic behavior, with TN = 13 K, and can be fitted with a weakly coupled dimer model. The spin polarized DFT calculations agree with this behavior at low temperatures and predict which antiferromagnetic configuration is preferred.Conflicts of interest
There are no conflicts to declare.Acknowledgements
F. Wei is a holder of an A*STAR international fellowship granted by the Agency for Science, Technology and Research, Singapore. A. K. Cheetham and Y. Wu thank the Ras al Khaimah Center for Advanced Materials for financial support. The calculations were performed at the Cambridge HPCS and the UK National Supercomputing Service, ARCHER. Access to the latter was obtained via the Materials Chemistry Consortium and funded by EPSRC under Grant Number EP/L000202/1.Notes and references
- A. Kojima, K. Teshima, Y. Shirai and T. Miyasaka, J. Am. Chem. Soc., 2009, 131, 6050–6051 CrossRef CAS PubMed.
- M. M. Lee, J. Teuscher, T. Miyasaka, T. N. Murakami and H. J. Snaith, Science, 2012, 338, 643–647 CrossRef CAS PubMed.
- W. Li, Z. Wang, F. Deschler, S. Gao, R. H. Friend and A. K. Cheetham, Nat. Rev. Mater., 2017, 2, 16099 CrossRef.
- F. Wei, Z. Deng, S. Sun, F. Xie, G. Kieslich, D. M. Evans, M. A. Carpenter, P. D. Bristowe and A. K. Cheetham, Mater. Horiz., 2016, 3, 328–332 RSC.
- F. Wei, Z. Deng, S. Sun, F. Zhang, D. M. Evans, G. Kieslich, S. Tominaka, M. A. Carpenter, J. Zhang, P. D. Bristowe and A. K. Cheetham, Chem. Mater., 2017, 29, 1089–1094 CrossRef CAS.
- Z. Deng, F. Wei, S. Sun, G. Kieslich, A. K. Cheetham and P. D. Bristowe, J. Mater. Chem. A, 2016, 4, 12025–12029 CAS.
- A. H. Slavney, L. Leppert, D. Bartesaghi, A. Gold-Parker, M. F. Toney, T. J. Savenije, J. B. Neaton and H. I. Karunadasa, J. Am. Chem. Soc., 2017, 139, 5015–5018 CrossRef CAS PubMed.
- A. H. Slavney, T. Hu, A. M. Lindenberg and H. I. Karunadasa, J. Am. Chem. Soc., 2016, 138, 2138–2141 CrossRef CAS PubMed.
- G. Volonakis, A. A. Haghighirad, R. L. Milot, W. H. Sio, M. R. Filip, B. Wenger, M. B. Johnston, L. M. Herz, H. J. Snaith and F. Giustino, J. Phys. Chem. Lett., 2017, 8, 772–778 CrossRef CAS PubMed.
- G. Volonakis, M. R. Filip, A. A. Haghighirad, N. Sakai, B. Wenger, H. J. Snaith and F. Giustino, J. Phys. Chem. Lett., 2016, 7, 1254–1259 CrossRef CAS PubMed.
- E. T. McClure, M. R. Ball, W. Windl and P. M. Woodward, Chem. Mater., 2016, 28, 1348–1354 CrossRef CAS.
- S. Sun, S. Tominaka, J.-H. Lee, F. Xie, P. D. Bristowe and A. K. Cheetham, APL Mater., 2016, 4, 31101 CrossRef.
- B. Chabot and E. Parthe, Acta Crystallogr., Sect. B: Struct. Crystallogr. Cryst. Chem., 1978, 34, 645–648 CrossRef.
- R. Jakubas, J. Zaleski and L. Sobczyk, Ferroelectrics, 1990, 108, 109–114 CrossRef CAS.
- A. J. Lehner, D. H. Fabini, H. A. Evans, C.-A. Hébert, S. R. Smock, J. Hu, H. Wang, J. W. Zwanziger, M. L. Chabinyc and R. Seshadri, Chem. Mater., 2015, 27, 7137–7148 CrossRef CAS.
- B. Saparov, F. Hong, J.-P. Sun, H.-S. Duan, W. Meng, S. Cameron, I. G. Hill, Y. Yan and D. B. Mitzi, Chem. Mater., 2015, 27, 5622–5632 CrossRef CAS.
- L. R. Morss, M. Siegal, L. Stenger and N. Edelstein, Inorg. Chem., 1970, 9, 1771–1775 CrossRef CAS.
- G. Meyer, Prog. Solid State Chem., 1982, 14, 141–219 CrossRef CAS.
- C. J. O’Connor, B. S. Deaver and E. Sinn, J. Chem. Phys., 1979, 70, 5161–5167 CrossRef.
- H. Yamatera and K. Nakatsu, Bull. Chem. Soc. Jpn., 1954, 27, 244 CrossRef CAS.
- M. T. Kovsarnechan, J. Roziere and D. Mascherpa-Corral, J. Inorg. Nucl. Chem., 1978, 40, 2009–2011 CrossRef CAS.
- B. W. Park, B. Philippe, X. Zhang, H. Rensmo, G. Boschloo and E. M. J. Johansson, Adv. Mater., 2015, 27, 6806–6813 CrossRef CAS PubMed.
- A. J. Lehner, D. H. Fabini, H. A. Evans, C. A. Hébert, S. R. Smock, J. Hu, H. Wang, J. W. Zwanziger, M. L. Chabinyc and R. Seshadri, Chem. Mater., 2015, 27, 7137–7148 CrossRef CAS.
- G. Kresse, Phys. Rev. B: Condens. Matter Mater. Phys., 1999, 59, 1758–1775 CrossRef CAS.
- J. P. Perdew, A. Ruzsinszky, G. I. Csonka, O. A. Vydrov, G. E. Scuseria, L. A. Constantin, X. Zhou and K. Burke, Phys. Rev. Lett., 2008, 100, 136406 CrossRef PubMed.
- J. W. Cable, M. K. Wilkinson, E. O. Wollan and W. C. Koehler, Phys. Rev., 1962, 127, 714–717 CrossRef CAS.
- A. V. Krukau, O. A. Vydrov, A. F. Izmaylov and G. E. Scuseria, J. Chem. Phys., 2006, 125, 224106 CrossRef PubMed.
- R. Grau-Crespo, H. Wang and U. Schwingenschlögl, Phys. Rev. B: Condens. Matter Mater. Phys., 2012, 86, 081101 CrossRef.
- Y. Ishii, N. Noguchi, H. Yoshida and M. Oda, Meet. Abstr. Phys. Soc. Japan, 2016, 71.1, 1081 Search PubMed.
- B. Leuenberger, H. U. Güdel and P. Fischer, J. Solid State Chem., 1986, 64, 90–101 CrossRef CAS.
Footnote |
| † Electronic supplementary information (ESI) available: Additional information, including CIF files, experimental methods and further information on the DFT calculations. CCDC 1575067–1575070. For ESI and crystallographic data in CIF or other electronic format see DOI: 10.1039/c7tc04798c |
| This journal is © The Royal Society of Chemistry 2018 |


