
Stimuli-responsive solid-state emission from o-carborane–tetraphenylethene dyads induced by twisted intramolecular charge transfer in the crystalline state†
Junfeng
Li
a,
Chenglong
Yang
a,
Xuelei
Peng
a,
Ying
Chen
a,
Qi
Qi
*b,
Xiaoyan
Luo
c,
Wen-Yong
Lai
 *a and
Wei
Huang
*ad
*a and
Wei
Huang
*ad
aKey Laboratory for Organic Electronics and Information Displays & Institute of Advanced Materials (IAM), Jiangsu National Synergetic Innovation Center for Advanced Materials (SICAM), Nanjing University of Posts & Telecommunications, 9 Wenyuan Road, Nanjing 210023, China. E-mail: iamwylai@njupt.edu.cn
bSchool of Chemistry and Chemical Engineering, Southeast University, Nanjing 211189, China. E-mail: qiqi027@163.com
cHuai Yin Institute of Technology, Meicheng East Road No. 1, Huai Yin 223001, China
dShaanxi Institute of Flexible Electronics (SIFE), Northwestern Polytechnical University (NPU), 127 West Youyi Road, Xi'an 710072, Shaanxi, China. E-mail: wei-huang@njtech.edu.cn
First published on 14th November 2017
Abstract
We described herein a unique dual emission switching process from o-carborane–tetraphenylethene (TPE) dyads induced by twisted intramolecular charge transfer (TICT) in the crystalline state. Two novel o-carborane–tetraphenylethylene dyads, composed of a TPE core bearing o-carborane units, were designed, synthesized and characterized. Crystalline o-1 and o-2 were obtained with mono-substituted and bi-substituted o-carborane units, respectively. Both dyads presented locally excited (LE) emission and TICT induced emission in solutions. Crystalline o-1 demonstrated aggregation-induced emission (AIE), crystallization-induced emission (CIE), thermochromism, vapochromism, and mechanical luminescence (MCL) properties via TICT, while crystalline o-2 showed only the AIE and CIE properties orginating from the inherent ICT states. From the mechanistic investigations and theoretical calculations, it was demonstrated that the emission was reversible and switchable between green and orange colors for o-1, which was assigned to the facile TICT modulation in the solid state. The results manifest that the unique three-dimensional o-carborane cluster's structure plays an important role in precisely controlling the molecular packing patterns and conformations to achieve TICT emission.
Introduction
Since 2001, stimuli-responsive aggregation-induced-emission (AIE)-active smart materials, which respond to various external stimuli or environmental variations, such as mechanical force, temperature, pH, fuming, photonic irradiation, solvent polarity, electric field and so on, have been intensely explored. They are also ascribed to diverse working mechanisms including conformational planarization,1 J-aggregate formation,2E/Z isomerization,3 excited state intramolecular proton transfer (ESIPT),4 restriction of intramolecular rotations (RIR),5 restriction of intramolecular vibrations (RIV)6 and restriction of intramolecular motions (RIM).7 A twisted intramolecular charge transfer (TICT)-induced organic chromophore is a powerful tool for monitoring conformational alterations in the excited states. Owing to the rotation of the molecules, dual emission bands derived from locally excited (LE) and TICT states in organic solutions were simultaneously observed in a single spectrum, and TICT emission was even observed in the crystalline state.8 However, as far as it is known, no work on stimuli-responsive emission induced by switching the TICT states in the solid state has been reported. This is mainly because of the following two critical factors: concentration quenching and structural restriction in the condensed state. The key challenge in the design and synthesis of stimuli-responsive TICT-induced emissive materials is how to identify and screen a suitable organic dyad that is capable of modulating the molecular conformations by external stimuli.9o-Carborane is a class of electron-deficient icosahedral born cluster with three-center two-electron bonds, and possesses highly polarizable σ-aromatic characteristics. Carborane-based materials have attracted particular interest in boron neutron capture therapy,10 as heat-resistant agents,11 and in coordination/organo-metallic chemistry as ligands.12 Chujo and co-workers have reported the relationship between the electronic states and the conformation of π-conjugated units to the C1–C2 bond of an o-carborane cluster. That is, when π-conjugated planes are twisted to the C1–C2 bond of an o-carborane, intramolecular charge transfer (ICT) occurs more efficiently than in the parallel conformer.13 By making use of this unique character, switching excited emission from LE to ICT was successfully achieved by altering the conformation of the π-conjugation unit. Inspired by the above research, we surmise that the three-dimensional (3D) electron-deficient carborane's structure would provide enough space to allow an o-carborane cluster conformational change in response to external stimuli.14 The 3D bulkiness and electron withdrawing properties of o-carborane clusters would induce switching emission behaviors from various excited states. Nevertheless, switching emission of an o-carborane dyad induced by TICT in response to external stimuli and the corresponding mechanism in the solid state have never been disclosed. We have previously explored a series of carborane-based dyads that show great potential in optoelectronic devices and cellular bioimaging.15 To confirm the switchable TICT process in the crystalline state in response to external stimuli, o-carborane–tetraphenylethylene dyads (o-1 and o-2, Scheme 1) were designed and synthesized.
 | ||
| Scheme 1 Synthetic routs towards o-1 and o-2. | ||
Herein, employing a tetraphenylethylene (TPE) moiety functionalized with an o-carborane group is identified to be beneficial for constructing a 3D twisted conformation to afford a loose packing fashion, which facilitates the switching TICT processes in response to external stimuli in the crystalline state. Initially, both dyads exhibited dual emission from LE and TICT states in organic solutions. The o-carborane–TPE dyad o-1 in the crystalline state displayed AIE, crystallization-induced emission (CIE), thermochromism, vapochromism, and mechanical luminescence (MCL) properties, originating from the TICT emission bands. The data from the X-ray single-crystal analysis and theoretical calculations indicate that the rotation at the o-carborane moiety occurs in the crystalline state in response to external stimuli, leading to switching TICT excited states. While crystalline o-2 shows only the AIE and CIE properties, orginating from the inherent ICT states. From the mechanistic investigations and theoretical calculations, it is clearly demonstrated that the emission is reversible and switchable between green and orange colors for o-1, which is assigned to the facile TICT alteration in the crystalline state. The results manifest that the unique 3D o-carborane cluster's structure plays an important role in precisely controlling the molecular packing patterns and conformations to achieve TICT emission.
Results and discussion
Synthesis and characterization
The synthesis procedures for o-1 and o-2 are outlined in Scheme 1. Both o-1 and o-2 were then fully characterized using 1H NMR, 11B NMR, and 13C NMR, MALDI-TOF-MS spectroscopy as well as X-ray crystal analysis. The products were readily soluble in common organic solvents such as CH2Cl2, CH3Cl, THF, and toluene, but insoluble in methanol and ethanol.To investigate the thermal properties of o-1 and o-2, thermo-gravimetric analysis (TGA) and differential scanning calorimetry (DSC) measurements were carried out under a N2 atmosphere with a scan rate of 10 °C min−1 (Fig. S1, ESI†). TGA revealed that o-1 and o-2 exhibited good thermal stability with 5% weight loss up to 345 °C and 418 °C, respectively. o-1 exhibited a sharp melting endothermic peak at 166 °C, whereas o-2 displayed an endothermic peak approximately at 291 °C, indicating that the thermal stability increased remarkably with the addition of the o-carborane cluster. Thus, o-1 and o-2 are thermally stable and able to provide a desirable thermal property for practical applications in organic optoelectronic devices.
Optical properties
UV-vis absorption is sensitive to the interchromophore distance and orientation, which is widely used to investigate π–π stacking chromophores. As shown in Fig. 1a, UV-vis absorption of o-1 and o-2 was investigated in various solvents (1.0 × 10⁻⁵ M), such as n-hexane, toluene, CH2Cl2, THF and CH3CN. The absorption spectra of o-1 and o-2 in various solvents exhibited the longest absorption maxima at around 322 nm and 329 nm, respectively, which were mainly attributed to the characteristic π–π* transition of TPE chromophores. The theoretical maxima of the absorption spectra of o-1 and cis-o-2 peaked at 355 nm and 352 nm, respectively (Fig. S18, ESI†). Indeed, o-1 and o-2 displayed similar absorption spectra, suggesting that TPE was responsible for the π–π* transition of the chromophores (Fig. S2a, ESI†).16 In film states, o-1 and o-2 displayed well-defined peaks at around 326 nm and 336 nm, respectively, and were much broader and red-shifted with respect to their absorption spectra in organic solution (Fig. S3, ESI†). | ||
| Fig. 1 (a) Normalized UV-vis absorption and (b) emission spectra of o-1 in various solvents at room temperature. Solution concentration: 10 μM. | ||
With the aim of understanding the excited behaviors of o-1 and o-2, we have measured the emission of o-1 and o-2 in various solvents from n-hexane to CH3CN (1.0 × 10⁻⁵ M). As shown in Fig. 1b, the weak emission at around 400 nm can be assigned to fluorescence from the local excited (LE) state, and the corresponding Stokes shift was 78 nm. o-1 showed intense emission at around 552 nm in n-hexane, and the corresponding Stokes shift was 230 nm, whereas the emission band was shifted to 537 nm in CH3CN and its Stokes shift was 215 nm. These large Stokes shifts, which are determined by the difference in wavelength between positions of the band maxima of the absorption and emission spectra of the same electronic transition, are attributed to the TICT processes, suggesting that their solvent polarity plays an important role in determining the excited state electronic conformation (Fig. S4a, ESI†).8a Similar solvent-dependent TICT emissions were also found for o-2 (Fig. S2b and S4b, ESI†).8b Fig. S4 (ESI†) showed Lippert–Mataga plots for the Stokes shift of TICT emission of o-1 and o-2versus the solvent-polarity parameter (Δf). A prominent keen slope was detected from the profiles with the peak positions detected for o-1 and o-2, suggesting that TICT states were seriously affected by the solvent polarity.
Solvatochromism and self-assemblies
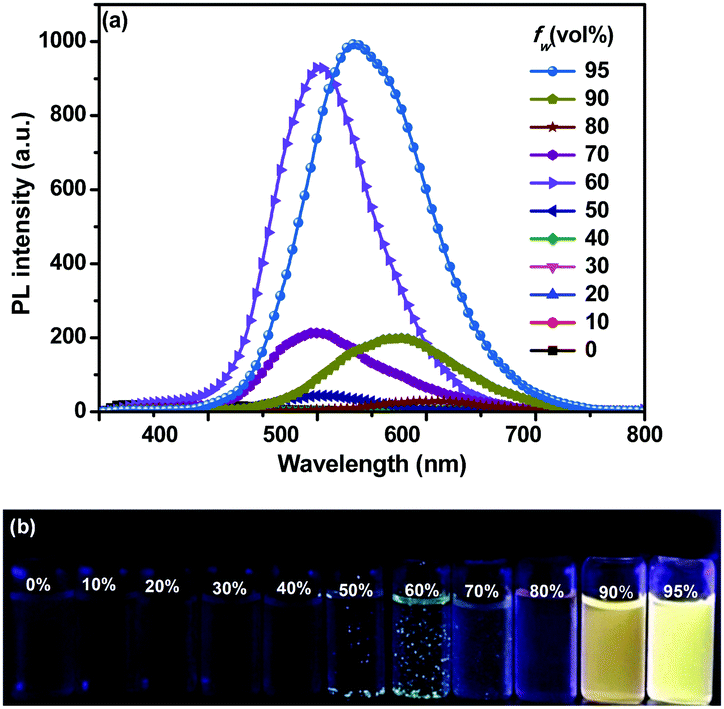
As shown in Fig. S5a (ESI†), o-1 virtually showed a weak emission in pure THF solution. Upon increasing the water fraction (fw), the intensity of ICT emission became negligible at fw values larger than 90%. When fw was 90%, a bright orange emission band emerged at 608 nm with a ΦEM value of 21%. Successive addition of water (95%) swiftly enhanced the emission intensity with a blue shift (40 nm) from 608 nm to 568 nm owing to the molecular aggregation, producing a strong yellow emission with a higher photoluminescence quantum yield (ΦEM) of 92% (Table S1, ESI†). The emission intensity was remarkably enhanced by ∼359-fold compared with that in pure THF solution, suggesting that the aggregation driven growth is one of the main reasons for the emission enhancement.17 The nature of different light-emitting species was investigated by means of time-resolved single-photon counting (TCSPC) measurements. Fluorescence lifetimes, τ, in air for o-1 (v![[thin space (1/6-em)]](https://www.rsc.org/images/entities/char_2009.gif) :v = THF/H2O, 10:90; 5:95) fit to bi-exponential decay. A short-lived species with a lifetime (τ) of 0.69 ns (44.25%) and a relatively long-lived species with a lifetime of 3.23 ns (55.75%) for emission monitored at 608 nm were observed for o-1 in a THF/H2O mixture (90%), whereas in a THF/H2O mixture (95%) species with lifetimes of 4.79 ns (29.21%) and 11.86 ns (70.91%) for emission monitored at 568 nm were detected (Fig. S8a, ESI†). This increased lifetime values virtually verified the sample aggregation.
:v = THF/H2O, 10:90; 5:95) fit to bi-exponential decay. A short-lived species with a lifetime (τ) of 0.69 ns (44.25%) and a relatively long-lived species with a lifetime of 3.23 ns (55.75%) for emission monitored at 608 nm were observed for o-1 in a THF/H2O mixture (90%), whereas in a THF/H2O mixture (95%) species with lifetimes of 4.79 ns (29.21%) and 11.86 ns (70.91%) for emission monitored at 568 nm were detected (Fig. S8a, ESI†). This increased lifetime values virtually verified the sample aggregation.
The aggregation behaviors of o-2 were also investigated in THF/H2O mixtures (Fig. 2). When fw was up to 60%, the emission intensity was swiftly boosted owing to the molecular aggregation, and a strong emission band appeared at 531 nm with ΦEM up to 89%, indicative of the AIE-active behavior. We also found out that the emission intensity of o-2 increased significantly with the aging time and levelled off after approximately 16 h, revealing that the self-assembly behaviors were time-dependent dynamic processes (Fig. S7, ESI†). Meanwhile, the mixture became an apparent suspension, and emitted green emission as well as that of crystallized emission, implying that the molecular packing mode was similar to the single crystals. The emission intensity was increased by up to about 218-fold in comparison with the initial period (Fig. S6, ESI†). When fw was from 90% to 95%, the emission bands of o-2 exhibited a 67 nm bathochromic shift from green light (λmax 531 nm) to an orange-red one (λmax 598 nm) and a 28 nm bathochromic shift to yellow one (λmax 559 nm) with respect to the green light.
 | ||
| Fig. 2 (a) Emission spectra of o-2 in THF, upon increasing the water concentration from 0% to 95% (λex = 330 nm); (b) photograph of o-2 in THF/H2O solution with various fractions of water (fw) taken under UV illustration (356 nm). Solution concentration: 10 μM. | ||
Transmission electron microscopy (TEM) measurements were performed to explore the morphologies of o-1 and o-2 assembled in THF/H2O solvents. As shown in Fig. S11 (ESI†), nano-spherical structures with a high aspect ratio were observed for o-1, when fw was found to be 95%, in which the diameter ranges from 14 nm to 24 nm, whereas for o-2 assemblies in a THF/H2O mixture (v/v, 5:95), ordered spherical particles were observed with an average diameter of approximately 190 nm, demonstrating that the solvent polarity played a crucial role in determining the morphologies of molecular assemblies (Fig. 3).
 | ||
| Fig. 3 (a) TEM image and (b) corresponding high-magnification image of o-2 in THF/H2O (v:v = 5:95) solution. Solution concentration: 10 μM. | ||
Mechanochromic emission
Mechanochromic emission from crystalline o-1 and o-2 is subjected to emission spectroscopy, single crystal, and X-ray diffraction analysis. o-1 and o-2 show CIE-active properties in the crystalline states. As evident from Fig. 4, crystalline o-1 exhibited a strong green emission with λmax of 522 nm and a high ΦEM of 95%, owing to the intrinsic TICT transition from the TPE donor to the C1–C2 bond of the o-carborane acceptor. By grinding the crystals, the emission color was red-shifted by 25 nm with a slight decrease of ΦEM from 95% to 88% (Table S1, ESI†). Fluorescence decay lifetimes, τ, in air for o-1 (pristine crystalline: 4.85 ns; ground powders: 5.72 ns) fitted to a single-exponential decay, further verifying from the TICT state (Fig. S9a, ESI†). Crystalline and amorphous solids for o-2 had emission maxima at 534 nm and 528 nm with ΦEM ranging from 90% to 85%, respectively (Fig. S12a, ESI†). Fluorescence lifetimes of crystalline and ground powders of o-2 were 5.56 ns and 5.73 ns, respectively, which were fitted to a single-exponential decay, suggesting the existence of ICT excited states (Fig. S9b, ESI†). Generally speaking, introducing weak interactions into AIE-active molecules may result in conformational changes owing to the varied balance of the weak interactions between luminogens in the solid state.18 From crystal patterns (Fig. 6), the twisted 3D conformation of o-1 demonstrated a loose packing fashion in the solid state, facilitating the rotation of the o-carborane cluster to result in transformation between different conformation states. That is, crystallization of o-1 may take a more twisted conformation than that of the amorphous solid, which was responsible for the CIE-activity upon crystallization.19 The symmetrical structure of o-2 makes it hard to alter the 3D conformation in the solid state, and helps to explain the efficient ΦEM for the pristine crystalline versus the amorphous solid (Fig. 7). Fig. 5 and Fig. S12a (ESI†) showed that the films of o-1 and o-2, fabricated by spin-coating 1.0 mg mL−1 solution on quartz substrates, emitted strong yellow emission peaking at 556 nm and 551 nm, respectively, indicating that the broad peak resulted from the AIE induced by suppression of C1–C2 bond vibrations in o-carborane. The emission lifetime decays were detected in thin film states (o-1: 48.05% 0.38 ns, 51.95% 9.63 ns; o-2: 100% 4.27 ns). As shown in Fig. S23 (ESI†), it was clearly demonstrated that the crystal phase of o-1 and o-2 was formed during the spin-coating processes. | ||
| Fig. 4 Normalized emission spectra of the pristine crystalline, ground, heated, and vapour fumed powders of o-1 (top); (a) crystalline under daylight, (b) fluorescent images of the pristine crystalline, (c) ground, and (d) heated/vapor fumed powders for o-1 under 365 nm light irradiation (bottom). | ||
 | ||
| Fig. 5 XRD patterns of pristine crystalline, ground, heated and vapor fumed solids of o-1. | ||
 | ||
| Fig. 6 (A) ORTEP drawing, (B) intermolecular interactions, and (C) molecular packings of o-1. | ||
 | ||
| Fig. 7 (A) ORTEP drawing, (B) intermolecular interactions, and (C) molecular packings of cis-o-2. | ||
Interestingly, when heating the ground powders of o-1 to 130 °C under an air atmosphere in a matter of seconds, the emission color was dramatically changed from yellow to green with an emission peak at 525 nm. Sequentially, a green color was observed with continuous grinding of the yellow sample in situ, which was the same as that of the as-prepared ground powders, indicative of the reversible mechanochromism (Fig. 4). When fumed a few seconds with CH2Cl2 vapor, the yellow emission of o-1 was blue-shifted by 21 nm and peaked at 519 nm. Notably, the yellow ground powders were not fully restored to original crystalline green at 533 nm by the solvent treatment, whereas o-2 demonstrated no distinct response to mechanical stimuli owing to the intrinsic symmetrical conformation (Fig. S12b, ESI†).
Powder X-ray diffraction is a powerful tool to validate the mechanochromic mechanism. As depicted in Fig. 5 and Fig. S12b (ESI†), the initial crystalline o-1 and o-2 exhibited intense and sharp diffraction peaks, implying well-ordered microcrystalline structures. After grinding, the ground powders exhibited a few weak peaks or no diffraction peaks, suggestive of their amorphous-like nature. Upon thermal treatment, sharp diffraction peaks of o-1 appeared again due to the recrystallization of the molecules. When ground powders were fumed with CH2Cl2 vapor, parts of sharp peaks emerged. Dual emissions were reversibly aided by the heating or fuming with solvent vapor, further revealing the distinct existence of two TICT states from the crystal and amorphous phases. Fig. S12b (ESI†) showed that o-2 was not sensitive to the external stimuli probably because of its symmetrical structure that may lead to no switching TICT states.
To explore the mechanochromism in depth, single crystals of o-1 and o-2 were obtained by slow evaporation of the mixture of methanol and CH2Cl2. The single crystal structures of o-1 and cis-o-2 were obtained, and selected crystallographic data are given in Tables S2–S4 (ESI†). As shown in Fig. 6, the short intermolecular C–H⋯π (2.84 Å) contact for o-1 is present in the crystal, which is responsible for the CIE-active properties. There is no distinct π–π stacking between the TPE moieties providing sufficient space for a molecule conformational change. From the X-ray crystal structure analysis, it is clearly manifested that the strong green emission was from the TICT state. Such a conformation can be altered in response to external stimuli, thus generating a metastable state that further induces TICT emission. The reversible dual emissions strongly supported that the rotation of o-carborane can proceed in the crystalline packing, resulting in TICT emission. In other words, the TICT process is switchable in response to the external stimuli in the crystalline state.20 We also found that the pristine crystalline o-1 is CD-active in the KBr-dispersed state. As depicted in Fig. S15 (ESI†), o-1 in a microcystal state displayed a bisignate Cotton effect with a positive wave at around 256 nm accompanied by a pronounced wavelength at around 276 nm, and a positive wave at around 321 nm, indicating that one enantiomer was isolated from racemates in organic solution. According to the literature reports,21 a larger dipole moment and non-centrosymmetric molecular arrangements are favourable for obtaining piezoelectric properties, which are closely pertinent to the mechanic activities of the crystal. It was observed from the theoretical calculations (Fig. 8) that the dipole moment of o-1 (7.05 D) was larger than that of cis-o-2/trans-o-2 (4.54/3.82 D). The larger dipole moment value of o-1 is believed to be responsible for the MCL properties. From the crystal structure analysis (Fig. 7), o-2 showed no response to mechanical force due to the intrinsic symmetrical structure. From molecular packing models of o-1 and o-2, the dipole moment values exhibited a dramatic decrease with increasing repeat units (Fig. 9). This result revealed that the strong emission may be from the intramolecular TICT/ICT excited states.
 | ||
| Fig. 8 DFT calculation results for o-1 at the B3LYP/6-31G(d) levels. | ||
 | ||
| Fig. 9 Molecular packing and intermolecular interactions depend on dipole moment values of o-1 and o-2. | ||
To gain insights into the relationship between the TICI/ICT emission and the molecular conformation, the highest occupied molecular orbital (HOMO) and the lowest occupied molecular orbital (LUMO) distributions of o-1 and o-2 with the dihedral angles (ψ) between the phenyl group and the C1–C2 bond in the o-carborane moiety were investigated using the DFT method. The TICT/ICT excited state has a close relationship between the electronic states and the conformation of p-conjugated units to the C1–C2 bond of an o-carborane cluster; that is, when p-conjugated planes are twisted to the C1–C2 bond of an o-carborane, intramolecular charge transfer occurs more efficiently than in the parallel conformer. As depicted in Fig. 10, the electron density of HOMO states of o-1 are mainly localized on electron-donating TPE moieties when ψ was altered between the phenyl group and the C1–C2 bond in o-carborane, and LUMO levels of o-1 are principally delocalized on the TPE moiety, phenyl group and partial o-carborane moiety except that when ψ was 180°. This result strongly supports that the emission of o-1 should be derived from the TICT states. Moreover, the difference in the energy levels of each state with respect to the optimized structures was calculated. When ψ is 60°, 90° and 180°, the rotation barriers are 0.69 kcal mol−1, 0.06 kcal mol−1 and 4.98 kcal mol−1, respectively, confirming that the rotation of the o-carborane moiety is allowed in the photo-excited state. These values showed good agreement with the experimental results. o-1 is able to exhibit TICT emission when the rotation of the o-carborane group can proceed after photo-excitation. As shown in Fig. 11, the HOMO is delocalized to the TPE moiety, and the LUMO resides on the TPE moiety, and gradually extends to the C1–C2 bond of the o-carborane moiety when ψ is altered in any way. Moreover, when ψ is 60°, 90° and 180°, we find that the rotation barriers are 0.80 kcal mol−1, 0.15 kcal mol−1 and 4.88 kcal mol−1, respectively. As the C1–C2 bond of the o-carborane unit is involved in the excited state, the ICT state is formed.14 Because the electronic density distribution for o-2 did not change when altering ψ between the phenyl plane and the C1–C2 bond in o-carborane, it is assumed that the ICT state is readily accessible. As seen from Fig. S16 (ESI†), the HOMO energy levels of o-1 and o-2 are −5.72 and −5.78 eV, and the corresponding LUMO energy levels are −3.39 eV and −3.52 eV, respectively. Calculated band gaps (Eg) of o-1 and o-2 are 2.25 eV and 2.19 eV, respectively.
 | ||
| Fig. 10 Calculated HOMO and LUMO distributions of o-1 with the dihedral angles (ψ) between the C1–C2 bond of o-carborane and the phenyl plane of 60°, 90°, 180° and 86°. The difference of total energy and energy levels of each orbital were calculated at the B3LYP/6-31G(d) levels using DFT calculations. | ||
 | ||
| Fig. 11 Calculated HOMO and LUMO distributions of o-2 with the dihedral angles (ψ) between the C1–C2 bond of o-carborane and the phenyl group of 60°, 90°, 180° and 99°. The differences in total energy and energy levels of each orbital were calculated at the B3LYP/6-31G(d) levels using DFT calculations. | ||
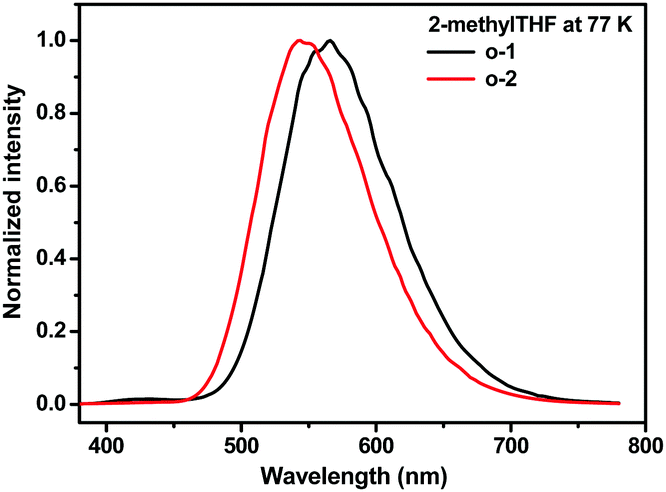
To further interpret the relationship between the conformation and TICT/ICT emission, low temperature emission spectra of o-1 and o-2 in 2-MeTHF were recorded. Generally, the rotation of o-carborane is suppressed in frozen media resulting in LE emission.14 As shown in Fig. 12, in the frozen matrix of 2-MeTHF for o-1, an intense emission at 565 nm with a TICT feature was detected and a weak emission was observed at around 430 nm originating from LE states. This result strongly confirms that the rotation of o-carborane is prohibited even in the frozen state, leading to a TICT emission band peaked at around 565 nm. In contrast, no LE emission was detected for o-2. Owing to the inherent symmetrical structure of o-2, an ICT emission band peaking at around 543 nm was observed. Above all, the experimental data and DFT calculations deeply support that the strong emissions of o-1 and o-2 originate from TICT and ICT states, respectively.20 The emission decay curves of o-1 and o-2 at a cryogenic temperature of 77 K consisted of two excited states: for o-1: τ1 = 98.17 ns (48.68%), τ2 = 1.26 μs (51.32%); for o-2: τ1 = 140.15 ns (49.72%), τ2 = 1.49 μs (50.28%), respectively (Fig. S10, ESI†). According to a literature report, o-carborane exhibited a relatively strong blue-green photoluminescence with λmax ∼ 440 nm, which was assigned to the triplet state.22 The fast excited state decays can be ascribed to TICT/ICT emission, and the long-lived excited state decays can be attributed to phosphorescence.
 | ||
| Fig. 12 Emission spectra of o-1 and o-2 in 2-MeTHF solution at 77 K. | ||
Electrogenerated chemiluminescence
Electrogenerated chemiluminescence (ECL) is generated by radical ion annihilation if both cations and anions undergo energetic electron-transfer reactions.23o-1 (2.00 mg) and o-2 (2.00 mg) were dissolved in DCM (2.0 mL), containing 10.90 mg tetraoctylammonium bromide (TOAB) solution. Then, 10.0 μL of the mixture was spread on the surface of a glass electrode and dried at ambient temperature. After purging with N2 gas, 0.1 M tetramethylammonium perchlorate (TMAP) was used as an electrolyte with a glassy carbon working electrode, a Pt wire counter electrode, and an Ag/AgCl reference electrode, and ECL signals were detected in 4.0 mL DCM buffer solution. When the electrode potential was cycled between +2.0 V and −2.0 V at a scan rate of 0.1 V s−1, ECL was observed (Fig. S22a, ESI†). During the positive scan, the very small ECL signals for o-1 and o-2 occurred at +1.3 V forming the corresponding plateau at +1.91 V and +1.93 V, respectively (Fig. S21, ESI†). As shown in Fig. S19 and S20 (ESI†), the spin density isosurfaces of singly occupied molecular orbitals (SOMOs) of cations and anions for o-1 and o-2 reside on the TPE moiety and o-carborane and phenyl group, respectively. Such overall electron spin density delocalization in the SOMO surfaces can improve the cation (anion) radical stability at the molecular level, because electron-deficient (rich) cations (anion) generated after oxidation (reduction) need immediate electron density delocalization to obtain thermodynamic stability at the molecular level, which can be achieved from an overall well-conjugated system. The radical stability was also supported by the calculated electrostatic potential (ESP) density distribution. Fig. 13 shows the electrostatic potential density surfaces of the neutral molecule (center), anion (right), cation (left) of o-1 and cis-o-2. We observed that positive charge (blue) of radical cations as well as negative charge (red) of anion radicals are mainly centered on the TPE moiety and o-carborane group, suggesting that the TPE moiety and the o-carborane group were responsible for the cation and anion radical stability of o-1 and o-2. The calculated non-adiabatic reduction (cation → neutral) potential (NRP) for the cation radicals of o-1 and cis-o-2 is 6.61 and 6.79, respectively, indicating that the cations with bi-substituted o-carborane groups are more stable than the cations with mono-substituted o-carborane groups, which is in accordance with the analysis based on photophysical and electrochemical measurements.24o-2 shows better radical ion stability with respect to o-1. This is why the ECL intensity of o-2 is larger than that of o-1 under the same terms (Fig. S22b, ESI†).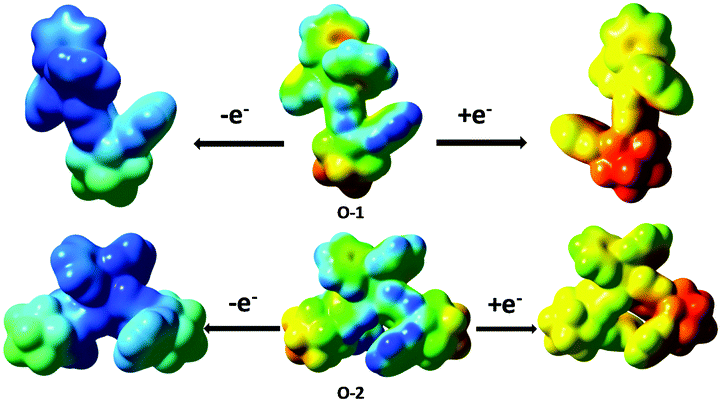 | ||
| Fig. 13 Top: Calculated electrostatic potential (ESP) density of o-1 after removing one electron from o-1 (left) and adding one electron to o-1 (right). Bottom: Calculated electrostatic potential (ESP) density of o-2 after removing one electron from o-1 (left) and adding one electron to o-2 (right). The more blue and more red, respectively, indicate more positive and more negative electrostatic potentials. Isovalue of the isosurfaces is 0.001 a.u. | ||
Conclusions
In conclusion, a set of unique o-carborane–tetraphenylethene (TPE) dyads was designed, synthesized, and characterized. The results demonstrated that the dyad of crystalline o-1 with a mono-substituted o-carborane unit exhibited TICT emissions both in solutions and in crystalline states. A wide variety of emission behaviors was observed for the dissymmetrical o-carborane-based dyad o-1 in crystalline states, including AIE, CIE, ACQ, thermochromism, vapochromism and mechanochromism, while crystalline o-2 showed only the AIE and CIE properties orginating from the inherent ICT states. From the experimental data and theoretical calculations, it is suggested that the reversible dual emissions from o-1 in response to external stimuli are assigned to the TICT emissions. The results manifest that the unique 3D o-carborane cluster's structure plays an important role in precisely controlling the molecular packing patterns and conformations to achieve TICT emission, which opens up a unique strategy to explore novel solid-state stimuli-responsive emissive materials via switching the TICT states.Experimental section
Instruments and materials
NMR spectra were recorded on a Bruker Ultra Shield Plus 400 MHz instrument with CDCl3 as the solvent and tetramethylsilane (TMS) as the internal standard. Fourier transform infrared (FT-IR) spectra were recorded on a Nexus 870 FT-IR spectrometer. UV-vis spectra were obtained using a Perkin-Elmer Lambda 25 spectrometer. Fluorescent spectra were obtained using a 48000 DSCF spectrometer. Differential scanning calorimetry (DSC) and Thermo-gravimetric analysis (TGA) were performed on Shimadzu DSC-60A and DTG-60A equipment, respectively. Circular dichroism (CD) spectra were recorded on a Jasco J-810 spectropolarimeter. Time-resolved fluorescence decay curves were obtained using a HORIBA JOBIN YVON Tem Pro-01 lifetime fluorescence spectroscope. Absolute fluorescence quantum yield was obtained on a Edinburgh Instruments’ FLS980 fluorescence spectrophotometer attached with an integrating sphere. The matrix-assisted laser desorption time of flight mass spectrometry (MALDI-TOF-MS) was carried out on a Bruker Daltonics Ultraflex MALDI TOF Mass Spectrometer. The transmission electron microscopy (TEM) images were recorded using a HT7700 transmission electron microscope at an accelerating voltage of 110 kV. X-ray powder diffraction data of the solids were collected using a PNAalytical X’Pert PRO (HTK) diffractometer with Cu Kα radiation, acquired from 2Θ angles of 5° to 50°. Electrochemical behaviors were studied using cyclic voltammetry (CV) with a standard three-electrode electrochemical cell in a 0.1 M tetra-n-butylammonium hexafluorophosphate (Bu4NPF6) in anhydrous acetonitrile at room temperature under a nitrogen atmosphere with a scanning rate of 50 mV s−1. A platinum working electrode, a glassy carbon electrode, and an Ag/AgNO3 (0.1 M) reference electrode were used for cyclic voltammetry analysis. Single crystals were mounted on a Bruker SMART APEX CCD diffractometer using graphite-monochromated Mo Kα radiation (λ = 0.71073 Å) at 100 K and 293 K for complexes o-1 and o-2, respectively. The intensity data sets were reduced by the CrystalClear software. The structures were solved using direct methods with the Siemens SHELXTL version 5 package of crystallographic software and refined by full-matrix least-squares techniques.(2-(4-Bromophenyl)ethene-1,1,2-triyl)tribenzene and 1,2-bis(4-bromophenyl)-1,2-diphenylethene were synthesized referring to the literature procedures.25 Tetraoctylammonium bromide (TOAB, 98%), dichloromethane (DCM), tetra-n-butylammonium perchlorate (TMAP) and N,N-dipropyl-1-propanamine were from Sigma-Aldrich Chemical Co. Ltd (Shanghai, China). Toluene was purified by distillation from sodium in the presence of benzophenone. Other chemicals were of analytical grade and used without further purification.
Thin films of o-1 and o-2 were fabricated by spin-casting THF solution (1.0 mg mL−1, 20.0 μL) onto quartz plates (size: 1.0 cm × 3.0 cm, thickness: 1.0 mm) using a KW-4A Spin Processor at a spin rate of 1500 rpm for 30 s.26 The spin-casting solution was filtered through a 0.45 μm PTFE syringe filter to remove particulates and aggregates.
Synthesis and characterization
Conflicts of interest
There are no conflicts to declare.Acknowledgements
We acknowledge financial support from the National Basic Research Program of China (2014CB648300, 2017YFB0404500, 2013CB932902), the National Natural Science Foundation of China (No. 21404059, 21422402, 21674050), the Natural Science Foundation of Jiangsu Province (BK20140867, BK20140060, BK20130037), the NUPT “1311 Project” and Scientific Foundation (NY213119, NY213169), the Synergetic Innovation Center for Organic Electronics and Information Displays, the Priority Academic Program Development of Jiangsu Higher Education Institutions (PAPD), National Key Research and Development Program 2016YFA0501602.Notes and references
- S. Kim, Q. Zheng, G. S. He, D. J. Bharali, H. E. Pudavar, A. Baev and P. N. Prasad, Adv. Funct. Mater., 2006, 16, 2317 CrossRef CAS
.
-
(a) Y. Wang, T. Liu, L. Bu, J. Li, C. Yang, X. Li, Y. Tao and W. Yang, J. Phys. Chem. C, 2012, 116, 15576 CrossRef CAS
- C.-F. Feng, J.-Y. Li, X. Han, X. He, L.-Q. Liu, X.-X. Li, X. Y. Sun, P. Lu and Y.-G. Ma, Faraday Discuss., 2017, 196, 163 RSC
-
(a) J. Wu, W. Liu, J. Ge, H. Zhang and P. Wang, Chem. Soc. Rev., 2011, 40, 3483 RSC
- J. Mei, N. L. C. Leung, R. T. K. Kwok, J. W. Y. Lam and B. Z. Tang, Chem. Rev., 2015, 115, 11718 CrossRef CAS PubMed
- J. Mei, Y. Hong, J. W. Y. Lam, A.-J. Qin, Y.-H. Tang and B. Z. Tang, Adv. Mater., 2014, 26, 5429 CrossRef CAS PubMed
-
(a) Y.-C. Wang, G.-X. Zhang, M. Gao, Y.-J. Cai, C. Zhan, Z.-J. Zhao, D.-Q. Zhang and B. Z. Tang, Faraday Discuss., 2017, 196, 9 RSC
-
(a) K.-R. Wee, Y.-J. Cho, J. K. Song and S. O. Kang, Angew. Chem., Int. Ed., 2013, 52, 9682 CrossRef CAS PubMed
-
(a) Z. Y. Ma, Z. J. Wang, X. Meng, Z. M. Ma, Z. J. Xu, Y. G. Ma and X. R. Jia, Angew. Chem., Int. Ed., 2015, 55, 519 CrossRef PubMed
-
(a) M. F. Hawthorne, Angew. Chem., Int. Ed., 1993, 320, 950 CrossRef
-
(a) A. González-Campo, E. J. Juárez-Pérez, C. Viñas, B. Boury, R. Sillanpää, R. Kivekäs and R. Núñez, Macromolecules, 2008, 41, 8458 CrossRef
-
(a) X. L. Zhang, H. M. Dai, H. Yan, W. Zou and D. Cremer, J. Am. Chem. Soc., 2016, 138, 4334 CrossRef CAS PubMed
-
(a) K. Kokado and Y. Chujo, J. Org. Chem., 2011, 76, 316 CrossRef CAS PubMed
- D. Tu, P. Leong, Z. H. Li, R. R. Hu, C. Shi, K. Y. Zhang, H. Yan and Q. Zhao, Chem. Commun., 2016, 52, 12494 RSC
-
(a) C. Shi, H. B. Sun, X. Tang, W. Lv, H. Yan, Q. Zhao, J. X. Wang and W. Huang, Angew. Chem., Int. Ed., 2013, 52, 13434 CrossRef CAS PubMed
-
(a) Y.-J. Cho, S.-Y. Kim, M. Cho, W.-S. Han, H.-J. Son, D. W. Cho and S. O. Kang, Phys. Chem. Chem. Phys., 2016, 18, 9702 RSC
-
(a) P. Galer, R. C. Korošec, M. Vidmar and B. Šket, J. Am. Chem. Soc., 2014, 136, 7383 CrossRef CAS PubMed
- C. Li, X. Luo, W. Zhao, C. Li, Z. Liu, Z. Bo, Y. Q. Dong and B. Z. Tang, New J. Chem., 2013, 37, 1696 RSC
- Z. J. Wang, T. Y. Wang, C. Zhang and M. G. Humphrey, Phys. Chem. Chem. Phys., 2017, 19, 12928 RSC
-
(a) H. Naito, K. Nishino, Y. Morisaki, K. Tanaka and Y. Chujo, Angew. Chem., Int. Ed., 2016, 56, 254 CrossRef PubMed
-
(a) B. Xu, J. He, Y. Mu, Q. Zhu, S. Wu, Y. Wang, Y. Zhang, C. Jin, C. Lo, Z. Chi, A. Lien, S. Liu and J. Xu, Chem. Sci., 2015, 6, 3236 RSC
- H. Kunkely and A. Vogler, Inorg. Chim. Acta, 2004, 357, 4607 CrossRef CAS
-
(a) H. Li, A. C. Sedgwick, M. Li, R. A. R. Blackburn, S. D. Bull, S. Arbault, T. D. James and N. Sojic, Chem. Commun., 2016, 52, 12845 RSC
-
(a) J.-W. Oh, Y. O. Lee, T. H. Kim, K. C. Ko, J. Y. Lee, H. Kim and J. S. Kim, Angew. Chem., Int. Ed., 2009, 48, 2522 CrossRef CAS PubMed
- X.-H. Liu, J.-M. Jiao, X.-X. Jiang, J.-F. Li, Y.-X. Cheng and C.-J. Zhu, J. Mater. Chem. C, 2013, 1, 4713 RSC
-
(a) J.-F. Li, Y. Chen, C.-L. Yang and W.-Y. Lai, Synlett, 2015, 2451 CrossRef CAS
Footnote |
| † Electronic supplementary information (ESI) available: TGA, DSC, CD, FL, ECL, NMR, MS, X-ray crystallographic data, additional computational data. CCDC 1569225 and 1569226. For ESI and crystallographic data in CIF or other electronic format see DOI: 10.1039/c7tc03780e |
| This journal is © The Royal Society of Chemistry 2018 |