 Open Access Article
Creative Commons Attribution 3.0 Unported Licence
Hierarchically designed hybrid nanoparticles for combinational photochemotherapy against a pancreatic cancer cell line†
F.
Joubert
and
G.
Pasparakis
 *
*
UCL School of Pharmacy, 29-39 Brunswick square, WC1N 1AX London, UK. E-mail: g.pasparakis@ucl.ac.uk
First published on 6th February 2018
Abstract
Here, we report the formulation of hybrid nanoparticles consisting of aggregated gold nanoparticles (GNPs) impregnated into a gemcitabine–polymer conjugate matrix that exhibit synergistic photo-chemo-therapeutic activity against pancreatic cancer. Well-defined, sub-100 nm hybrid NPs were successfully formulated and their photothermal conversion efficiency was evaluated, which was found to be as high as 63% in the red-visible spectrum. By varying the GNP and GEM–polymer feed, it was possible to control the red-shifting of the surface plasmon resonance at therapeutically relevant wavelengths. The hybrid NPs exhibited significant cytotoxicity against MiaPaCa-2 cells with a half-maximal inhibitory concentration (IC50) of 0.0012 mg mL−1; however the IC50 decreased by a factor of 2 after the cells were irradiated with a continuous wave red laser for 1 min (1.4 W cm−2). Although the irradiation of the aggregated GNPs loaded in the hybrid NPs produced a higher thermal effect for the same amount of non-loaded GNPs, the IC50 of the hybrid NPs was significantly lower than that of the free GNPs, hence indicating a synergistic effect of the polymer bound GEM and the GNPs.
Introduction
Pancreatic cancer is the fifth most lethal cancer with an overall survival rate of 1% after 10 years.1 In 80% of pancreatic cancer cases,2 the tumours cannot be resected by surgical intervention, hence patients require a chemotherapeutic treatment. Gemcitabine (GEM), a nucleoside analogue of deoxycytidine, is currently used as the front-line drug in pancreatic cancers and has been shown to increase the overall survival rate to 21% after 5 years.3 However, GEM is metabolically unstable due to its rapid deamination in the blood stream by cytidine deaminase (CDA) and also has poor cell permeability.4,5 To compensate for these limitations, a high dose of GEM is administered resulting in severe side effects to patients such as breathlessness, neutropenia, nausea, and kidney failure.6 In recent years, GEM prodrugs have been developed with improved pharmacokinetics, cellular uptake and tumor targeting properties.6,7 Of particular interest are GEM–polymer conjugates that have interesting formulation properties such as their ability to self-assemble into sub-100 nm nanoparticles (i.e. micelles), which is critical for deep tumor permeation of the pancreas,8 controllable release of GEM, and active tumor targeting via the installation of tumor targeting ligands.9–15Recently, photothermal therapy (PTT) has shown great potential in cancer treatment.16 PTT comprises the thermal ablation of cancer cells using a red/near-infrared (NIR) laser photoabsorber such as noble metal nanostructures,17,18 transition metal sulphides/oxides nanomaterials19,20 and other nanoagents.21,22 Hyperthermia comprises a localized increase of the temperature between 41 and 48 °C at the tumour site, which in turn induces cancer cell death via multiple apoptotic or necrotic pathways including lethal protein denaturation followed by their aggregation.23,24 More recently, PTT was combined with other therapies including radiotherapy, chemotherapy and immunotherapy.25 Photochemotherapy is particularly appealing as it harnesses the benefits of PTT and chemotherapy, which, in principle, leads to potent formulations with synergistic activity. Gold nanoparticles are excellent photoabsorbers and have been extensively utilized in PTT protocols in the form of nanosized spheres, rods, and shells owing to their excellent optical properties such as very high photothermal conversion efficiencies, and optimization of their surface plasmon resonance to deep tissue penetrating red or near-infrared wavelengths.18,26 For instance, chemotherapeutic drugs such as doxorubicin (DOX),27,28 paclitaxel,29–32 fluorouracil33 and CisPt34 have been combined with gold-based nanostructures for the treatment of various cancers. The preparation of drug-containing GNP formulations is not always straightforward and often functional limitations are encountered that hamper their clinical potential, such as: (1) poor colloidal stability (leading to drug leakage, or premature disassembly in the bloodstream), (2) low drug loading per particle volume/mass, and (3) use of unsuitable chemicals for in vitro/vivo application (for example, the use of cetyltrimethylammonium bromide in the preparation of gold nanorods35). Therefore, the quest for simple36,37 but functionally complex formulations constitutes a major prerequisite for the translational potential of nanomedicinal photochemotherapeutics.
In this work, we report on a simple and hierarchically-defined formulation of GNPs impregnated in a polymer–gemcitabine conjugate via an efficient preparation route. The formulation exhibits certain unique characteristics that render it suitable for pancreatic cancer therapeutics. It has very high drug loading per particle, excellent colloidal stability, and clinically relevant optical properties by simply adjusting the GNP feed in the polymer matrix. We demonstrate that the formulation augments the cytotoxicity of gemcitabine due to the photothermal effect upon irradiation with a red laser and shows superior cytotoxicity to the parent drug. The proposed concept exhibits interesting formulation properties that render it suitable for direct tumor administration via, for example, catheterization, or surgical intervention, followed by laser treatment of the diseased area.
Results and discussion
Synthesis of the GEM–monomer conjugate and its RAFT polymerisation
The synthesis of the GEM–monomer conjugate and its RAFT polymerisation were reported in our previous publication;38 the GEM–monomer conjugate was prepared via a one-step amidation reaction between gemcitabine hydrochloride and mono-2-methacyloyloxy ethyl succinate with an acceptable yield of 45% (Scheme S1a, ESI†). The GEM–monomer conjugate was further polymerised by RAFT using a trithiocarbonate as chain transfer agent (CTA) (Scheme S1b, ESI†). A polymer with a degree of polymerisation (DP) of 100 was chosen because of its ability to self-aggregate into small nanoparticles. In fact, we have already established that short-chain polymeric GEM-prodrug results in the formation of larger NPs due to weaker chain–chain interpolymer interactions.38 The GEM–polymer conjugate was successfully prepared with an average molecular weight (Mn) and dipersity (ĐM) of 36![[thin space (1/6-em)]](https://www.rsc.org/images/entities/char_2009.gif) 400 g mol−1 and 1.24, respectively.
400 g mol−1 and 1.24, respectively.
Preparation of gold nanoparticles (GNPs)
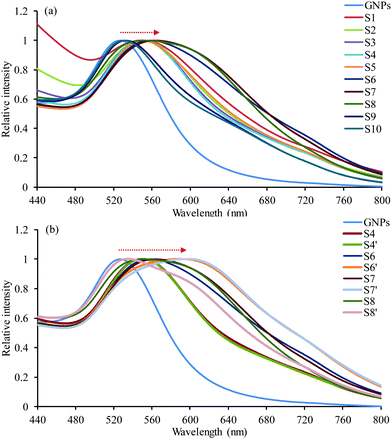
GNPs were prepared using the Turkevich method;39i.e. using citrate sodium as the reducing and stabilizing agent. The colour of the solution changed from slightly yellow to ruby indicating the successful preparation of spherical GNPs. Their size was determined using DLS and was found to be 25 ± 7 nm. Furthermore, their UV-vis absorption spectrum was recorded using a UV-vis spectrophotometer and their maximum absorption was measured at 527 nm (Fig. 2).Preparation of hybrid nanoparticles
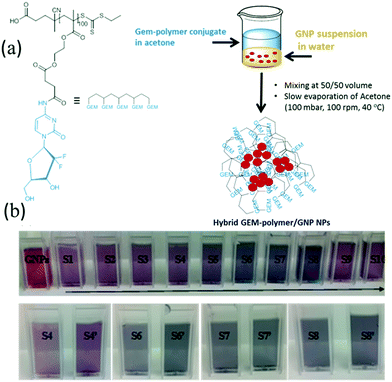
The rationale of the proposed formulation is based on the fact that GEM is a nucleoside analogue that binds covalently on the surface of GNPs.40,41 In addition, we hypothesized that the polymeric structure acts as a multivalent42 amplifier that could further augment the interaction of the GEM polymer with GNPs. GNPs were loaded into GEM–polymer conjugate NPs using an evaporation process protocol. The aqueous GNP suspension was used as a co-solvent with acetone to dissolve the GEM–polymer conjugate (1 mg mL−1, S1). In order to optimise the loading capacity, different concentrations of GNPs and GEM–polymer conjugate were used, hence a series of 2-fold dilutions of the GEM–polymer conjugate (S2 to S10) were prepared using a GNP suspension/acetone mixture (50/50, v/v) where a constant concentration of GNPs (0.2 mg mL−1) was kept throughout the dilution process of the polymeric prodrug. Another set of samples S4′, S6′, S7′ and S8′ was prepared where the GNP concentration was doubled (0.4 mg mL−1) and the concentration of the GEM–polymer conjugate was 125, 31.25, 15.62 and 7.81 μg mL−1, respectively. After the acetone was evaporated under controlled conditions, hybrid nanoparticles were formed in aqueous solution and can be seen in Fig. 1b. For the hybrid NPs of sample S7′, the amount of GEM per particle was estimated to be 0.588 × 10⁻¹⁸ μg (see the ESI†).Physical characterisation of the hybrid NPs
Colloidal stability of hybrid NPs
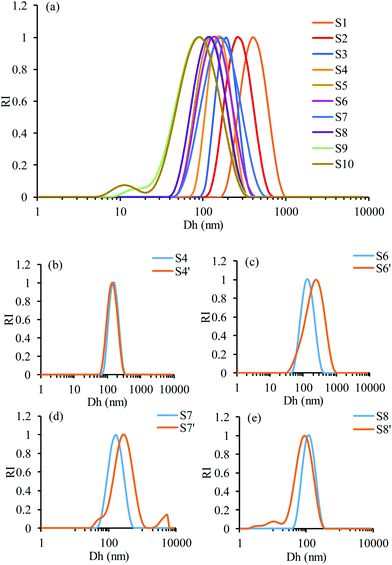
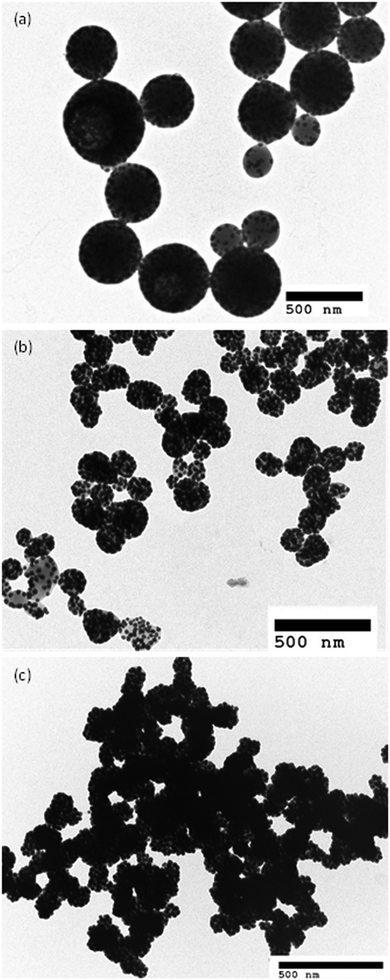
The colloidal stability of the hybrid NPs was assessed using DLS. For each sample, the Dh and PDI were measured after being left at room temperature without stirring for 16 days (Fig. S1, ESI†). For samples S1 to S10, S4′, S6′ and S8′, relatively similar PDI and Dh values were measured, indicating a good stability of the hybrid NPs over the tested time frame. However, the PDI and Dh values of sample S7′ were lower after 16 days. A Dh value of 144 nm was measured and was similar to the Dh value determined by TEM. Furthermore, a decrease of the PDI to 0.236 demonstrated a narrower size distribution of sample S7′ after 16 days compared to the freshly prepared batch. This may due to the elimination of the interparticle coagulation leading to a narrower dispersed NP population. Furthermore, it should be noted that the stability of the GEM–polymer conjugate NPs was demonstrated in our previous work.38 The release of GEM was quantified in neutral and acidic conditions using HPLC. GEM was not released in neutral conditions for 30 days but was released up to 80% under acidic conditions via a 2-step hydrolysis mechanism. Hence, the hybrid NPs are most likely to follow the same pattern regarding GEM release. Therefore, it is reasonable to assume that the colloidal stability is dominated by possible changes in interpolymer chain–chain interactions rather than hydrolysis of the NPs over the tested timeframe.Evaluation of the photothermal effect
Having established all the formulation parameters to optimise the size of the NPs, their GNP content as well as their colloidal stability, we shortlisted sample S7′ as the potentially most potent for photothermal therapy owing to its large red-shifting of the SPR. To evaluate the photothermal effect, suspensions of sample S7′, GNPs, and water as a control were irradiated using a continuous wave 640 nm laser for 10 min and the temperature was recorded every minute (Fig. 5a). The concentration of S7′ and the GNPs was pre-adjusted using UV-vis spectrophotometry in order to have a similar amount of NPs; the absorbance at 640 nm for the GNPs and hybrid NPs was 0.1 and 0.72, respectively.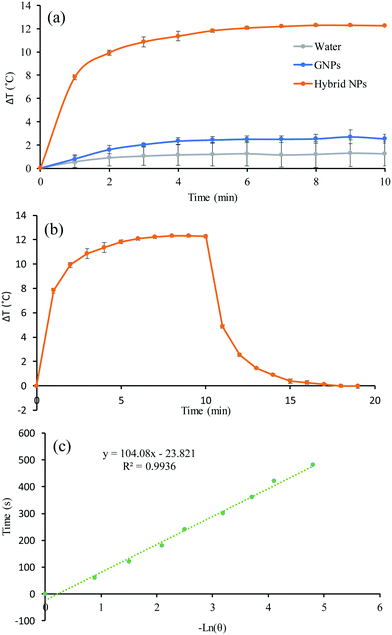 | ||
| Fig. 5 (a) Temperature evolution as a function of the irradiation time, (b) photothermal effect of the irradiation of the aqueous dispersion of GNPs and hybrid NPs of sample S7′ for 10 min with a red laser (640 nm, 0.8 W cm−2) and then the laser was turned off and (c) linear time data from the cooling period versus negative natural logarithm of driving force temperature, which was obtained from the cooling phase of Fig. 5b. | ||
The temperature of the hybrid NP solution increased very rapidly in a time-dependant manner during the first few minutes and subsequently reached a plateau. In fact, the temperature of the hybrid NP solution increased by 12.3 °C in 10 minutes while the temperature of the GNP suspension and water only increased by 2.5 °C and 1.2 °C, respectively. Hence, the hybrid NPs converted light into thermal energy very efficiently. To determine the photothermal conversion efficiency, the cooling of the suspension-containing hybrid NPs and GNPs was recorded for 10 minutes after the laser was turned off (Fig. 5c and Fig. S2a, ESI†). From the cooling phase, a linear time data versus negative logarithm of driving force temperature plot was obtained (Fig. 5c and Fig. S2b, ESI†) and was used to calculate the photothermal heat conversion (η) as described by Hu et al.43 (see the ESI†). The conversion efficiency (η) does not represent the ability of the NPs to generate heat but defines the ability of the NPs to dispose of the energy either by scattering or absorption. The η of the hybrid NPs and GNPs was found to be 63% and 54%, respectively, which is considerably higher than red/NIR absorbing gold nanoshells (13%), gold nanorods (22%), and even more efficient than large GNP aggregates (52%).44 This excellent photothermal conversion capacity is attributed to the nano-confinement effect of the formulation that is achieved by the polymer matrix that drives the clustering of the GNPs.
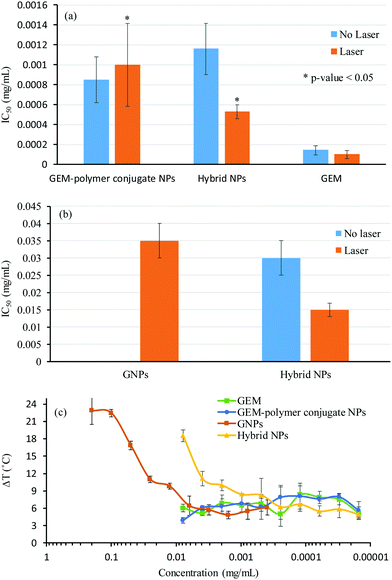
In vitro cytotoxicity against MiaPaCa-2 cells
The cytotoxicity of the hybrid NPs of sample S7′ was tested in vitro against a model pancreatic cell line (MiaPaCa-2) in order to compare their half-maximal inhibitory concentration (IC50) with that of GEM, the GNPs and the GEM-polymer conjugate NPs (Fig. 6a), which was obtained from the evolution of the cell viability as a function of the concentration of GEM (Fig. S5a, ESI†) and GNPs (Fig. S5b, ESI†). It should be noted that the cell viability was not influenced by laser irradiation alone. Furthermore, the influence of the photothermal effect on the IC50 was evaluated by irradiating cells for 1 min (640 nm, 1.4 W cm−2) (Fig. 6b); in addition, the maximum temperature obtained in each well during laser irradiation was recorded for each dilution (Fig. 6c).The IC50 of GEM was found to be 0.0001 mg mL−1 and was not influenced by laser irradiation (Fig. 6a). Again, for the GEM–polymer conjugate NPs, the IC50 values were relatively similar to those without irradiation, i.e. ∼0.001 mg mL−1 (Fig. 6a). As expected, the IC50 values of the GEM–polymer conjugate NPs were higher than the IC50 values of GEM and this is due to the slow release of GEM via hydrolysis of the GEM–polymer conjugate.38 The release of GEM is triggered via a change in pH and the presence of enzymes such as cathepsin B capable to cleave the amide and ester linker. In our previous work,38 the addition of cathepsin B in the acidic buffer significantly increased the overall rate of GEM release from the GEM–polymer conjugate. For the hybrid NPs, an IC50 value of 0.001 mg mL−1 was measured, which interestingly decreased by a factor 2 (i.e. 0.0005 mg mL−1) when cells were irradiated for 1 min, hence we hypothesized that the cytotoxicity of the hybrid NPs was improved due to the hyperthermia effect as the measured temperature in the well after 1 min of irradiation was 45 °C (Fig. 6c). In order to deconvolute the hyperthermia driven cytotoxicity from cell death caused by GEM, we conducted a series of control experiments: we first tested the toxicity of GNPs, which were found not to be cytotoxic, however they became slightly toxic with a high IC50 value of 0.035 mg mL−1 when irradiated using the laser (Fig. 6b). Surprisingly, GNPs generated a ΔT increase of 15 °C, reaching a temperature of 52 °C, which caused the increase of cell death under these experimental conditions. Although the photothermal effect generated by the GNPs was significantly more pronounced than that of the hybrid NPs, the IC50 of the hybrid NPs remained considerably lower than that of the GNPs, implying that the high cytotoxicity of this sample can be attributed to the synergetic cytotoxic effect between GEM and GNPs in the hybrid NPs (Fig. 6b). The combination index (CI) was calculated from the IC50 values of the GEM–polymer conjugate NPs, GNPs and the hybrid NPs using the Chou–Talalay method (see the ESI†).45 The CI value is representative of a synergetic (CI < 1), additive (CI = 1) or antagonistic (CI > 1) effect. The CI of the hybrid NPs was found to be 0.8 which indicates a strong synergetic cytotoxicity effect.
Optical microscopy images of MiaPaCa-2 cells, which were previously incubated with GNPs and hybrid NPs at their IC50 concentrations, were recorded (Fig. 7). GNPs could easily be traced due to their characteristic black hue, and hence a visual assessment of the GNPs per cell could be digitally converted to red pixel signal with the use of imageJ software. In the case of the GNPs (Fig. 7a), the number of GNPs per cell seems limited and the surface area covered by GNPs (red surface) was estimated to be 775.7 pixel units. On the other hand, for the hybrid NPs (Fig. 7b), a significantly higher number of GNPs surrounding each cell was observed indicating a considerably stronger affinity of the hybrid NPs for the cell membranes. In fact, the surface area covered by GNPs was increased by a factor 5 in the case of the hybrid NPs and was found to be 4004.3 pixel units. This finding was very surprising because the concentration of GNPs for the hybrid NPs was lower (i.e. 0.015 mg mL−1) compared to the concentration used in the case of GNPs only (0.035 mg mL−1). These results could possibly be attributed to the high affinity of the polymer towards the cell membrane, which could be of multivalent nature and certainly merits further biophysical investigation in detail to fully elucidate the exact selective uptake mechanism and how it impacts the cytotoxicity effect.
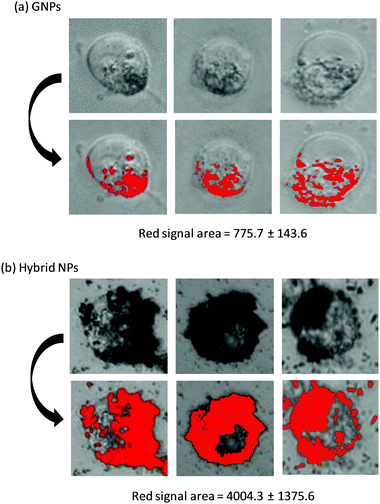 | ||
| Fig. 7 Optical microscopy images of MiaPaCa-2 incubated with GNPs and hybrid NPs after 72 h at 37 °C with 5% CO2. | ||
Next, the mode of cell death was investigated using a staining protocol that distinguishes necrosis from apoptosis. Cells undergoing apoptosis maintain their membrane integrity and inflammatory response is prevented whereas the cell membrane of necrotic cells disintegrates and their damage-associated biomolecular pathway induces an inflammatory response. Under laser exposure, the cell response can vary and most studies46–48 have reported necrosis as the dominant cell death mechanism of PTT, especially for high temperatures (>50 °C).49,50 Here, the ratio of necrotic to apoptotic cells was determined before and after laser irradiation for GEM, GNPs, GEM–polymer conjugate and hybrid NPs at their IC50 concentrations (Fig. 8). Without light exposure, cells underwent mainly apoptosis (i.e. at least 70% of the total dead cells) when in contact with GEM, GNPs, GEM–polymer conjugate NPs and hybrid NPs. In the case of GEM and GNPs, the cell death mechanism was not affected under light exposure. In contrast, the ratio of necrotic to apoptotic cells increased to ca. 50–60% for GEM–polymer conjugate NPs and hybrid NPs under light exposure. To evaluate the photothermal effect, the temperature was recorded after the irradiation (Fig. 8). An increase of the temperature ranging from 3.6 °C up to 10.2 °C was observed but there was no clear evidence of corroboration between the thermal effect and the cell death pathway. However, if we consider GEM or GNP treated cells where it is observed that the apoptosis to necrosis ratio remains at ca. 70![[thin space (1/6-em)]](https://www.rsc.org/images/entities/char_2009.gif) :
:![[thin space (1/6-em)]](https://www.rsc.org/images/entities/char_2009.gif) 30 irrespective of laser irradiation, it is reasonable to conclude that the cell death pathway in the samples of the GEM–polymer conjugate NPs, and hybrid NPs (Fig. 8) should be attributed to direct synergism (and not to additive cytotoxicity events) with photothermally induced heat given that these are the only samples where the apoptosis
30 irrespective of laser irradiation, it is reasonable to conclude that the cell death pathway in the samples of the GEM–polymer conjugate NPs, and hybrid NPs (Fig. 8) should be attributed to direct synergism (and not to additive cytotoxicity events) with photothermally induced heat given that these are the only samples where the apoptosis![[thin space (1/6-em)]](https://www.rsc.org/images/entities/char_2009.gif) :
:![[thin space (1/6-em)]](https://www.rsc.org/images/entities/char_2009.gif) necrosis ratio changes significantly, from 80
necrosis ratio changes significantly, from 80![[thin space (1/6-em)]](https://www.rsc.org/images/entities/char_2009.gif) :
:![[thin space (1/6-em)]](https://www.rsc.org/images/entities/char_2009.gif) 20 to 50
20 to 50![[thin space (1/6-em)]](https://www.rsc.org/images/entities/char_2009.gif) :
:![[thin space (1/6-em)]](https://www.rsc.org/images/entities/char_2009.gif) 50, and from 75
50, and from 75![[thin space (1/6-em)]](https://www.rsc.org/images/entities/char_2009.gif) :
:![[thin space (1/6-em)]](https://www.rsc.org/images/entities/char_2009.gif) 25 to 60
25 to 60![[thin space (1/6-em)]](https://www.rsc.org/images/entities/char_2009.gif) :
:![[thin space (1/6-em)]](https://www.rsc.org/images/entities/char_2009.gif) 40, respectively.
40, respectively.
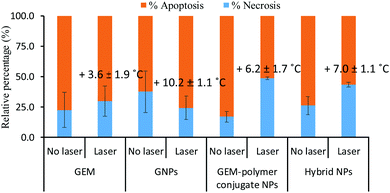 | ||
| Fig. 8 Necrotic versus apoptotic cell percentage for GEM, GNPs, GEM–polymer conjugate NPs and hybrid NPs of sample S7′ with and without irradiating cells. | ||
Experimental
Materials
Gemcitabine hydrochloride (GEM·HCl) (≥98%) was purchased from Carbosynth Ltd. 1-(3-Dimethylaminopropyl)3-ethylcarbodiimide hydrochloride (EDC), mono-2-methacyloyloxy ethyl succinate, anhydrous dimethylformamide (DMF), pyridine, sodium bicarbonate (NaHCO3), magnesium sulfate (MgSO4), 4,4′-azobis(4-cyanovaleric acid) (ACVA) and gold(III) chloride trihydrate were purchased from Sigma Aldrich. Trisodium citrate dehydrate was bought from Alfa Aesar. The chain transfer agent (CTA) (4-cyanopentanoic acid)ylethyl trithiocarbonate (CPAETC) was prepared according to a previously reported procedure.51 Hydroxybenzotriazole (HOBt) was purchased from AnaSpec Inc. Deuterated dimethylsulfoxide (DMSO-d6) was supplied from Cambridge Isotope Laboratories Inc. Methanol (MeOH), dichloromethane (DCM) and acetone were purchased from VWR International. Dulbecco's modified eagle medium (DMEM), fetal bovine serum (FBS), glutamine, penicillin, resazurin and phosphonate buffered solution (PBS) were supplied from Sigma Aldrich. TEM grids were bought from EM Resolutions. The apoptosis and necrosis quantification kit plus was supplied from Biotium.Characterisation
Solution state NMR was performed using a Bruker Avance 400 spectrometer. An LCMS-2020 instrument from Shimadzu was used to determine the molecular mass of the GEM–monomer conjugate. The DLS measurements were performed using a zetasizer nano-ZS Malvern instrument. Size exclusion chromatography (SEC) was conducted with DMF as the mobile phase containing 5 mM NH4BF4 additive at 70 °C with a flow rate of 1.00 mL min−1. 100 μL polymer aliquots in DMF (5 mg mL−1) were injected in a Viscotek system equipped with a refractive index (RI) detector. Poly(methyl methacrylate) (PMMA) standards were used for calibration and OMNISEC software was used to determine the average molecular weight (Mn) and index of polydispersity (ĐM). A Cary 100 UV-vis spectrophotometer from Agilent Technologies was used to record UV-vis absorption spectra. A SpectraMax® M2e multimode microplate reader was used to measure the fluorescence and absorbance of the samples. TEM images were recorded using a Philips/FEI CM120 Bio Twin Transmission Electron Microscope. Polymer samples of 1 mg mL−1 in double distilled water were directly dispensed onto TEM grids and left to dry without staining. A red laser (640 nm, MRL-MD-640-1W) was used for irradiating samples/cells. An optical microscope, EVOS FL, was used for imaging cells and ImageJ software was used to quantify the death ratios of the cells.Synthesis of GEM–monomer conjugate
GEM–monomer conjugate 3 was prepared according to our previously reported procedure.38 In a 100 mL one-neck round bottom flask, GEM·HCl 1 (651 mg, 2.17 mmol, 1 eq.), 1-hydroxybenzotriazole (333 mg, 2.17 mmol, 1 eq.), 1-(3-dimethylaminopropyl)3-ethylcarbodiimide hydrochloride (417 mg, 2.17 mmol, 1 eq.) and mono-2-methacyloyloxy ethyl succinate 2 (500 mg, 2.17 mmol, 1 eq.) were dissolved in dry DMF (26 mL) and pyridine (2 mL). The reaction mixture was purged with argon and left at room temperature for 72 h under a positive Argon atmosphere. The reaction mixture was concentrated under vacuum and ethyl acetate was added (50 mL). The organic phase was washed with 10% NaHCO3 aqueous solution (3 × 50 mL) and dried over MgSO4. The solution was concentrated under vacuum and the product was purified via column chromatography using DCM![[thin space (1/6-em)]](https://www.rsc.org/images/entities/char_2009.gif) :
:![[thin space (1/6-em)]](https://www.rsc.org/images/entities/char_2009.gif) MeOH (15
MeOH (15![[thin space (1/6-em)]](https://www.rsc.org/images/entities/char_2009.gif) :
:![[thin space (1/6-em)]](https://www.rsc.org/images/entities/char_2009.gif) 1 v/v) as the mobile phase (Rf value of 0.3). The product GEM–monomer conjugate 3 was obtained as a white powder in a 45% yield (414 mg) and was characterized by NMR and mass spectroscopy. 1H NMR (400 MHz, DMSO-d6) δH (ppm) 1.85 (t, J = 1.3 Hz, 3H, –CH3), 2.59 (m, 2H, –O–C(O)–CH2–), 2.71 (m, 2H, –CH2–C(O)–NH–), 3.68–3.79 (m, 2H, –CH2–OH, 2H), 3.90 (m, 1H, –CH–O–), 4.18 (m, 1H, –CH(OH)–), 4.27 (s, 4H, –O–CH2–CH2–O–), 5.28 (t, J = 5.5 Hz, 1H, CH2–OH), 5.64 (quint, J = 1.6 Hz 1H, HCH
1 v/v) as the mobile phase (Rf value of 0.3). The product GEM–monomer conjugate 3 was obtained as a white powder in a 45% yield (414 mg) and was characterized by NMR and mass spectroscopy. 1H NMR (400 MHz, DMSO-d6) δH (ppm) 1.85 (t, J = 1.3 Hz, 3H, –CH3), 2.59 (m, 2H, –O–C(O)–CH2–), 2.71 (m, 2H, –CH2–C(O)–NH–), 3.68–3.79 (m, 2H, –CH2–OH, 2H), 3.90 (m, 1H, –CH–O–), 4.18 (m, 1H, –CH(OH)–), 4.27 (s, 4H, –O–CH2–CH2–O–), 5.28 (t, J = 5.5 Hz, 1H, CH2–OH), 5.64 (quint, J = 1.6 Hz 1H, HCH![[double bond, length as m-dash]](https://www.rsc.org/images/entities/char_e001.gif) C(CH3)–), 6.01 (dq, J = 2.0, 1.0 Hz, 1H, HCH
C(CH3)–), 6.01 (dq, J = 2.0, 1.0 Hz, 1H, HCH![[double bond, length as m-dash]](https://www.rsc.org/images/entities/char_e001.gif) C(CH3)–), 6.17 (t, J = 7.6 Hz, 1H, –C–CH
C(CH3)–), 6.17 (t, J = 7.6 Hz, 1H, –C–CH![[double bond, length as m-dash]](https://www.rsc.org/images/entities/char_e001.gif) CH–N–), 6.29 (d, J = 6.5 Hz, 1H, –CH–OH), 7.22 (d, J = 7.6 Hz, 1H, –N–CH–O), 8.22 (d, J = 7.6 Hz, 1H, C–CH
CH–N–), 6.29 (d, J = 6.5 Hz, 1H, –CH–OH), 7.22 (d, J = 7.6 Hz, 1H, –N–CH–O), 8.22 (d, J = 7.6 Hz, 1H, C–CH![[double bond, length as m-dash]](https://www.rsc.org/images/entities/char_e001.gif) CH–N–), 11.08 (s, 1H, –C(O)–NH–); 13C NMR (400 MHz, DMSO-d6) δC (ppm) 17.9 (–CH3), 28.0 (–O–C(O)–CH2–), 31.2 (–CH2–C(O)–NH–), 58.8 (–CH2–OH), 61.9 (–O–CH2–CH2–O–), 62.4 (–O–CH2–CH2–O–), 68.3 (–CH–OH), 81.0 (–CH–CH2–OH), 95.8 (–CH–CH
CH–N–), 11.08 (s, 1H, –C(O)–NH–); 13C NMR (400 MHz, DMSO-d6) δC (ppm) 17.9 (–CH3), 28.0 (–O–C(O)–CH2–), 31.2 (–CH2–C(O)–NH–), 58.8 (–CH2–OH), 61.9 (–O–CH2–CH2–O–), 62.4 (–O–CH2–CH2–O–), 68.3 (–CH–OH), 81.0 (–CH–CH2–OH), 95.8 (–CH–CH![[double bond, length as m-dash]](https://www.rsc.org/images/entities/char_e001.gif) CH–N–), 122.9 (–C–F), 126.0 (CH2
CH–N–), 122.9 (–C–F), 126.0 (CH2![[double bond, length as m-dash]](https://www.rsc.org/images/entities/char_e001.gif) C(CH3)–), 135.5 (–C(CH3)
C(CH3)–), 135.5 (–C(CH3)![[double bond, length as m-dash]](https://www.rsc.org/images/entities/char_e001.gif) CH2), 144.7 (–CH
CH2), 144.7 (–CH![[double bond, length as m-dash]](https://www.rsc.org/images/entities/char_e001.gif) CH–N–), 154.1 (–N–C(O)–N), 162.7 (–NH–C
CH–N–), 154.1 (–N–C(O)–N), 162.7 (–NH–C![[double bond, length as m-dash]](https://www.rsc.org/images/entities/char_e001.gif) N–), 166.3 (–C(O)–O–), 171.9 (–CH2–O–C(O)–CH2), 172.7 (–C(O)–NH–); LCMS (ESI) m/z: [M + H]+ 476.15 (calculated); 476.10 (found).
N–), 166.3 (–C(O)–O–), 171.9 (–CH2–O–C(O)–CH2), 172.7 (–C(O)–NH–); LCMS (ESI) m/z: [M + H]+ 476.15 (calculated); 476.10 (found).
RAFT polymerization of the GEM–monomer conjugate (DP =100)
In a 10 mL one-neck round-bottom flask, GEM–monomer conjugate 3 (109 mg, 0.229 mmol, 100 eq.), CTA 4 (0.6 mg, 0.023 mmol, 1 eq.) and ACVA (0.128 mg, 0.0005 mmol, 0.2 eq.) were dissolved in DMF (0.5 mL). The flask was sealed with a rubber septum and purged using argon for 15 min. The flask was heated at 70 °C for 8 h under magnetic stirring. The reaction was stopped by exposing the solution to open air and the polymer/monomer mixture was precipitated using diethyl ether (5 mL). The residual monomer was washed away using methanol (3 × 5 mL) and the polymer was dried under vacuum. The polymer 5 was obtained as a slight yellow powder in a yield of 81.2% (89 mg) and was characterized using NMR spectroscopy (Fig. S3, ESI†) and SEC (Fig. S4, ESI†).Preparation of spherical gold nanoparticles (GNPs)
A solution of gold(III) chloride trihydrate (0.4 mg mL−1) was prepared using distilled water and was heated to 70 °C. 7.5 mL of an aqueous solution of trisodium citrate (10 mg mL−1) was added and the mixture was left under magnetic stirring for 30 min. A change in colour was observed; from a slight yellow to a bright ruby colour indicating the successful preparation of spherical gold nanoparticles (GNPs), which were further characterised using UV-vis spectrophotometry and DLS.Formation of the hybrid nanoparticles
The GEM–polymer conjugate (5 mg) was dissolved in acetone and mixed with an aqueous GNP solution (0.2 mg mL−1) (1![[thin space (1/6-em)]](https://www.rsc.org/images/entities/char_2009.gif) :
:![[thin space (1/6-em)]](https://www.rsc.org/images/entities/char_2009.gif) 1 v/v, 10 mL) in a 12 mL sample vial flask. Subsequently, 2-fold dilutions were prepared using the same acetone/GNP mixture with the concentration of polymer ranging from 1 mg mL−1 to 2 μg mL−1 (S1 to S10). For dilution number 4, 6, 7 and 8, another set of samples (S4′, S6′, S7′ and S8′) were prepared where the concentration of GNPs was increased by a factor 2. For each sample, acetone was removed using a rotor evaporator under controlled conditions (100 rpm, 100 mBar, 40 °C). The hydrid NPs of each sample were characterised using DLS, UV-vis spectrophotometry and TEM.
1 v/v, 10 mL) in a 12 mL sample vial flask. Subsequently, 2-fold dilutions were prepared using the same acetone/GNP mixture with the concentration of polymer ranging from 1 mg mL−1 to 2 μg mL−1 (S1 to S10). For dilution number 4, 6, 7 and 8, another set of samples (S4′, S6′, S7′ and S8′) were prepared where the concentration of GNPs was increased by a factor 2. For each sample, acetone was removed using a rotor evaporator under controlled conditions (100 rpm, 100 mBar, 40 °C). The hydrid NPs of each sample were characterised using DLS, UV-vis spectrophotometry and TEM.
Evaluation of the colloidal stability of the hybrid NPs
The hybrid NPs of each sample (S1 to S10 and S4′, S6′, S7′ and S8′) were left at room temperature. After 16 days, the size and dispersity of the hybrid NPs were measured using DLS.Evaluation of the thermal effect
Hybrid NPs of sample S7′, the GNP suspension and distilled water (1 mL) were irradiated using a 640 nm CW laser for 10 min (0.8 W cm−2) and left to cool for another 10 min. The concentration of Hybrid NPs of Sample S7′ and the GNP solution was adjusted in order to have their absorption maxima equal at their respective wavelengths. The temperature of the samples was recorded every minute for 20 minutes and was plotted as a function of the time.Cytotoxicity assay
 | (1) |
Conclusions
Overall, we presented a simple, well-defined and dual functional nanoformulation for the treatment of pancreatic cancer cells based on a gemcitabine polymer conjugate that could effectively encapsulate GNPs in an aggregated state to exert red-absorbing characteristics. We showed that various parameters of the formulation such as the size, and the optical properties can be adjusted by simple preparation routes. The hybrid NPs could exert a synergistic photochemotherapeutic effect under therapeutically relevant conditions and also fulfil certain desirable formulation characteristics such as simplicity in preparation, very high drug loading, colloidal stability, and photothermal properties, which we believe render our approach promising for nanomedicinal formulations for pancreatic cancer.Conflicts of interest
There are no conflicts to declare.Acknowledgements
This study was funded by the Engineering and Physical Sciences Research Council (EPSRC, EP/M014649/1; GP, FJ). We thank the UCL Excellence Fellowship award (GP).References
- O. E. Rahma, A. Duffy, D. J. Liewehr, S. M. Steinberg and T. F. Greten, Ann. Oncol., 2013, 24, 1972–1979 CrossRef CAS PubMed.
- D. Ansari, B. Tingstedt, B. Andersson, F. Holmquist, C. Sturesson, C. Williamsson, A. Sasor, D. Borg, M. Bauden and R. Andersson, Future Oncol., 2016, 12, 1929–1946 CrossRef CAS PubMed.
- H. Oettle, P. Neuhaus and A. Hochhaus, et al. , JAMA, J. Am. Med. Assoc., 2013, 310, 1473–1481 CrossRef CAS PubMed.
- C. M. Galmarini, J. R. Mackey and C. Dumontet, Leukemia, 2001, 15, 875–890 CrossRef CAS PubMed.
- R. Andersson, U. Aho, B. I. Nilsson, G. J. Peters, M. Pastor-Anglada, W. Rasch and M. L. Sandvold, Scand. J. Gastroenterol., 2009, 44, 782–786 CrossRef CAS PubMed.
- E. Moysan, G. Bastiat and J.-P. Benoit, Mol. Pharmaceutics, 2013, 10, 430–444 CrossRef CAS PubMed.
- A. Manzur, A. Oluwasanmi, D. Moss, A. Curtis and C. Hoskins, Pharmaceutics, 2017, 9, 39 CrossRef PubMed.
- H. Cabral, Y. Matsumoto, K. Mizuno, Q. Chen, M. Murakami, M. Kimura, Y. Terada, M. R. Kano, K. Miyazono, M. Uesaka, N. Nishiyama and K. Kataoka, Nat. Nanotechnol., 2011, 6, 815–823 CrossRef CAS PubMed.
- W. Wang, C. Li, J. Zhang, A. Dong and D. Kong, J. Mater. Chem. B, 2014, 2, 1891–1901 RSC.
- D. Trung Bui, A. Maksimenko, D. Desmaële, S. Harrisson, C. Vauthier, P. Couvreur and J. Nicolas, Biomacromolecules, 2013, 14, 2837–2847 CrossRef CAS PubMed.
- D. Chitkara, A. Mittal, S. W. Behrman, N. Kumar and R. I. Mahato, Bioconjugate Chem., 2013, 24, 1161–1173 CrossRef CAS PubMed.
- V. Khare, S. Kour, N. Alam, R. D. Dubey, A. Saneja, M. Koul, A. P. Gupta, D. Singh, S. K. Singh, A. K. Saxena and P. N. Gupta, Int. J. Pharm., 2014, 470, 51–62 CrossRef CAS PubMed.
- H. Song, H. Xiao, M. Zheng, R. Qi, L. Yan and X. Jing, J. Mater. Chem. B, 2014, 2, 6560–6570 RSC.
- M. Vandana and S. K. Sahoo, Biomaterials, 2010, 31, 9340–9356 CrossRef CAS PubMed.
- T. J. Liang, Z. M. Zhou, Y. Q. Cao, M. Z. Ma, X. J. Wang and K. Jing, Int. J. Pharm., 2016, 513, 564–571 CrossRef CAS PubMed.
- L. Zou, H. Wang, B. He, L. Zeng, T. Tan, H. Cao, X. He, Z. Zhang, S. Guo and Y. Li, Theranostics, 2016, 6, 762–772 CrossRef CAS PubMed.
- X.-M. Zhu, C. Fang, H. Jia, Y. Huang, C. H. K. Cheng, C.-H. Ko, Z. Chen, J. Wang and Y.-X. J. Wang, Nanoscale, 2014, 6, 11462–11472 RSC.
- X. Huang, S. Tang, X. Mu, Y. Dai, G. Chen, Z. Zhou, F. Ruan, Z. Yang and N. Zheng, Nat. Nanotechnol., 2011, 6, 28–32 CrossRef CAS PubMed.
- Q. Tian, M. Tang, Y. Sun, R. Zou, Z. Chen, M. Zhu, S. Yang, J. Wang, J. Wang and J. Hu, Adv. Mater., 2011, 23, 3542–3547 CrossRef CAS PubMed.
- S. S. Chou, B. Kaehr, J. Kim, B. M. Foley, M. De, P. E. Hopkins, J. Huang, C. J. Brinker and V. P. Dravid, Angew. Chem., Int. Ed., 2013, 52, 4160–4164 CrossRef CAS PubMed.
- J. T. Robinson, S. M. Tabakman, Y. Liang, H. Wang, H. Sanchez Casalongue, D. Vinh and H. Dai, J. Am. Chem. Soc., 2011, 133, 6825–6831 CrossRef CAS PubMed.
- X. He, X. Bao, H. Cao, Z. Zhang, Q. Yin, W. Gu, L. Chen, H. Yu and Y. Li, Adv. Funct. Mater., 2015, 25, 2831–2839 CrossRef CAS.
- J. R. Lepock, K.-H. Cheng, H. Al-qysi, I. Sim, C. J. Koch and J. Kruuv, Int. J. Hyperthermia, 1987, 3, 123–132 CrossRef CAS PubMed.
- J. R. Lepock, H. E. Frey, A. M. Rodahl and J. Kruuv, J. Cell. Physiol., 1988, 137, 14–24 CrossRef CAS PubMed.
- N. S. Abadeer and C. J. Murphy, J. Phys. Chem. C, 2016, 120, 4691–4716 CAS.
- X. Huang, P. K. Jain, I. H. El-Sayed and M. A. El-Sayed, Lasers Med. Sci., 2008, 23, 217–228 CrossRef PubMed.
- X. Wu, L. Zhou, Y. Su and C.-M. Dong, J. Mater. Chem. B, 2016, 4, 2142–2152 RSC.
- C. Du, J. Qian, L. Zhou, Y. Su, R. Zhang and C.-M. Dong, ACS Appl. Mater. Interfaces, 2017, 9, 31576–31588 CAS.
- D. Wang, Z. Xu, H. Yu, X. Chen, B. Feng, Z. Cui, B. Lin, Q. Yin, Z. Zhang, C. Chen, J. Wang, W. Zhang and Y. Li, Biomaterials, 2014, 35, 8374–8384 CrossRef CAS PubMed.
- Z. Zhang, J. Wang, X. Nie, T. Wen, Y. Ji, X. Wu, Y. Zhao and C. Chen, J. Am. Chem. Soc., 2014, 136, 7317–7326 CrossRef CAS PubMed.
- T. Sun, Y. Wang, Y. Wang, J. Xu, X. Zhao, S. Vangveravong, R. H. Mach and Y. Xia, Adv. Healthcare Mater., 2014, 3, 1283–1291 CrossRef CAS PubMed.
- J. Peng, T. Qi, J. Liao, B. Chu, Q. Yang, Y. Qu, W. Li, H. Li, F. Luo and Z. Qian, Theranostics, 2014, 4, 678–692 CrossRef PubMed.
- E. A. K. Nivethaa, S. Dhanavel, V. Narayanan, C. A. Vasu and A. Stephen, RSC Adv., 2015, 5, 1024–1032 RSC.
- D. Cassano, M. Santi, V. Cappello, S. Luin, G. Signore and V. Voliani, Part. Part. Syst. Charact., 2016, 33, 818–824 CrossRef CAS.
- J. Wan, J.-H. Wang, T. Liu, Z. Xie, X.-F. Yu and W. Li, Sci. Rep., 2015, 5, 11398 CrossRef PubMed.
- R. van der Meel, T. Lammers and W. E. Hennink, Expert Opin. Drug Delivery, 2017, 14, 1–5 CrossRef PubMed.
- K. Raemdonck and S. C. De Smedt, Nat. Biotechnol., 2015, 33, 1026–1027 CrossRef CAS PubMed.
- F. Joubert, L. Martin, S. Perrier and G. Pasparakis, ACS Macro Lett., 2017, 6, 535–540 CrossRef CAS.
- J. Turkevich, P. C. Stevenson and J. Hillier, Discuss. Faraday Soc., 1951, 11, 55–75 RSC.
- L. M. Demers, M. Östblom, H. Zhang, N.-H. Jang, B. Liedberg and C. A. Mirkin, J. Am. Chem. Soc., 2002, 124, 11248–11249 CrossRef CAS PubMed.
- C. R. Patra, R. Bhattacharya, E. Wang, A. Katarya, J. S. Lau, S. Dutta, M. Muders, S. Wang, S. A. Buhrow, S. L. Safgren, M. J. Yaszemski, J. M. Reid, M. M. Ames, P. Mukherjee and D. Mukhopadhyay, Cancer Res., 2008, 68, 1970–1978 CrossRef CAS PubMed.
- M. Mammen, S.-K. Choi and G. M. Whitesides, Angew. Chem., Int. Ed., 1998, 37, 2754–2794 CrossRef.
- X. Liu, B. Li, F. Fu, K. Xu, R. Zou, Q. Wang, B. Zhang, Z. Chen and J. Hu, Dalton Trans., 2014, 43, 11709–11715 RSC.
- M. Sun, F. Liu, Y. Zhu, W. Wang, J. Hu, J. Liu, Z. Dai, K. Wang, Y. Wei, J. Bai and W. Gao, Nanoscale, 2016, 8, 4452–4457 RSC.
- T.-C. Chou and P. Talalay, Trends Pharmacol. Sci., 1983, 4, 450–454 CrossRef CAS.
- J.-L. Li and M. Gu, Biomaterials, 2010, 31, 9492–9498 CrossRef CAS PubMed.
- J. R. Melamed, R. S. Edelstein and E. S. Day, ACS Nano, 2015, 9, 6–11 CrossRef CAS PubMed.
- C. Tortiglione and R. Iachetta, Ann. Transl. Med., 2016, 4, S51 CrossRef PubMed.
- P. Cherukuri, E. S. Glazer and S. A. Curley, Adv. Drug Delivery Rev., 2010, 62, 339–345 CrossRef CAS PubMed.
- B. Hildebrandt, P. Wust, O. Ahlers, A. Dieing, G. Sreenivasa, T. Kerner, R. Felix and H. Riess, Crit. Rev. Oncol. Hematol., 2002, 43, 33–56 CrossRef PubMed.
- T. R. Barlow, J. C. Brendel and S. Perrier, Macromolecules, 2016, 49, 6203–6212 CrossRef CAS.
Footnote |
| † Electronic supplementary information (ESI) available: Reaction scheme, 1H NMR spectrum and GPC trace of GEM–polymer conjugate, DLS measurements, mathematical demonstration of the calculation of the heat conversion efficiency. See DOI: 10.1039/c7tb03261g |
| This journal is © The Royal Society of Chemistry 2018 |

