
 Open Access Article
 This Open Access Article is licensed under a
 Creative Commons Attribution 3.0 Unported Licence
Visualizing the morphological and compositional evolution of the interface of InLi-anode|thio-LISION electrolyte in an all-solid-state Li–S cell by in operando synchrotron X-ray tomography and energy dispersive diffraction†
Fu
Sun‡
 *a,
Kang
Dong‡
ab,
Markus
Osenberg
ab,
André
Hilger
a,
Sebastian
Risse
c,
Yan
Lu
cd,
Paul H.
Kamm
a,
Manuela
Klaus
e,
Henning
Markötter
a,
Francisco
García-Moreno
a,
Tobias
Arlt
b and
Ingo
Manke
a
*a,
Kang
Dong‡
ab,
Markus
Osenberg
ab,
André
Hilger
a,
Sebastian
Risse
c,
Yan
Lu
cd,
Paul H.
Kamm
a,
Manuela
Klaus
e,
Henning
Markötter
a,
Francisco
García-Moreno
a,
Tobias
Arlt
b and
Ingo
Manke
a
aInstitute of Applied Materials, Helmholtz-Zentrum Berlin für Materialien und Energie, Hahn-Meitner-Platz 1, 14109 Berlin, Germany. E-mail: fu.sun@helmholtz-berlin.de; sunfu1998@gmail.com
bInstitute of Materials Science and Technologies, Technical University Berlin, Strasse des 17. Juni 135, 10623 Berlin, Germany
cInstitute of Soft Matter and Functional Materials, Helmholtz-Zentrum Berlin für Materialien und Energie, Hahn-Meitner-Platz 1, 14109 Berlin, Germany
dInstitute of Chemistry, University of Potsdam, Am Neuen Palais 10, House 9, 14469 Potsdam, Germany
eDepartment of Microstructure and Residual Stress Analysis, Helmholtz-Zentrum Berlin für Materialien und Energie, Albert-Einstein-Straße 15, 12489 Berlin, Germany
First published on 24th October 2018
Abstract
Dynamic and direct visualization of interfacial evolution is helpful in gaining fundamental knowledge of all-solid-state-lithium battery working/degradation mechanisms and clarifying future research directions for constructing next-generation batteries. Herein, in situ and in operando synchrotron X-ray tomography and energy dispersive diffraction were simultaneously employed to record the morphological and compositional evolution of the interface of InLi-anode|sulfide-solid-electrolyte during battery cycling. Compelling morphological evidence of interfacial degradation during all-solid-state-lithium battery operation has been directly visualized by tomographic measurement. The accompanying energy dispersive diffraction results agree well with the observed morphological deterioration and the recorded electrochemical performance. It is concluded from the current investigation that a fundamental understanding of the phenomena occurring at the solid–solid electrode|electrolyte interface during all-solid-state-lithium battery cycling is critical for future progress in cell performance improvement and may determine its final commercial viability.
Developments in future battery technology are increasingly required to address the safety issues associated with state-of-the-art lithium ion batteries (LIBs). Toyota Motor Corporation and Samsung R&D Institute Japan,1 for example, are devoted to promoting the application of all-solid-state lithium batteries (ASSLBs) in electric vehicles via replacing the conventional liquid electrolyte with a sulfide solid electrolyte (SE), which possesses high conductivity, good formability, favorable Young's modulus and moderate chemical stability.2 However, in analogy with other inorganic oxide SEs,3 the interface between the sulfide SE and battery electrode also poses technical challenges for its practical application.4 It has been discovered by using 7Li magnetic resonance imaging that Li distribution at the interface is inhomogeneous.5 Moreover, Zhang et al. have directly observed significant interface bending caused by volume expansion by using X-ray tomography after battery cycling.6 They later experimentally confirmed using electrochemical impedance spectroscopy that interfacial resistance increases drastically due to interface degradation as a function of cycles.7 Similar interface deterioration phenomena have been detected in inorganic oxide SEs by X-ray diffraction (XRD),8 scanning electron microscopy,9 transmission electron microscopy,10 scanning transmission electron microscopy coupled with electron energy loss spectroscopy,11 time-of-flight secondary-ion mass spectrometry,12 X-ray photoelectron spectroscopy,13 Auger electron spectroscopy14 and electron holography.15
These in-depth studies have greatly enriched the understanding of the degradation mechanisms at the solid electrode|electrolyte interfaces which straightforwardly determine the overall electrochemical performance of ASSLBs. Nevertheless, in operando and nondestructive investigations,16 which could guarantee direct visual access to the dynamic evolution of interfaces under ASSLB operation, have not been reported due to the challenging characterization requirements, to the best of the authors' knowledge. Directly tracking the compositional and morphological evolution of the interfaces during electrochemical cycling would provide unprecedented benefits in gaining an understanding of the working/decaying/failure mechanisms of ASSLBs and would contribute significantly to their industrial commercialization.
Herein, in operando synchrotron X-ray tomography and energy dispersive diffraction were simultaneously employed to record the morphological and compositional evolution of the interface of anode|sulfide-SE for the first time. Specifically, a commercially available lithium tin phosphorous sulfide (Li10SnP2S12, LSPS)17 SE, a LISION (LIthium Super-IONic conductor) belonging to the LGPS (Li10GeP2S12) family discovered by Kamaya et al. in 2011,18 was selected to assemble an all-solid-state lithium sulfur battery (ASSLSB). An indium–lithium (InLi) alloy (Li![[thin space (1/6-em)]](https://www.rsc.org/images/entities/char_2009.gif) :In = 2.34:1 in at% or 1.5:10.6 in wt%) and a Li2S based composite (Li2S:SE:C = 3.5:4:2.5 in wt%) were used as the anode and cathode, respectively. The mass of the InLi anode, SE and composite cathode used was 12.1, 5.6 and 0.4 mg, respectively. The diameter of the assembled electrode components was 3 mm and they were pressed under ∼370 MPa. The cell was cycled successively at 1C, 0.5C, 0.25C and 0.1C at 70 °C during the in operando measurement. Detailed cell assembly and characterization procedures can be found in the Methods section. A photo of the designed cell and its schematic illustration, along with the illustration for the employed beamline setup are shown in Fig. 1.19–24 For the investigations targeted at the cathode side, readers can refer to previous reports.25–27
:In = 2.34:1 in at% or 1.5:10.6 in wt%) and a Li2S based composite (Li2S:SE:C = 3.5:4:2.5 in wt%) were used as the anode and cathode, respectively. The mass of the InLi anode, SE and composite cathode used was 12.1, 5.6 and 0.4 mg, respectively. The diameter of the assembled electrode components was 3 mm and they were pressed under ∼370 MPa. The cell was cycled successively at 1C, 0.5C, 0.25C and 0.1C at 70 °C during the in operando measurement. Detailed cell assembly and characterization procedures can be found in the Methods section. A photo of the designed cell and its schematic illustration, along with the illustration for the employed beamline setup are shown in Fig. 1.19–24 For the investigations targeted at the cathode side, readers can refer to previous reports.25–27
 | ||
| Fig. 1 Photograph and schematic illustration of the customized electrochemical cell and the illustration of the employed beamline setup. (A) Photograph of the fabricated cell; the enlarged picture in the black rectangle shows the interior of a blank cell, characterized by a laboratory X-ray setup. (B) Corresponding schematic representation of the cell consisting of a polyamide-imide housing (yellow), two screws (light grey), two sealing rings (pink), and the solid Li10SnP2S12 electrolyte (white) sandwiched between the InLi anode and the Li2S based composite cathode (blue and green respectively). (C) Schematic representation of the experimental setup of the tomography station at the EDDI beam line at BESSY II, Helmholtz-Zentrum Berlin, Germany. The cell was measured in situ and in operando during cycling by simultaneous synchrotron X-ray tomography and energy dispersive diffraction. | ||
In this work, the cell undergoing four different cycles instead of long-term cycling was investigated due to the limited allocated beam time. Results from the first three cycles are shown in Fig. 2 and those from the fourth cycle are shown in Fig. 3. The electrochemical curves in Fig. 2B and 3B agree well with previous reports of ASSLSBs.28,29 The accompanying XRD and morphological recordings are shown in Fig. 2A, and 3A and 2C, 3C, and D, respectively. It has to be pointed out that due to the high X-ray absorption of In/InLi, the white beam at the employed EDDI beamline30,31 cannot fully penetrate the 3 mm diameter In/InLi. Only the relatively thinner part, i.e., the protuberant or convex region, can be measured and analyzed (see the results below). Note that the diffracted beam for XRD measurement has been focused on the interface of InLi-anode|LSPS-SE and the intensity scale bars in all the XRD panels are different in order to maximize the principal diffraction line changes of the InLi alloy during electrochemical cycling. Note also that, before the measurement, the cell underwent a conditioning charging at 10 μA for 5 hours and the curve is shown in Fig. S1 in the ESI.† The entire in operando measurement is shown in a Movie in the ESI.†
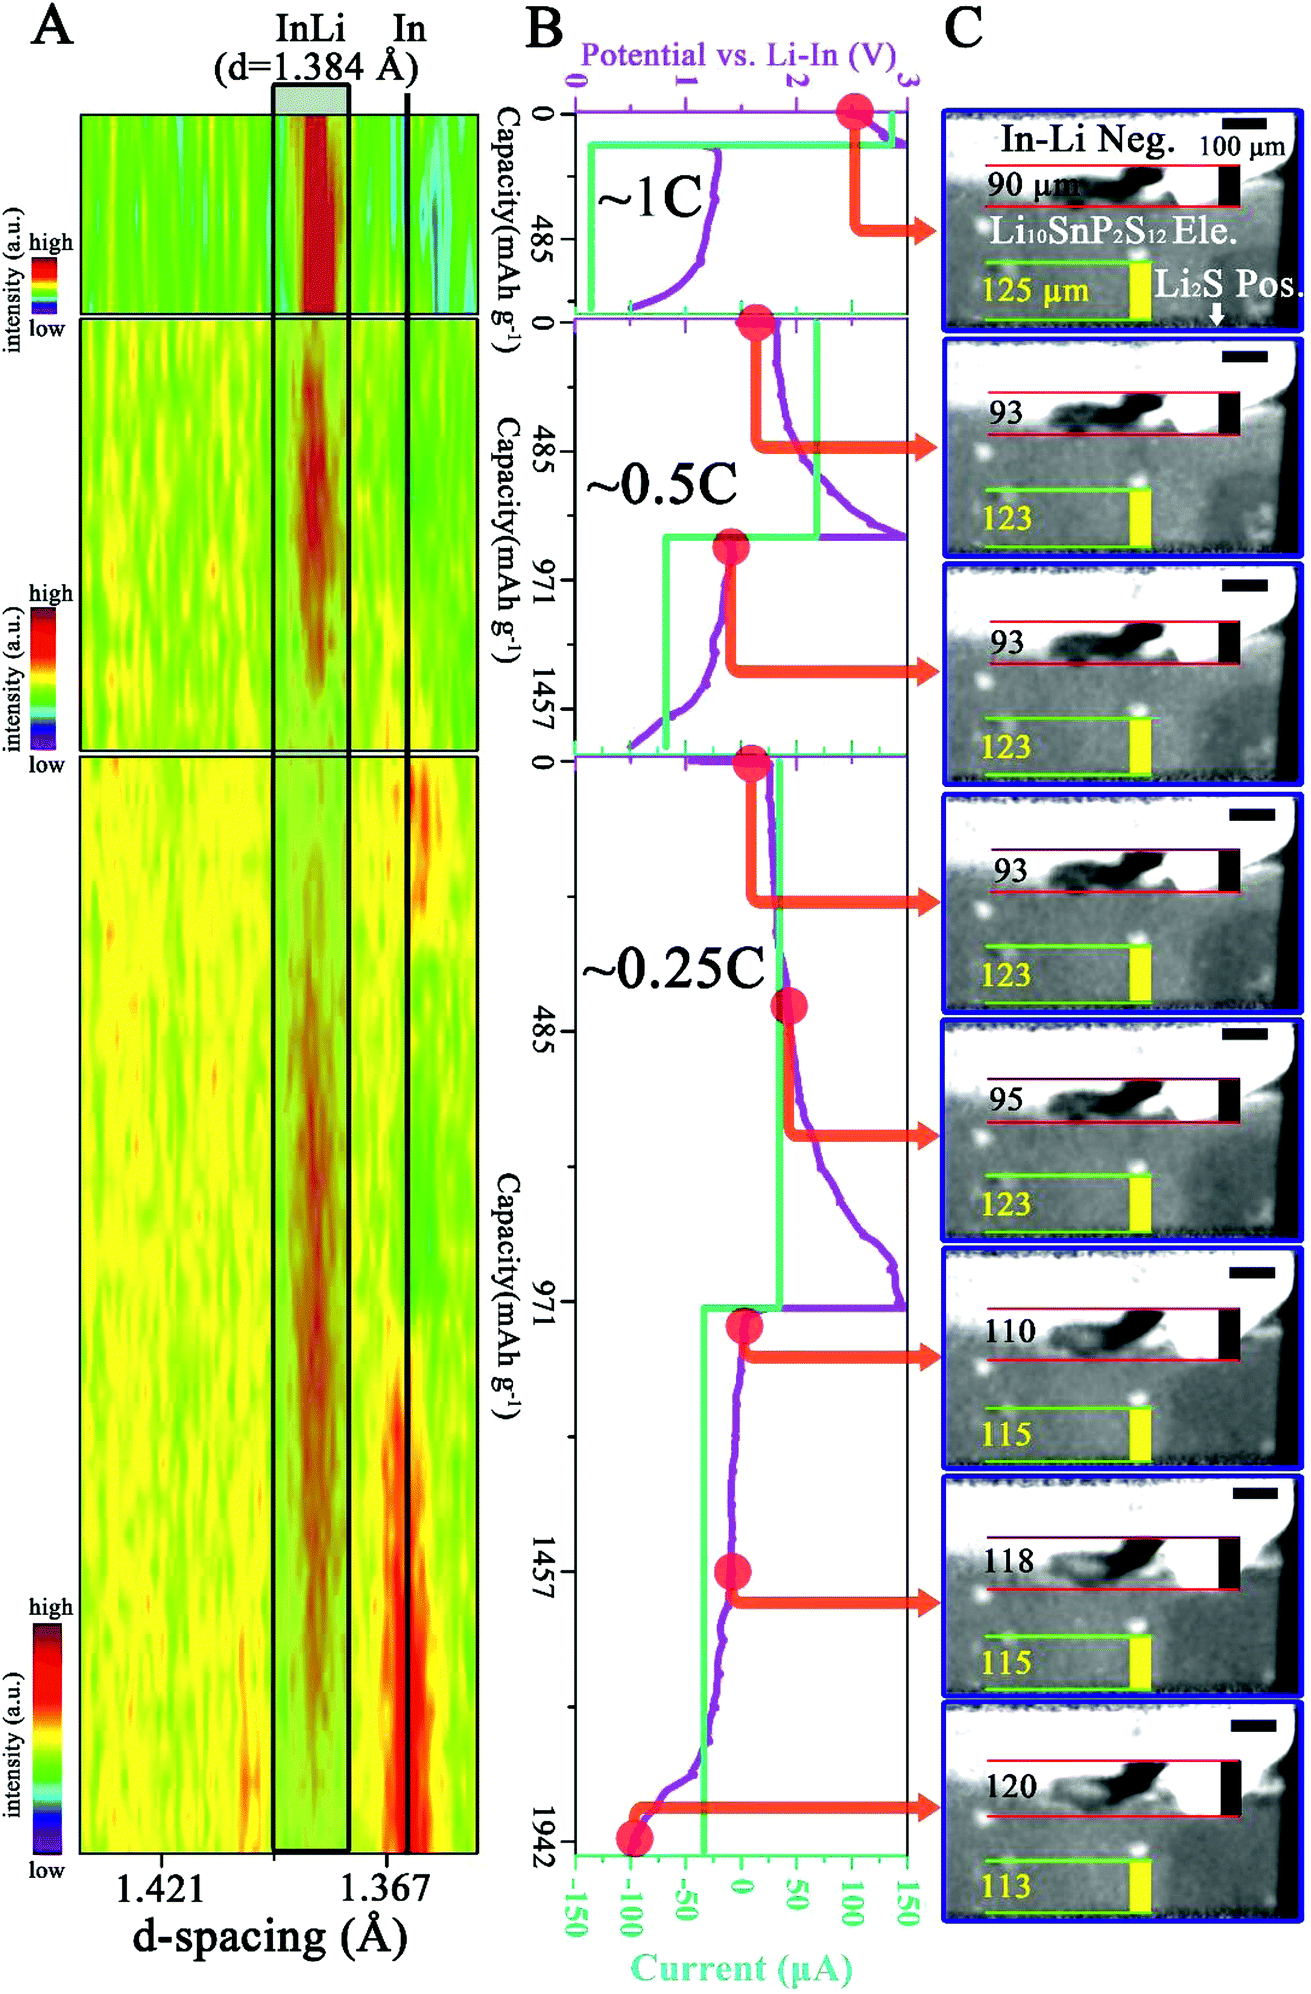 | ||
| Fig. 2 In situ and in operando measurement results of the cell from the first three cycles at 1C, 0.5C and 0.25C. (A) The recorded XRD evolution as a function of cycle state. The principal diffraction line of the In–Li alloy (hkl) = 422 is highlighted in gray in a black rectangle and the black vertical line indicates the principle line of In (hkl) = 202. (B) The recorded voltage–current curves. (C) Selected reconstructed slices showing the internal interfacial evolution as a function of battery state. The red points in (B) indicate the time when the slices in (C) are chosen. Note that the intensity scales in the three XRD panels are different and the location of the region shown in (C) is shown in Fig. S2 in the ESI.† | ||
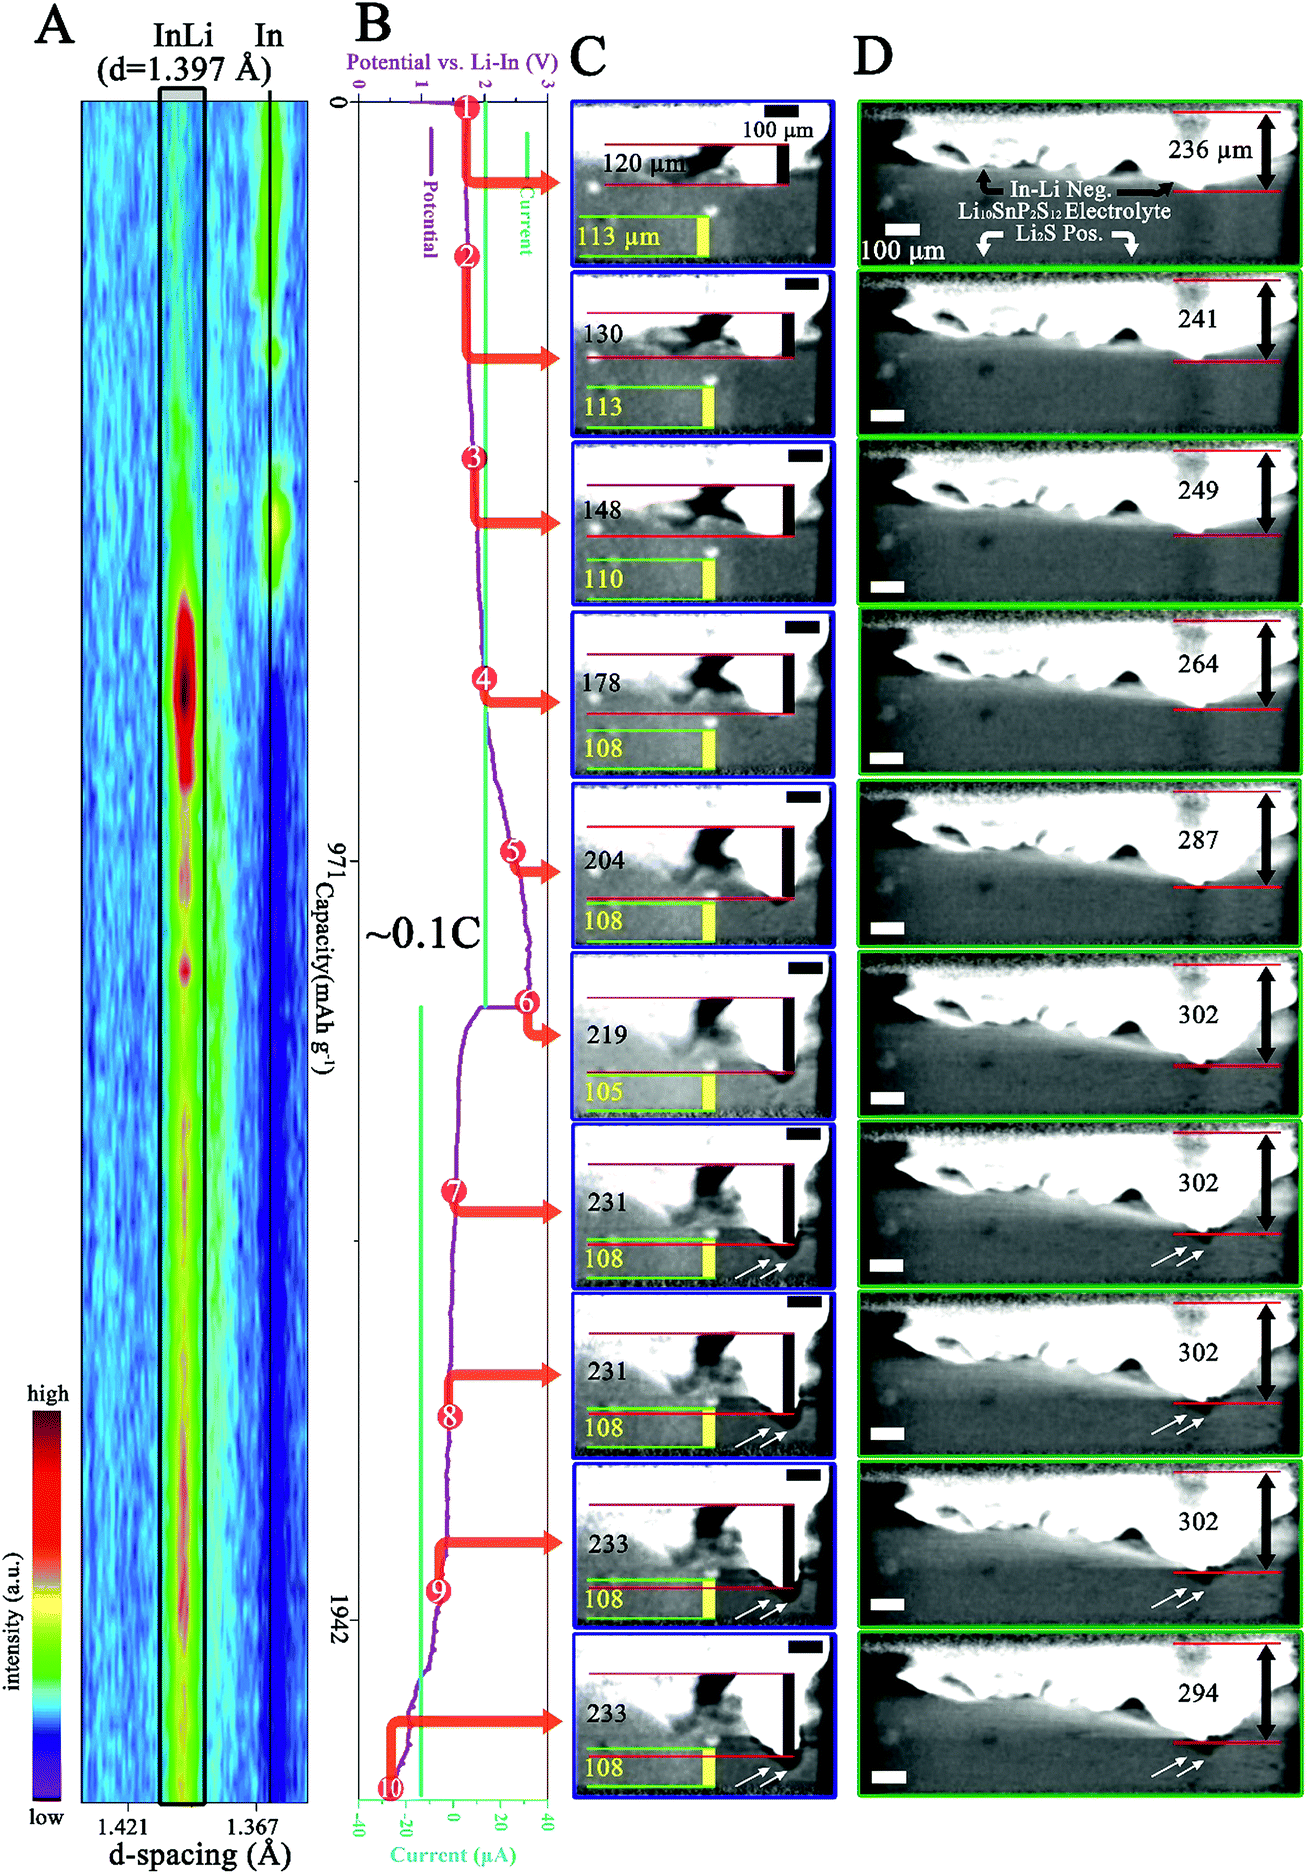 | ||
| Fig. 3 In situ and in operando measurement results of the cell from the fourth cycle at 0.1C. (A) The recorded XRD evolution as a function of battery state. The principal diffraction line of the In–Li alloy (hkl) = 422 is highlighted in gray in a black rectangle and the black vertical line indicates the principal diffraction line of In (hkl) = 202. (B) The recorded voltage–current curves. (C and D) Selected reconstructed slices showing the internal interfacial evolution as a function of battery state. Note that (C) shows the same location as that in Fig. 2C and D shows another region. The numbered red points in (B) indicate the time at which the slices in (C) and (D) are chosen. Note that the intensity scale in this XRD panel is different from that in Fig. 2A and the location of the region shown in (D) is displayed in Fig. S2 in the ESI.† | ||
From the first panel of Fig. 2C, the InLi negative (Neg.) electrode and the LSPS electrolyte (Ele.) can be clearly observed due to the different X-ray absorption coefficient. The Li2S composite positive (Pos.) electrode is located at the bottom and is shielded from the beam by the beam slits. In order to emphasize the morphological changes occurring during cycling, two features i.e. the length (vertical black line in Fig. 2C) of the protrusion of the InLi Neg. and the distance (vertical yellow line in Fig. 2C) between the selected SE particle and the bottom of the field of view (FoV) have been tracked. In Fig. 2A, the principal diffraction line of InLi (422) is highlighted in gray and a black vertical line indicates the principal diffraction line of In (202). During the first two cycles (1C and 0.5C), the XRD panels display mainly the InLi line (representing the starting composition (Li:In = 2.34:1 in at%)) and no significant morphological changes have been recorded (maybe due to the limited spatial resolution of 2.5 μm). However, during the third cycle noticeable morphological changes can be observed (last 5 panels in Fig. 2C): the InLi protrusion has grown from 93 μm to 120 μm and the tracked distance between the SE particle and the bottom of the FoV has diminished from 123 μm to 113 μm. Moreover, from the accompanying XRD measurement (last panel in Fig. 2A), it can be seen that the gradual decrease of the In peak is followed by the increase of the InLi peak during the charge process and vice versa during the discharge process.
Further significant changes can be observed from the measurement at the fourth cycle (0.1C), as shown in Fig. 3. Note that Fig. 3C shows the same region as Fig. 2C and 3D displays another region of the cell. The locations of these two regions are shown in Fig, S2 in the ESI.† After the fourth cycle (Fig. 3B), the InLi protrusion has grown from 120 μm to 233 μm (first and last panel in Fig. 3C), while the distance between the SE particle and the bottom of the FoV has further diminished to 108 μm (compare the first and the last panel in Fig. 3C). Fig. 3D, another selected region, also displays tremendous morphological changes. On taking a closer look at these morphological changes, one can find that primary changes occur during the charge process (red dots marking 1 to 6 in Fig. 3B point to 6 panels in Fig. 3C and D), while during discharge (red dots marking 6 to 10 in Fig. 3B), slight changes develop except the progressively built cavity/void between the InLi Neg. and SE (see white arrows in the last 4 panels in Fig. 3C and D). Similar change behavior can be observed from the corresponding XRD measurements: the disappearance of the principal diffraction line of In is followed by appearance of the InLi line during the charge process and limited variations can be discerned during the discharge process. Comparing the measured principal diffraction line of InLi during the fourth cycle (1.397 Å) with that during the first three cycles (1.384 Å), a slightly different d spacing value can be obtained.
Elucidating these observed results requires a reconsideration of the characteristic properties of the ASSLSB. It should be pointed out that according to the XRD PDF card (00-003-0908), the d spacing value of the InLi alloy at (hkl) = 422 is 1.390 Å.32 During cell assembly, significant pressure has been employed to facilitate the interfacial contact of solid InLi-anode|LSPS SE (∼370 MPa). Moreover, during cell cycling, further pressure can be generated due to the tremendous volume change of In and Li2S. Thus, it can be expected that these stresses can result in noticeable lattice strain of InLi and resultantly, a smaller d value than 1.390 Å is obtained. On the other hand, the volume change induced interface degradation can be anticipated during cycling because no permanent pressure has been applied to this cell and the rigid solid electrode/electrolyte lacks the flexibility to transform/flow freely. As a result, after the delithiation of the InLi anode during the third cycle, the InLi lattice is probably under tensile stress (see the assumption below), generating a d value larger than 1.390 Å. Another explanation for the larger d value of 1.397 Å may be the formation of more lithium rich phases such as In2Li3 or InLi2 during the de-alloying of InLi33 and therefore an enrichment of indium (which has a larger atomic radius than lithium) in the InLi phase (which has a wide compositional range). More sophisticated compositional investigations are needed for further clarification to distinguish different phases. Nevertheless, the volume change causing build-up/release of the strain/stress in the electrode layer may further change the mechanical structure of the electrode|electrolyte interface and the connection between them can be weakened. This can be clearly observed in the last four panels of Fig. 3C and D (see the white arrows). As a matter of fact, the pressure generation/release caused by the (electro)chemical expansion/contraction of electrode materials during ASSLB cycling has been measured in situ using a dilatometer by Zhang and co-workers.6,34 Unfortunately, to the best of the authors' knowledge, in situ XRD investigation of electrode/electrolyte materials in ASSBs has not been reported until now.
Clarifying the limited volume change of the InLi anode during discharge requires taking the high X-ray absorption and inflexible property of In/InLi into consideration. Assuming that cavities/voids develop due to the delithiation of the InLi alloy near the current collector during discharge, they can hardly be detected by synchrotron X-ray tomography because (i) the X-rays cannot penetrate the surrounding In/InLi due to its high X-ray absorption and (ii) the rigid In/InLi cannot shrink back automatically due to the absence of applied external pressure. In contrast to those of the discharge process, the charge process induced morphological changes can be easily detected because of the surficial In/InLi volume growth. Further studies will focus on the quantification of the volume expansion after the 0.1C charge process electrochemically (from the electrochemical characterization) and morphologically (from the tomography characterization). The reconstructed tomography datasets at the beginning and end of the 0.1C charge process have been binarized and the net volume expansion can be obtained through data subtraction. The 3D demonstration of the net volume expansion is shown in Fig. S3 in the ESI† and the value is calculated to be 4.58 × 107 μm3. According to the reaction volume change of the In/InLi anode proposed by Koerver et al.,34 which is Δv ≈ 11.8 × 1012 μm3 mol−1, the value of the expanded volume change calculated from the electrochemical characterization is (I × t/F)Δv = 6.8 × 107 μm3 (I is the charge current, t is the charge time, and F is the Faraday constant). The same order of magnitude of the volume expansion calculated morphologically and electrochemically during the charge process in the 0.1C cycle indicates that almost all of the transferred Li has been alloyed with In instead of undergoing side reactions with LSPS.17
The currently observed interfacial cavity/void formation during battery cycling (last four panels in Fig. 3C and D) induced by the electrode volume changes and the rigid nature of the solid electrode and electrolyte can be regarded as direct evidence for the mechanistic deterioration/degradation of the interface, as is schematically shown in Fig. 4. Due to the physical disconnection between the SE and the anode, it can be reasonably inferred that the partially disconnected anode will become electrochemically inactive, which is probably another reason for the scarcely observed transformation of the InLi peak in Fig. 3A during the discharge process. Furthermore, the mechanistic deterioration of the interface will inevitably result in dramatic charge transfer resistance, directly giving rise to the experimentally observed internal resistance increase.7 To conclude, the currently observed mechanistic deterioration/degradation of the interface would undoubtedly contribute to the overall electrochemical performance decay.
 | ||
| Fig. 4 Schematic illustration of the observed morphological evolution of the interface of InLi anode|sulfide-solid-electrolyte during battery cycling. From left to right: the uncycled pristine state; the 1 and 0.5C cycled state showing the volume expansion of the anode; the 0.25C cycled state showing further developed changes; the 0.1C cycled state showing significant interfacial degradation. | ||
Combining the in situ and in operando synchrotron X-ray tomography and energy dispersive diffraction results with the electrochemical characterization, a direct visualization of the morphological and compositional evolution of the interface of InLi-anode|thio-LISION electrolyte in the ASSLSB has been obtained. The compelling experimental evidence of interfacial degradation has been clearly observed. The principal conclusions that can be drawn from the current investigation are discussed below.
First, the current investigation highlights the importance of preserving intimate contact during ASSLSB operation to maintain its electrochemical performance. Electrochemical reactions in ASSBs occur through the solid–solid interface between the electrode and SE materials, which is different from that in conventional LIBs with liquid electrolytes.35 It has been generally acknowledged in the battery community that the formation of intimate contact at the solid electrode|electrolyte interface is the key to improving the electrochemical performance of ASSBs because charge-transfer reactions occur only at the contacted interfaces.36 The current findings of interfacial degradation during cycling (last four panels of Fig. 3C and D) further suggest that the maintenance of good interfacial contact during ASSB operation is equally crucial to its establishment during ASSB assembly. Unfortunately, tremendous efforts have been concentrated on building intimate interface contact during ASSB assembly by surface modification/buffer layer insertion, while insufficient studies have been devoted to investigating its sustainability upon battery cycling. It is suggested that more and more future work should concentrate on improving the interfacial stability during ASSB operation.
Furthermore, investigating the (electro)chemically induced volume change and its effect on the mechanical integrity of the electrode|electrolyte interface is also of importance. For most electrode materials, varying degrees of volume change are inevitable during their delithiation/lithiation.34 Unlike conventional LIBs which use liquid electrolytes where the volume change can be cushioned/adsorbed by the free liquid electrolyte, a significant amount of stress/strain would be generated in their ASSB counterparts due to their rigidity. The favorable malleability and the ductility of sulfide SEs have been considered as advantageous merits because they guarantee easier and simpler ASSB assembly.37 However, the present investigation challenges this hypothesis by pointing out that a sufficient electrode volume change from the anode side in high-capacity ASSBs may easily deform the soft sulfide SEs (see the deformation in Fig. 3C and D) and jeopardize battery safety. Thus, a rethinking of the roles played by sulfide SEs is necessary and it can be concluded that the design of ASSBs requires consideration of other factors that are different from their liquid electrolyte LIB counterparts.
Last but not least, the current report emphasizes the importance of correlating the interior battery components' evolution with the overall battery's electrochemical performance. Tremendous efforts have been concentrated on designing/engineering interfaces in ASSBs to improve their performance.38 However, electrochemical evaluations can only give indirect and unspecific insights for performance improvement. From the current report, it can be noted that the morphological and compositional evolution of electrode components that occurs simultaneously during electrochemical cycling and also straightforwardly governs the overall performance cannot be represented using the voltage profiles (see the XRD panel, electrochemical panel and the morphological panels in Fig. 3). This also applies to the (quasi)solid glass-polymer and/or ceramic-polymer electrolyte materials, which are considered as promising (quasi)solid electrolytes for next-generation ASSBs.39 It is thus concluded from the current report that sufficient attention has to be paid to their structural/morphological evolution when new strategies are proposed.
In a word, research on ASSBs is still in the very early stages even though steady progress in the improvement of Li ion conductivity in SEs has resulted in record high conductivity which rivals the conductivity of organic liquid electrolytes. It has been generally acknowledged that when the ohmic resistance of ASSBs has been alleviated dramatically by the high ionic conductivity of SEs, the interfacial problems originating from the solid–solid interface between the solid electrodes and SE become significantly pronounced.40 A fundamental understanding of the phenomena occurring at the solid–solid electrode|electrolyte interface during cell cycling is thus critical for future progress in cell performance improvement and may determine their final commercial viability.
Methods
Materials
Lithium and carbon black were purchased from MTI Corp., USA. The Li10SnP2S12 (LSPS) solid electrolyte was purchased from NEI Corporation. The XRD pattern and the ionic conductivity of the LSPS solid electrolyte used are shown in Fig. S4 in the ESI.† Indium foil and Li2S were purchased from Sigma Aldrich. The housing of the customized electrochemical beamline battery is made of polyamide-imide (Torlon) provided by Drake Plastics Europe. A polyimide tube of 3 mm diameter was purchased from DETAKTA GmbH, Germany.Preparation of the all-solid-state Li–S battery
The composite positive electrode powder was obtained by mixing Li2S, LSPS and carbon black in a weight ratio of 3.5:4:2.5 using a mortar. The mixed composite (0.4 mg) was placed first in a polyimide tube (diameter 3 mm), followed by the LSPS SE (5.9 mg), indium foil (10.6 mg) and lithium foil (1.5 mg). Afterwards, a pressure of ∼370 MPa was applied to form a pellet. After releasing the pressure, the obtained pellet was sandwiched by two stainless-steel screws during cell assembly. The cell was properly sealed off before taking it out of an inert argon atmosphere filled glovebox. Before measurement, the cell was placed in an oven at 60 °C for 12 hours to facilitate the formation of the InLi alloy.
Beamline set-ups and in situ measurement
The white synchrotron beam generated by the 7T-Wiggler at the EDDI beamline, BESSY II, Berlin, used in the current study has energies from 6 to 120 KeV. The detector system comprises a 200 μm thick LuAG:Ce scintillator, a Schneider Optics macro lens with a magnification factor of ∼4.4, a PCO DIMAX high speed camera (2016 × 2016 pixels) equipped with a CMOS chip that is kept out of the direct beam by using a mirror (white beam optic). The maximum field of view is 4 × 4 mm2 (length × height).The battery is mounted on a rotating table using a small screw on top of the electrode screw. The cell was remotely controlled using a potentiostat within the beamline hutch and it was kept electrochemical cycling at 1C, 0.5C, 0.25C and 0.1C through the complete characterization process. During electrochemical cycling, the cell was kept at 70 °C. Every 15 minutes, one synchrotron X-ray tomography and energy dispersive diffraction measurement was taken simultaneously during the 180° rotation of the cell. Each complete measurement took around 90 seconds. The achieved pixel size was ∼2.5 μm. The schematic illustration of the characterization methods at the EDDI beamline is briefly described in Fig. 1.
Data reconstruction and analysis
The raw tomography data from EDDI was processed using in-house reconstruction software programmed in IDL 8.2. The data were first normalized, de-noised and in some cases, filtered. Then the filtered back projection was used for the final reconstruction. 3D renderings shown in Fig. S2 and S3 in the ESI† were generated using VGStudio MAX 3.0.During the XRD measurement, the energies (λ) were measured while the angle θ was fixed. The acquired spectra were corrected by subtracting the spectrum of the un-cycled pristine cell to depict the changes occurring during cycling. During the XRD data analysis, the d-values can be calculated according to Bragg's law. The XRD characterization result of LSPS from a previous report41 is shown in ESI Fig. S4A† for comparison.
Conflicts of interest
The authors declare no competing financial interest.Acknowledgements
We thank engineer Norbert Beck and John Schneider for fabricating the beamline battery. This work is sponsored by the China Scholarship Council, the German Research Foundation (DFG, Project No. MA 5039/4-1) and the Bundesministerium für Bildung und Forschung (BMBF, grant no. 03XP0115C, Liszuba).References
- C. Sun, J. Liu, Y. Gong, D. P. Wilkinson and J. Zhang, Nano Energy, 2017, 33, 363–386 CrossRef CAS.
- A. Manthiram, X. Yu and S. Wang, Nat. Rev. Mater., 2017, 2, 16103 CrossRef CAS.
- K. Kerman, A. Luntz, V. Viswanathan, Y.-M. Chiang and Z. Chen, J. Electrochem. Soc., 2017, 164, A1731–A1744 CrossRef CAS.
- J. Y. Seok, O. D. Yang, N. Y. Jin and P. K. Ho, Isr. J. Chem., 2015, 55, 472–485 CrossRef.
- P.-H. Chien, X. Feng, M. Tang, J. T. Rosenberg, S. O'Neill, J. Zheng, S. C. Grant and Y.-Y. Hu, J. Phys. Chem. Lett., 2018, 9, 1990–1998 CrossRef CAS PubMed.
- W. Zhang, D. Schroder, T. Arlt, I. Manke, R. Koerver, R. Pinedo, D. A. Weber, J. Sann, W. G. Zeier and J. Janek, J. Mater. Chem. A, 2017, 5, 9929–9936 RSC.
- W. Zhang, D. A. Weber, H. Weigand, T. Arlt, I. Manke, D. Schröder, R. Koerver, T. Leichtweiss, P. Hartmann, W. G. Zeier and J. Janek, ACS Appl. Mater. Interfaces, 2017, 9, 17835–17845 CrossRef CAS PubMed.
- C. Hansel, S. Afyon and J. L. M. Rupp, Nanoscale, 2016, 8, 18412–18420 RSC.
- F. Yonemoto, A. Nishimura, M. Motoyama, N. Tsuchimine, S. Kobayashi and Y. Iriyama, J. Power Sources, 2017, 343, 207–215 CrossRef CAS.
- A. Brazier, L. Dupont, L. Dantras-Laffont, N. Kuwata, J. Kawamura and J. M. Tarascon, Chem. Mater., 2008, 20, 2352–2359 CrossRef CAS.
- Z. Wang, D. Santhanagopalan, W. Zhang, F. Wang, H. L. Xin, K. He, J. Li, N. Dudney and Y. S. Meng, Nano Lett., 2016, 16, 3760–3767 CrossRef CAS PubMed.
- S. Wang, H. Xu, W. Li, A. Dolocan and A. Manthiram, J. Am. Chem. Soc., 2018, 140, 250–257 CrossRef CAS PubMed.
- R. Koerver, F. Walther, I. Aygun, J. Sann, C. Dietrich, W. G. Zeier and J. Janek, J. Mater. Chem. A, 2017, 5, 22750–22760 RSC.
- E. J. Cheng, A. Sharafi and J. Sakamoto, Electrochim. Acta, 2017, 223, 85–91 CrossRef CAS.
- Y. Kazuo, I. Yasutoshi, A. Toru, H. Tsukasa, F. Hideki, C. A. J. Fisher, N. Katsumasa, S. Yuji and O. Zempachi, Angew. Chem., Int. Ed., 2010, 49, 4414–4417 CrossRef PubMed.
- F. Sun, H. Markötter, D. Zhou, S. S. S. Alrwashdeh, A. Hilger, N. Kardjilov, I. Manke and J. Banhart, ChemSusChem, 2016, 9, 946–950 CrossRef CAS PubMed.
- I. Tarhouchi, V. Viallet, P. Vinatier and M. Ménétrier, Solid State Ionics, 2016, 296, 18–25 CrossRef CAS.
- N. Kamaya, K. Homma, Y. Yamakawa, M. Hirayama, R. Kanno, M. Yonemura, T. Kamiyama, Y. Kato, S. Hama, K. Kawamoto and A. Mitsui, Nat. Mater., 2011, 10, 682 CrossRef CAS PubMed.
- F. Sun, M. Osenberg, K. Dong, D. Zhou, A. Hilger, C. J. Jafta, S. Risse, Y. Lu, H. Markötter and I. Manke, ACS Energy Lett., 2018, 3, 356–365 CrossRef CAS.
- F. Sun, R. Moroni, K. Dong, H. Markötter, D. Zhou, A. Hilger, L. Zielke, R. Zengerle, S. Thiele, J. Banhart and I. Manke, ACS Energy Lett., 2017, 2, 94–104 CrossRef CAS.
- F. Sun, L. Zielke, H. Markötter, A. Hilger, D. Zhou, R. Moroni, R. Zengerle, S. Thiele, J. Banhart and I. Manke, ACS Nano, 2016, 10, 7990–7997 CrossRef CAS PubMed.
- F. Sun, H. Markötter, K. Dong, I. Manke, A. Hilger, N. Kardjilov and J. Banhart, J. Power Sources, 2016, 321, 174–184 CrossRef CAS.
- F. Sun, H. Markötter, I. Manke, A. Hilger, N. Kardjilov and J. Banhart, ACS Appl. Mater. Interfaces, 2016, 8, 7156–7164 CrossRef CAS PubMed.
- L. Zielke, F. Sun, H. Markötter, A. Hilger, R. Moroni, R. Zengerle, S. Thiele, J. Banhart and I. Manke, ChemElectroChem, 2016, 3, 1170–1177 CrossRef CAS.
- M. Nagao, A. Hayashi, M. Tatsumisago, T. Ichinose, T. Ozaki, Y. Togawa and S. Mori, J. Power Sources, 2015, 274, 471–476 CrossRef CAS.
- T. Takeuchi, H. Kageyama, K. Nakanishi, M. Tabuchi, H. Sakaebe, T. Ohta, H. Senoh, T. Sakai and K. Tatsumi, J. Electrochem. Soc., 2010, 157, A1196–A1201 CrossRef CAS.
- K. Dong, S. Wang and J. Yu, RSC Adv., 2014, 4, 47517–47520 RSC.
- H. Takashi, H. Akitoshi and T. Masahiro, Adv. Sustainable Syst., 2017, 1, 1700017 CrossRef.
- H. Nagata and Y. Chikusa, J. Power Sources, 2016, 329, 268–272 CrossRef CAS.
- F. García-Moreno, C. Jiménez, P. H. Kamm, M. Klaus, G. Wagener, J. Banhart and C. Genzel, J. Synchrotron Radiat., 2013, 20, 809–810 CrossRef PubMed.
- F. Garcia-Moreno, P. H. Kamm, T. R. Neu and J. Banhart, J. Synchrotron Radiat., 2018, 25, 1505 CrossRef CAS PubMed.
- T. S. Huang and J. O. Brittain, Mater. Sci. Eng., 1987, 93, 83–92 CrossRef CAS.
- W. A. Alexander, L. D. Calvert, R. H. Gamble and K. Schinzel, Can. J. Chem., 1976, 54, 1052–1060 CrossRef CAS.
- R. Koerver, W. Zhang, L. de Biasi, S. Schweidler, A. O. Kondrakov, S. Kolling, T. Brezesinski, P. Hartmann, W. G. Zeier and J. Janek, Energy Environ. Sci., 2018, 11, 2142 RSC.
- S. Kinoshita, K. Okuda, N. Machida, M. Naito and T. Sigematsu, Solid State Ionics, 2014, 256, 97–102 CrossRef CAS.
- C. Yu, S. Ganapathy, N. J. J. de Klerk, I. Roslon, E. R. H. van Eck, A. P. M. Kentgens and M. Wagemaker, J. Am. Chem. Soc., 2016, 138, 11192–11201 CrossRef CAS PubMed.
- T. W. Kim, K. H. Park, Y. E. Choi, J. Y. Lee and Y. S. Jung, J. Mater. Chem. A, 2018, 6, 840–844 RSC.
- M. Keller, A. Varzi and S. Passerini, J. Power Sources, 2018, 392, 206–225 CrossRef CAS.
- S. Xin, Y. You, S. Wang, H.-C. Gao, Y.-X. Yin and Y.-G. Guo, ACS Energy Lett., 2017, 2, 1385–1394 CrossRef CAS.
- K. Takada, T. Ohno, N. Ohta, T. Ohnishi and Y. Tanaka, ACS Energy Lett., 2018, 3, 98–103 CrossRef CAS.
- P. Bron, S. Johansson, K. Zick, J. Schmedt auf der Günne, S. Dehnen and B. Roling, J. Am. Chem. Soc., 2013, 135, 15694–15697 CrossRef CAS PubMed.
Footnotes |
| † Electronic supplementary information (ESI) available. See DOI: 10.1039/c8ta08821g |
| ‡ F. S and K. D. contributed equally to this work. |
| This journal is © The Royal Society of Chemistry 2018 |