 Open Access Article
Creative Commons Attribution 3.0 Unported Licence
A high conductivity ultrathin anion-exchange membrane with 500+ h alkali stability for use in alkaline membrane fuel cells that can achieve 2 W cm−2 at 80 °C†
Lianqin
Wang
 *a,
Marco
Bellini
b,
Hamish A.
Miller
 b and
John R.
Varcoe
 a
a
aDepartment of Chemistry, The University of Surrey, Guildford, Surrey GU2 7XH, UK. E-mail: lianqin.wang@surrey.ac.uk
bIstituto di Chimica Dei Composti OrganoMetallici, CNR-ICCOM, Polo Scientifico Area CNR, Via Madonna del Piano 10, Sesto Fiorentino, Italy
First published on 16th July 2018
Abstract
This article describes the development of a sub-30 μm thick LDPE-based radiation-grafted anion-exchange membrane (RG-AEM) with high performance characteristics when fully hydrated. This RG-AEM had a OH− anion conductivity of 200 mS cm−1 (80 °C in 100% relative humidity (RH) environments), which led to a H2/O2 anion-exchange membrane fuel cell (AEMFC) performance of 2.0 W cm−2 (80 °C, RH = 92% environments, a PtRu/C anode, and a Pt/C cathode) and a H2/air (CO2-free) AEMFC peak power density of 850 mW cm−2 with a (non-platinum-group) Ag/C cathode electrocatalyst. When hydrated in a RH = 100% N2 (CO2-free) atmosphere, the OH− form of this RG-AEM shows <7% degradation after 500 h at 80 °C, with the extent of degradation being highly similar to that when measured using three different techniques (decrease in conductivity, decrease in ammonium content as measured using Raman spectroscopy, and decrease in ion-exchange capacity).
Background and context
Anion-exchange membranes (AEMs) are polymeric membranes that typically contain covalently bound cations (e.g. quaternary ammonium cations), which can ion-exchange and/or conduct a variety of anions.1 A primary motivation for the development of conductive and alkali stable AEMs is related to the development of anion-exchange membrane fuel cells (AEMFCs),2–6 especially systems that minimise or eliminate Pt usage in electrodes.7–11 The importance of H2O is a notable topic of discussion in the recent literature, which is particularly centred around (1) the need to rapidly balance H2O contents in the various parts of an AEMFC13–15 and (2) the growing realisation that even simple quaternary ammonium groups, such as the benchmark benzyltrimethylammonium group, are reasonably stable at elevated temperatures when they are fully hydrated.16–19There is now a wide range of AEMs that have been developed.20 The AEMs developed by the groups of Jannasch,21,22 Hickner,23,24 Holdcroft,25,26 Mamlouk,27 Xu,28–31 and Zhuang32,33 are particularly noteworthy with respect to being alkali stable and/or high performance as well as having potential for scale-up synthesis/fabrication or recyclability. As with Mamlouk et al.,27,34,35 our group has focused on the study and development of radiation-grafted AEMs (RG-AEMs), which now demonstrate either high performances or high stabilities.36–38 We have recently demonstrated that the fabrication of poly(ethylene-co-tetrafluoroethylene)-(ETFE)-based RG-AEMs led to high performance AEMFCs, even when using Ag/C cathodes.39 We have also shown that using low-density polyethylene (LDPE), rather than ETFE, leads to RG-AEMs that are more mechanically robust, such that they can be routinely applied to AEMFCs that are operated at 80 °C.12
This article extends on these prior findings and reports the development of a sub-30 μm thick LDPE-based RG-AEM with high AEMFC performances at 80 °C. In the past, the synthesis of ultrathin radiation-grafted AEMs proved to be difficult due to the resulting mechanical instability. With this new AEM, we successfully achieved both aspects. An important challenge for the development of high performance AEMFCs is the area specific resistance, which can be improved by reducing the thickness of the AEM. This was the original motivation for this study. However, as we show below, an additional, important finding was that the move to an ultrathin AEM resulted in beneficial reductions in AEMFC mass-transfer losses. We hypothesise that this is due to ultra-facile H2O transport from the anode to the cathode, through the AEM, despite this H2O transport being in the opposite direction to OH− conduction.
Materials and methods
Chemicals and materials for RG-AEM synthesis
Low density polyethylene (LDPE, product code ET311115) films of 15 μm thickness were purchased from Goodfellow (UK) and were used without any pre-treatment steps (e.g. removal of additives or change of crystallinity). The vinylbenzyl chloride (VBC) monomer was supplied by Sigma-Aldrich (product code 338729, mixture of 3- and 4-isomers) and used without removal of inhibitors (initial concentrations on purchase: 50–100 ppm tert-4-butylcatechol and 700–1100 ppm nitromethane). The 1-octyl-2-pyrrolidone dispersant and aqueous trimethylamine (TMA, 45 wt%) were also purchased from Sigma-Aldrich, and toluene and propan-2-ol were of reagent grade (Fisher Scientific, UK). All chemicals were used as received, and the ultrapure water (UPW) was of 18.2 MΩ cm resistivity.Synthesis of the optimised LDPE15-AEM
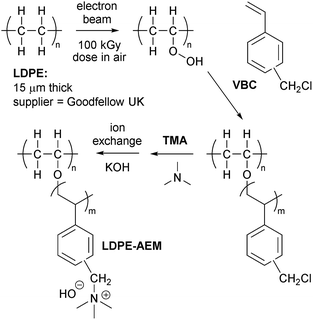
The below describes the synthesis of the RG-AEM fabricated from the 15 μm LDPE films using optimised grafting parameters (denoted from now on as LDPE15-AEM). The optimisation study (variables = grafting temperature and duration) is discussed below in the Results and discussion section (Table 1). The RG-AEM fabrication process is summarised in Scheme 1.| Grafting mixture temperature/°C | Grafting time/h | Degree of grafting (%) | IECs of the final AEMs produced/mmol g−1 |
|---|---|---|---|
| a The bold AEM = LDPE15-AEM, which was the down-selected AEM that was analysed in detail in the remainder of the article. | |||
| 30 | 18 | 110 | 2.37 ± 0.23 |
| 40 | 3 | 105 | 2.05 ± 0.25 |
| 40 | 6 | 121 | 2.54 ± 0.21 |
| 40 | 16 | 118 | 2.53 ± 0.23 |
| 50 | 4 | 97 | 1.88 ± 0.16 |
| 50 | 16 | 92 | 1.90 ± 0.11 |
| 50 | 20 | 110 | 2.26 ± 0.11 |
The LDPE films were irradiated in air to an absorbed dose of 100 kGy using a 4.5 MeV Dynamatron continuous electron-beam unit (Synergy Health, South Marston, UK): the dose rate was fast with the LDPE films being irradiated to an absorbed dose of 10 kGy per pass under the e-beam. As this is the peroxidation-type pre-irradiation grafting method, this process leads to the “activation” of the LDPE films by the introduction of peroxy-groups covalently bound to the LDPE polymer chains.40 Hence, the LDPE films can act as a solid-state initiator for subsequent free-radical grafting of vinyl monomers. After irradiation, the films were transported in dry ice back to the laboratory at the University of Surrey, where they were subsequently stored in a freezer at −40 °C until use: the film in this study was used within a 12 week storage time.
For the grafting step, the e-beam LDPE film (15 × 15 cm) was removed from the freezer and immersed in a glass vessel containing an aqueous mixture of VBC (5% vol) and the 1-octyl-2-pyrrolidone dispersant (1% vol). This mixture was then purged with N2 at room temperature for 2 h before being sealed to prevent any egress of O2. The grafting process was conducted by heating the vessel at 40 °C for 6 h. After grafting, the LDPE-g-poly(VBC) intermediate membrane was washed with copious amounts of toluene (to remove any un-grafted poly(VBC) homopolymer) before being dried at room temperature for 16 h. The degree of grafting (DoG) was calculated as follows:
| DoG = 100 × (mg − mi)/mi | (1) |
For the amination step, the LDPE-g-poly(VBC) intermediate membrane was submerged in an aqueous TMA solution at room temperature for 24 h. The resulting crude RG-AEM was then thoroughly washed with UPW and then heated in UPW for 1 h at 60 °C. This procedure was adopted to remove any excess TMA and remaining un-grafted (now aminated) homopolymer. The final production of the Cl− anion form of the LDPE15-AEM was assured by a final ion-exchange process, which involved immersion of the RG-AEM in aqueous NaCl (1.0 mol dm−3) for 15 h with one change of NaCl solution during this period. After a final, thorough UPW washing step (to remove any excess Na+ and Cl− ions, such that the only Cl− anions present are those that are counter balancing the +ve charges on the grafted polymer chains), the final LDPE15-AEM was stored in UPW until required (and was not allowed to dry out at any point before the below measurements and experiments were conducted).
Characterisation of the LDPE15-AEM in the Cl− anion form
The LDPE15-AEM (in the Cl− anion form) was characterised for ion-exchange capacity (IEC, mmol Cl− anions per g of dry AEM) gravimetric water uptake (WU, %), through-plane swelling (TPS, %), and Cl− conductivity (σ/mS cm−1, immersed in UPW, 4-probe) by Raman spectro-microscopy, and tensile stress–strain testing using extensively reported routine methods: we did not deviate from the methods published in ref. 12.Determining the OH− conductivity of the LDPE15-AEM
The conductivity (σ/mS cm−1) of the LDPE15-AEM in the OH− anion form was determined at various temperatures up to 80 °C in relative humidity RH = 100% N2 atmospheres. We used a method that was a minor adaptation of the method recently reported by Ziv and Dekel.41LDPE15-AEM samples were submerged in aqueous KOH (1.0 mol dm−3) solution at room temperature for 1 h, before being thoroughly washed with UPW to remove excess KOH species. As this process was not conducted in a CO2-free environment, the anions in the samples would be an indeterminate mixture of OH−, HCO3−, and CO32− anion forms. The samples of the LDPE15-AEM (in the mixed anion form) were then transferred into a BekkTech BT-112 conductivity cell containing 2 outer Pt-mesh electrodes (for current flow) and 2 inner Pt-wire voltage sensing electrodes. The BT-112 cell was then fitted into a Fuel Cell Technologies fuel cell fixture (supplied by Scribner Associates, USA) between two graphite flow fields (serpentine flow-pattern, 5 cm2). This entire assembly was then connected to a Scribner 850C fuel cell test station and supplied with 500 cm3 min−1 humidified (RH = 100%) high purity N2 gas.
The OH− forms of the LDPE15-AEM samples were in situ generated by passing a 0.1 mA d.c. current between the outer Pt-mesh electrodes (initially at 25 °C for 24 h) as per the method by Ziv and Dekel.41 These were time consuming experiments as each sample was held at each temperature (25 → 40 → 60 → 80 °C) for 24 h, with the d.c. current flowing, before the resistances were determined via electrochemical a.c. impedance spectroscopy (EIS) using a Solartron 1260/1287 electrochemical set-up controlled with ZPlot software (Scribner Associates, USA). EIS spectra were collected by applying an a.c. voltage (frequency range 0.3 Hz to 100 kHz, 10 mV amplitude) between the 2 inner Pt-wire electrodes and recording the a.c. current response between the outer Pt-mesh electrodes. Ionic resistances (Rs) were extracted from the low frequency x-axis intercepts in the collected EIS spectra. The OH− conductivity for each sample of the LDPE15-AEM (n = 3 samples were tested) was calculated using:
| σ = l/(R × w × t) | (2) |
500 h alkali stability test (80 °C, RH = 100% N2 atmosphere)
After the final 80 °C data point was recorded during the OH− conductivity testing of the final LDPE15-AEM sample (defined as 0 h in this study), the sample was retained inside the conductivity test assembly at 80 °C (RH = 100% N2 500 cm3 min−1 gas flow) for 500 h with the 0.1 mA d.c. current flowing and with periodic EIS measurements to record the changes in R (and hence σ) with time. The change in σ between the start and end of the 500 h test was quantitatively compared to the change in IEC and the change in Raman spectral data (discussed in detail later).AEMFC membrane electrode assembly (MEA) preparation
The catalysed gas diffusion electrode (GDE) method was used for fabricating the AEMFC electrodes. Prior to formulation of the electrocatalyst ink, a previously synthesised ETFE-based RG anion-exchange ionomer (AEI) powder, containing benzyltrimethylammonium functional groups with an IEC = 1.26 ± 0.06 mmol g−1, was ground with a pestle and mortar for 10 min.42 This was the AEI powder used in previous studies12,37,39 and was synthesised via the radiation-grafting of VBC onto an ETFE powder (Fluon Z8820X, supplied by AGC Europe) with subsequent amination using TMA. For the anode GDEs, PtRu/C (Alfa Aesar, Johnson Matthey HiSpec 12100, 50 wt% Pt and 25 wt% Ru) and AEI powder (20 wt% of the total solid mass) were mixed together with 1 cm3 water and 9 cm3 propan-2-ol. This cathode catalyst ink was homogenised with ultrasound for 30 min, sprayed onto a Toray TGP-H-60 carbon paper gas diffusion substrate (Alfa Aesar, PTFE-treated), and then dried in air. For the cathode GDEs, either Pt/C (Alfa Aesar, Johnson Matthey HiSpec 4000, 40wt% Pt), Ag/C (BASF Fuel Cell, 40 wt% Ag on Vulcan XC-72), or FeCoPc/C (the catalyst denoted as FePc–CoPc/C (600) in ref. 43) was used alongside the AEI powder (20 wt% of the total solid mass). The geometric surface area of all GDEs was 5.0 cm2, while the Pt loading for all Pt-based anodes and cathodes was 0.40 ± 0.02 mgPt cm−2 (geometric). The optimised metal loadings for the non-Pt cathodes are discussed in the Results and discussion section.All AEI-containing electrodes and RG-AEMs were immersed in aqueous KOH solution (1 mol dm−3) for 1 h and then thoroughly washed with water (to remove all excess KOH ions) before assembly between two graphite bipolar flow field plates using 5 N m torque (Fuel Cell Technologies fuel cell fixture supplied by Scribner Associates (USA), serpentine flow-pattern, 5 cm2). Each MEA consisted of an anode, a cathode and a RG-AEM. No prior hot-pressing of the MEA was used: the lamination of the electrodes to the RG-AEM occurs in situ.
AEMFC testing procedures
An 850E fuel cell test station (Scribner Associates, USA) was used for testing. The fuel cell temperature was controlled at 80 °C. The H2 and O2 gas feeds were supplied to the anode and cathode, respectively, with flow rates of 1 SLPM and with no back-pressurisation (it was estimated that there was 0.2 bar pressure drop across each flow field): both gas feeds contained ca. 10 ppm CO2 by the time they had been piped to the fuel cell testers. Testing was also conducted with a 1 SLPM purified air (<1 ppm CO2) gas supply to the cathode. The dew-points for the anode and cathode gas supplies were 78 °C and 78 °C, respectively (calculated RH = 92%). The MEAs were activated by discharging the cell at a constant voltage of 0.5 V during cell heating, until a cell temperature of 80 °C was obtained, followed by retention of this cell voltage until a steady current density was observed. Initial AEMFC performance data were collected with galvanostatic discharge steps where data (at each current density) were only recorded once the potentials had stabilised. The internal ohmic resistances were estimated using the internal current interrupt method of the fuel cell tester.Results and discussion
RG-AEM characterisation
As discussed above, we recently developed peroxidated radiation-grafted anion-exchange membranes based on LDPE that combined high conductivity with mechanical robustness at higher temperatures.12 However, the dry thickness of this prior developed RG-AEM (made from 25 μm thick LDPE precursor films, designated from now on as LDPE25-AEM) was 45 μm, which risks less than optimal H2O transport from the anode (where H2O is generated) to the cathode (where H2O is electrochemically consumed). This was the principal rationale for the development of a thinner LDPE15-AEM (described in detail below).An outline of the synthesis of the LDPE15-AEM can be found in Scheme 1 (made from 15 μm LDPE that was electron-beam irradiated to an absorbed dose of 100 kGy). Table 1 shows the results of a study focused on the optimisation of the key parameters of the VBC (monomer) grafting step. The optimised temperature for fabricating the LDPE15-AEM was found to be 40 °C, which is lower than the 55 °C needed to fabricate the LDPE25-AEM (see Table S1†), while LDPE15-AEM synthesis required a shorter grafting time (6 h vs. the 16 h grafting time that was required to synthesise the thicker, prior-developed LDPE25-AEM). The shorter grafting time and temperature required stem from the shorter monomer diffusion distances involved when using a thinner LDPE precursor film.
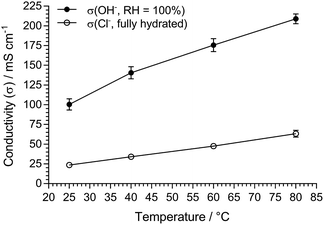
The key properties of the final optimised LDPE15-AEM are summarised in Table 2 alongside data for the LDPE25-AEM (extracted from ref. 12) that was made using the 25 μm LDPE precursor film (also using electron-beam irradiation to an absorbed dose of 100 kGy). Both LDPE-based RG-AEMs had IECs above the target 2.5 mmol g−1, which led to both having high anion conductivities (in both Cl− and OH− forms). For the LDPE15-AEM, both the lower IEC and higher WU (diluting the concentration of Cl− anions in the fully hydrated RG-AEM) lead to slightly reduced Cl− conductivities (Table 2 and Fig. S1 in the ESI†). As a standard, we always report the Cl− conductivity of RG-AEMs in water (fully hydrated conditions) as this is the most reliable and rapid measurement that can be conducted (that suffers from no CO2 interferences), which facilitates inter-laboratory comparisons. The Cl− conductivities (fully hydrated) and OH− conductivities (RH = 100% atmosphere) of the LDPE15-AEM are compared in Fig. 1.
| LDPE15-AEM | LDPE25-AEM | |
|---|---|---|
| a The number of water molecules per Cl− anion in the fully hydrated AEM, calculated as: λH2O = WU/(100 × 18.02 × IEC). b σ = 4-probe, in-plane ion conductivities at 80 °C in the indicated anion form and under test conditions (relative humidities, RH, where relevant, are indicated in the []). c Measured on the test set-up at the Colorado School of Mines, USA (details in ref. 12). | ||
| LDPE precursor film thickness/μm | 15 | 25 |
| Ion-exchange capacity/mmol g−1 | 2.54 ± 0.21 | 2.87 ± 0.05 |
| Water uptake (wt %) | 149 ± 16 | 104 ± 9 |
| Dehydrated thickness/μm | 22 ± 2 | 45 ± 1 |
| Fully hydrated thickness/μm | 28 ± 1 | 55 ± 1 |
| Through-plane swelling (%) | 27 ± 1 | 22 ± 2 |
| λ H2O | 32 ± 3 | 18 ± 2 |
| σ(Cl−, 80 °C in water)/mS cm−1b | 63 ± 4 | 76 ± 4 |
| σ(OH−, 80 °C)/mS cm−1b | 208 ± 6 [RH = 100%] | 145 ± 8 [RH = 95%]c |
| Ultimate tensile stress/MPa | 23 ± 6 | 29 ± 5 |
| Strain at break (%) | 71 ± 9 | 276 ± 32 |
| Young's modulus/MPa | 248 ± 31 | 386 ± 83 |
Increases in the conductivities of ion-exchange membranes, such as AEMs, generally correlate with increasing WUs until this causes such excessive swelling that the concentration of ionic charge carriers in the membranes is diluted enough to adversely affect (reduce) conductivity. However, an advantage of this class of LDPE-AEMs is that they retain relatively low dimensional swelling even at high water uptakes. Hence, even with a WU of 149%, our LDPE15-AEM achieves 208 mS cm−1 OH− conductivity at 80 °C. The ability to retain high conductivity with high water contents is vital for assisting the maximising of alkali stability of AEMs (hydrated AEMs degrade less than dehydrated AEMs).
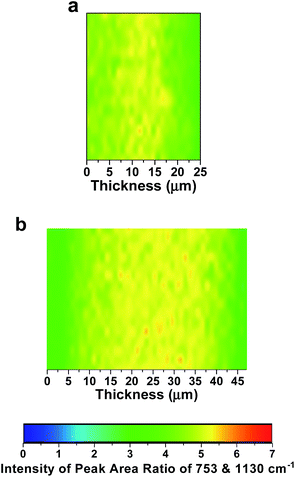
The distribution of functionality through the core (thickness/cross-section direction) of the LDPE15-AEM was investigated using Raman microscopy (Fig. 2a). The maps present the ratio of the following peak areas (ca. 1 μm spatial resolution): the integration of the 753 cm−1 peak (related to the trimethylammonium group) normalised to the integration of the 1130 cm−1 peak (related to the LDPE backbone). These data give an indication of the homogeneity of both grafting and amination through the core of the RG-AEM. The distribution of ammonium groups was observed to be relatively uniform for both the LDPE15-AEM and LDPE25-AEM (Fig. 2). The lower proportion of less grafted zones in the LDPE15-AEM (cf.LDPE25-AEM) explains the higher water contents (and hydration numbers) of the LDPE15-AEM even with the lower IEC. Despite the higher water content of the LDPE15-AEM, its dimensional swelling (TPS) remains below 30%: an ideal AEM can maintain high water contents (for high water transport ability) without excessive dimensional expansion.
Ex situ alkali stability data
The literature now commonly reports the development of AEMs that have “excellent” stability at temperatures of 60 °C or below,44 but we feel that such tests are not very helpful. Investigating the stabilities of AEMs at 80 °C (especially under controlled RH conditions rather than when submerged in water) is deemed much more meaningful. Ultimately, long-term testing needs to be conducted in situ (inside a fuel cell with high current densities).17 However, alongside the AEM itself, membrane electrode assemblies (MEAs) generally contain ionomers (ETFE-based radiation-grafted powders in this study), electrocatalysts (see later), and carbon-based catalyst supports and gas diffusion media, which can all undergo different types and rates of degradation. As this is an AEM development study, we decided to record alkali stability test data by monitoring OH− conductivities (in a 4-probe cell located inside a fuel cell test fixture) over 500 h at 80 °C when the LDPE15-AEM was exposed to a CO2-free atmosphere supplied with N2 gas flows at RH = 100% (gas flows and humidity controlled by a Scribner fuel cell test station). The OH− form of the RG-AEM was generated (and maintained as the OH− form) inside the conductivity cell following a method that was adapted from the one developed by Dekel et al. (see experimental descriptions above).41As can be seen from Fig. 3, the σ(OH−) of the LDPE15-AEM decreased from 202 mS cm−1 to 189 mS cm−1 after 500 h at 80 °C (in a RH = 100% atmosphere): this represents a retention of conductivity of 93.8% (Table 3). A linear regression of the 500 h data yields a degradation rate of 28 ± 12 μS cm−1 h−1 (this error being the confidence intervals at the 95% confidence level). The regression over 3500 h, if constant degradation is assumed, is presented visually in Fig. S2 in the ESI† as this gives a good initial estimate of retention of conductivity after several 1000 h, but clearly this needs to be verified in a future study that compares long term ex situ and in situ degradation. Taking the standard errors for the regression (both the slope and y-axis intercept) the worst-case σ(OH−) value after 3500 h of degradation is 84 mS cm−1 and in the best-case scenario it is 130 mS cm−1 (assumptions made: no catastrophic mechanical failure, pin-hole formation or disproportionate change in the H2O content).
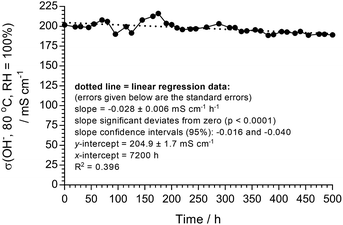 | ||
| Fig. 3 A 500 h ex situ stability test with the LDPE15-AEM in the OH− form at 80 °C in a N2 (CO2-free, RH = 100%) gas flow. A d.c. current of 0.1 mA was used to maintain the OH− form of the AEM. The extended linear regression (to 3500 h) is presented in Fig. S2 in the ESI.† | ||
| Test | Start (0 h) | End (500 h) | Retention |
|---|---|---|---|
| a The integrated area of the peak at 753 cm−1 (related to the benzyltrimethylammonium groups that are lost in all common degradation mechanisms) normalised to the area of the peak at 1130 cm−1 (derived from the LDPE based material). The before and after Raman spectra are presented in Fig. 4. | |||
| σ(OH−)/mS cm−1 | 201.9 | 189.3 | 93.8% |
| IEC/mmol g−1 | 2.54 | 2.39 | 94.1% |
| Raman spectral dataa | 3.24 | 3.04 | 93.8% |
As we have regularly preached ourselves,1 relying solely on conductivity vs. time data is not 100% reliable (as some degradation products may contribute towards conductivity), so we also measured the change in IEC and Raman data before and after this ex situ conductivity test with the following health warning: due to the small sample size and time consuming nature of the experiment (with limited access to test equipment), we could only record before and after data on a single sample of the LDPE15-AEM. As can be seen in Table 3, there was a 94.1% retention of IEC after the 500 h alkali stability test (the RG-AEM also visually maintained its toughness and flexibility). This retention of conductivity also precisely matches the quantitative change in the Raman spectra (Fig. 4) recorded before and after the 500 h alkali stability test: there was a 93.8% retention of the area of the peak at 753 cm−1 (related to the trimethylammonium groups that are lost in all common degradation mechanisms) when normalised to the area of the peak at 1130 cm−1 (derived from the LDPE based material). For additional context, there was a 94.7% retention in the area of the 753 cm−1 peak when normalised to the area of the 1610 cm−1 benzene-ring-derived peak, while there was a 98.1% retention in the area of the 1610 cm−1 peak when normalised to the area of the 1130 cm−1 peak: this suggests that the degradation of the LDPE15-AEM is primarily based on nucleophilic processes at the quaternary ammonium group (leading to loss of –N+Me3 from the benzyl grafted chains) with a only minor contribution from the loss of complete benzyltrimethylammonium moieties (as we have discussed in detail previously).36 Post-degradation, a new peak is clearly seen at 1700 cm−1, which is related to either a ketone C![[double bond, length as m-dash]](https://www.rsc.org/images/entities/char_e001.gif) O or C
O or C![[double bond, length as m-dash]](https://www.rsc.org/images/entities/char_e001.gif) C stretching;45 formation of such functional groups is related to the minor cleavage of whole benzyltrimethylammonium groups, which we know occurs in benzyltrimethylammonium-containing RG-AEMs.34,36 The morphological changes of the surface of the LDPE15-AEM (before and after the stability test in Fig. 3) are presented in Fig. S6.† The surface of the pre-degraded sample was smooth in appearance, whilst the post-degradation sample was rougher in appearance but with no evidence of critical mechanical failure (cracks nor holes).
C stretching;45 formation of such functional groups is related to the minor cleavage of whole benzyltrimethylammonium groups, which we know occurs in benzyltrimethylammonium-containing RG-AEMs.34,36 The morphological changes of the surface of the LDPE15-AEM (before and after the stability test in Fig. 3) are presented in Fig. S6.† The surface of the pre-degraded sample was smooth in appearance, whilst the post-degradation sample was rougher in appearance but with no evidence of critical mechanical failure (cracks nor holes).
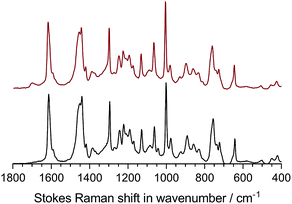 | ||
| Fig. 4 The Raman spectra (λ = 532 nm) of the LDPE15-AEM before (bottom – black) and after (top – red) the 500 h alkali stability test in Fig. 3. | ||
H2/O2 AEMFC performance data at 80 °C
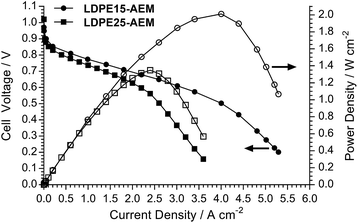
The H2/O2 AEMFC performances at 80 °C for the LDPE15-AEM and LDPE25-AEM12 are presented in Fig. 5 (MEA fabrication conditions were the same for both including the use of PtRu/C anodes and Pt/C cathodes). Moving to a thinner RG-AEM led to lower internal ohmic resistances (r = 35 mΩ cm2 at peak power density for the LDPE15-AEMcf. 49 mΩ cm2 for the LDPE25-AEM) and the ability to generate higher current densities before the onset of mass-transport limitations: the latter is hypothesised to be due to enhanced, more rapid H2O transport from the anode to the cathode.14,46 The result of this was an impressive 50% increase in peak power density (from 1.35 W cm−2 to 2.02 W cm−2), and this fully highlights the advantages of operating AEMFCs with the thinnest AEM possible (as long as this does not compromise mechanical robustness and integrity).An initial evaluation of MEAs containing select non-Pt oxygen reduction reaction (ORR) electrocatalysts was also conducted (SEM/EDX images and maps of the cathodes tested are presented in Fig. S3–S5 in the ESI†). The loadings of each catalyst in the cathode was optimised to maximise peak power density in the H2/O2 AEMFCs, and the optimal loadings are presented in Table 4. Both non-Pt cathodes could achieve peak power densities in H2/O2 AEMFCs >1 W cm−2 under our standardised test conditions (Fig. 6), despite activation losses that were larger than with Pt/C. This is especially noteworthy considering the FeCoPc/C catalyst had a metal loading <0.01 mg cm−2 (a simple extrapolation suggests 140 MW of beginning-of-life AEMFC peak power density could be achieved with a batch of catalyst containing 1 kg of the Fe + Co metal content). The ohmic area resistances were 35, 34, and 41 mΩ cm2 at peak power density for the Pt/C, Ag/C and FeCoPc/C catalysts, respectively. However, the results of 20 h in situ evaluation of the relative durabilities of each cathode catalyst (Fig. 7) showed that the stabilities of the non-Pt-catalyst-containing MEAs were poorer over short timespans than that of the benchmark Pt/C cathode when operated in AEMFCs at 80 °C (temporal history: each short-term durability test, with each MEA, was conducted directly after the respective fuel cell polarisation data were collected with both O2 and CO2-free air, Fig. 6 and 8, respectively).
| Pt/C | Ag/C | FeCoPc/C | |
|---|---|---|---|
| Metal content (wt%) | 40 | 40 | 3 |
| Catalyst loading/mg cm−2 | 1.02 | 2.16 | 0.3 |
| Metal loading/mg cm−2 | 0.40 | 0.86 | <0.01 |
| Peak power density/W cm−2 | 2.02 | 1.62 | 1.26 |
| Power at 0.6 V/W cm−2 | 1.88 | 1.16 | 0.95 |
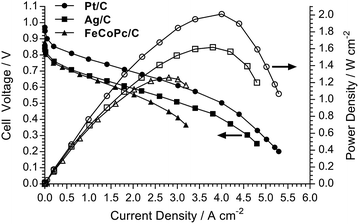 | ||
| Fig. 6 H2/O2 AEMFC performance data at 80 °C for the LDPE15-AEM with the different cathode electrocatalysts. All other test conditions were as described in Fig. 5 (including RH = 92% gas supplies). | ||
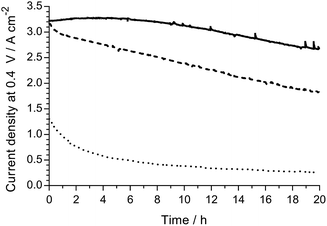 | ||
| Fig. 7 A short-term relative H2/O2 AEMFC durability comparison of the following cathodes: Pt/C (solid), Ag/C (dashed) and FeCoPc/C (dotted). These 20 h tests (at 80 °C and 0.4 V cell discharge) were conducted immediately after the polarisation curves presented in Fig. 8 below were recorded (without removal of the MEAs from the AEMFC). All other test conditions were as described in Fig. 5 (including RH = 92% gas supplies). | ||
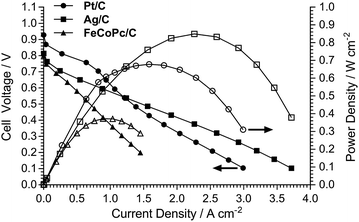 | ||
| Fig. 8 H2/air (CO2-free) AEMFC performance data at 80 °C for the LDPE15-AEM with the different cathode electrocatalysts. These H2/air (CO2-free) tests were conducted immediately after the polarisation curves presented in Fig. 6 were recorded (without removal of the MEAs from the AEMFC). All other test conditions were as described in Fig. 5 (including RH = 92% gas supplies). | ||
The data in (Fig. 8) shows the polarisation curves obtained from H2 AEMFC tests with CO2-free air supplies to the cathode (conducted directly after testing of the respective MEA in H2/O2 mode, ca. 2–4 h after initial assembly of each MEA in the fuel cell fixtures). These data show that at low current densities, the Pt/C cathode exhibited higher performances due to better electrokinetics. However, the Pt/C cathode exhibited the on-set of mass transport losses at relatively low current densities (also previously observed and discussed with the LDPE25-AEM),12 and this resulted in the Ag/C catalyst producing a superior H2/air (CO2-free) AEMFC peak power density. At this stage, this appears to be due to better diffusion of O2 in the Ag/C cathode when supplied with CO2-free air, especially when the O2 concentration in the gas feed is more depleted as it passes around the flow fields. With the H2/O2 fuel cell data (Fig. 6) we also observed that the onset of mass transport appears to be more severe with Pt/C compared to Ag/C. Again, this superiority of Ag/C (cf. Pt/C) when using CO2-free air at the cathode has been previously observed in AEMFC testing of a sub-30 μm thick ETFE-based RG-AEM.39
Conclusions
This article describes the fabrication of a new sub-30 μm thick LDPE-based radiation-grafted anion-exchange membrane (RG-AEM). This thin RG-AEM exhibited a OH− anion conductivity of 200 mS cm−1 at 80 °C in a 100% relative humidity atmosphere, which decayed by <7% over a period of 500 h. Fast H2O transport through an AEM is crucial for achieving high-performance anion-exchange membrane fuel cells (AEMFCs). We clearly demonstrate that the use of a thinner AEM, synthesised via an optimised grafting process, leads to enhanced in situ H2O transport characteristics without sacrificing mechanical strength. This led to a H2/O2 AEMFC with a peak power density of 2 W cm−2 at 80 °C (Pt/C cathode and PtRu/C anode) and 850 mW cm−2 in a H2/air (CO2-free) AEMFC containing a (non-Pt-group) Ag/C cathode. This thinner RG-AEM has performance characteristics that are now high enough to facilitate detailed investigations into the short- to medium-term AEMFC performances when operating with a variety of parameters (temperatures up to 80 °C, different electrocatalysts, and gas contaminants).Open data access
The raw data for the information presented in this CC-BY open access article (generally in Microsoft Excel formats) is freely available. Details on how to request this data can be found at http://dx.doi.org/10.15126/surreydata.6833873.Conflicts of interest
There are no conflicts to declare.Acknowledgements
The research was funded by the UK's Engineering Physical Sciences Research Council (EPSRC grant EP/M014371/1). The collaboration between the Surrey and ICCOM (CNR) teams was facilitated by funding awarded by the Royal Society's international exchange scheme (grant IES\R3\170134).References
- J. R. Varcoe, P. Atanassov, D. R. Dekel, A. M. Herring, M. A. Hickner, P. A. Kohl, A. R. Kucernak, W. E. Mustain, K. Nijmeijer, K. Scott, T. W. Xu and L. Zhuang, Energy Environ. Sci., 2014, 7, 3135–3191 RSC.
- S. Gottesfeld, D. R. Dekel, M. Page, C. Bae, Y. S. Yan, P. Zelenay and Y. S. Kim, J. Power Sources, 2018, 375, 170–184 CrossRef.
- S. Zhao, L. Yan, H. Luo, W. E. Mustain and H. Xu, Nano Energy, 2018, 47, 172–198 CrossRef.
- Z. F. Pan, L. An, T. S. Zhao and Z. K. Tang, Prog. Energy Combust. Sci., 2018, 66, 141–175 CrossRef.
- Z. J. Yang, J. Ran, B. Wu, L. Wu and T. W. Xu, Curr. Opin. Chem. Eng., 2016, 12, 22–30 CrossRef.
- D. R. Dekel, J. Power Sources, 2018, 375, 158–169 CrossRef.
- Y. X. Lu, L. Q. Wang, K. Preuss, M. Qiao, M. M. Titirici, J. Varcoe and Q. Cai, J. Power Sources, 2017, 372, 82–90 CrossRef.
- X. Peng, T. J. Omasta, J. M. Roller and W. E. Mustain, Front. Energy, 2017, 11, 299–309 CrossRef.
- B. P. Setzler, Z. B. Zhuang, J. A. Wittkopf and Y. S. Yan, Nat. Nanotechnol., 2016, 11, 1020–1025 CrossRef PubMed.
- H. A. Miller, A. Lavacchi, F. Vizza, M. Marelli, F. Di Benedetto, F. D. I. Acapito, Y. Paska, M. Page and D. R. Dekel, Angew. Chem., Int. Ed., 2016, 55, 6004–6007 CrossRef PubMed.
- S. F. Lu, J. Pan, A. B. Huang, L. Zhuang and J. T. Lu, Proc. Natl. Acad. Sci. U. S. A., 2008, 105, 20611–20614 CrossRef.
- L. Q. Wang, J. J. Brink, Y. Liu, A. M. Herring, J. Ponce-Gonzalez, D. K. Whelligan and J. R. Varcoe, Energy Environ. Sci., 2017, 10, 2154–2167 RSC.
- T. J. Omasta, L. Wang, X. Peng, C. A. Lewis, J. R. Varcoe and W. E. Mustain, J. Power Sources, 2018, 375, 205–213 CrossRef.
- T. J. Omasta, A. M. Park, J. M. LaManna, Y. F. Zhang, X. Peng, L. Q. Wang, D. L. Jacobson, J. R. Varcoe, D. S. Hussey, B. S. Pivovar and W. E. Mustain, Energy Environ. Sci., 2018, 11, 551–558 RSC.
- Y. Zheng, U. Ash, R. P. Pandey, A. G. Ozioko, J. Ponce-González, M. Handl, T. Weissbach, J. R. Varcoe, S. Holdcroft, M. W. Liberatore, R. Hiesgen and D. R. Dekel, Macromolecules, 2018, 51, 3264–3278 CrossRef.
- D. R. Dekel, M. Arnar, S. Willdorf, M. Kosa, S. Dhara and C. E. Diesendruck, Chem. Mater., 2017, 29, 4425–4431 CrossRef.
- D. R. Dekel, S. Willdorf, U. Ash, M. Amar, S. Pusara, S. Dhara, S. Srebnik and C. E. Diesendruck, J. Power Sources, 2018, 375, 351–360 CrossRef.
- K. D. Kreuer and P. Jannasch, J. Power Sources, 2018, 375, 361–366 CrossRef.
- C. E. Diesendrunk and D. R. Dekel, Curr. Opin. Electrochem., 2018 DOI:10.1016/j.coelec.2018.03.019.
- M. A. Hickner, Electrochem. Soc. Interface, 2018, 26, 69–73 CrossRef.
- H. S. Dang and P. Jannasch, J. Mater. Chem. A, 2016, 4, 11924–11938 RSC.
- J. S. Olsson, T. H. Pham and P. Jannasch, Macromolecules, 2017, 50, 2784–2793 CrossRef.
- J. Pan, L. Zhu, J. J. Han and M. A. Hickner, Chem. Mater., 2015, 27, 6689–6698 CrossRef.
- J. Pan, J. J. Han, L. Zhu and M. A. Hickner, Chem. Mater., 2017, 29, 5321–5330 CrossRef.
- A. G. Wright, J. T. Fan, B. Britton, T. Weissbach, H. F. Lee, E. A. Kitching, T. J. Peckham and S. Holdcroft, Energy Environ. Sci., 2016, 9, 2130–2142 RSC.
- A. G. Wright and S. Holdcroft, ACS Macro Lett., 2014, 3, 444–447 CrossRef.
- M. Mamlouk, J. A. Horsfall, C. Williams and K. Scott, Int. J. Hydrogen Energy, 2012, 37, 11912–11920 CrossRef.
- J. Q. Hou, Y. Z. Liu, Q. Q. Ge, Z. J. Yang, L. Wu and T. W. Xu, J. Power Sources, 2018, 375, 404–411 CrossRef.
- Q. Q. Ge, Y. Z. Liu, Z. J. Yang, B. Wu, M. Hu, X. H. Liu, J. Q. Hou and T. W. Xu, Chem. Commun., 2016, 52, 10141–10143 RSC.
- Z. J. Yang, R. Guo, R. Malpass-Evans, M. Carta, N. B. McKeown, M. D. Guiver, L. Wu and T. W. Xu, Angew. Chem., Int. Ed., 2016, 55, 11499–11502 CrossRef PubMed.
- X. L. Ge, Y. B. He, M. D. Guiver, L. Wu, J. Ran, Z. J. Yang and T. W. Xu, Adv. Mater., 2016, 28, 3467–3472 CrossRef PubMed.
- J. Pan, C. Chen, Y. Li, L. Wang, L. S. Tan, G. W. Li, X. Tang, L. Xiao, J. T. Lu and L. Zhuang, Energy Environ. Sci., 2014, 7, 354–360 RSC.
- C. Chen, J. Pan, J. J. Han, Y. Wang, L. Zhu, M. A. Hickner and L. Zhuang, J. Mater. Chem. A, 2016, 4, 4071–4081 RSC.
- R. Espiritu, B. T. Golding, K. Scott and M. Mamlouk, J. Mater. Chem. A, 2017, 5, 1248–1267 RSC.
- M. Mamlouk and K. Scott, J. Power Sources, 2012, 211, 140–146 CrossRef.
- J. Ponce-Gonzalez, I. Ouachan, J. R. Varcoe and D. K. Whelligan, J. Mater. Chem. A, 2018, 6, 823–827 RSC.
- L. Q. Wang, E. Magliocca, E. L. Cunningham, W. E. Mustain, S. D. Poynton, R. Escudero-Cid, M. M. Nasef, J. Ponce-González, R. Bance-Soualhi, R. C. T. Slade, D. K. Whelligan and J. R. Varcoe, Green Chem., 2017, 19, 831–843 RSC.
- J. Ponce-Gonzalez, D. K. Whelligan, L. Q. Wang, R. Bance-Soualhi, Y. Wang, Y. Q. Peng, H. Q. Peng, D. C. Apperley, H. N. Sarode, T. P. Pandey, A. G. Divekar, S. Seifert, A. M. Herring, L. Zhuang and J. R. Varcoe, Energy Environ. Sci., 2016, 9, 3724–3735 RSC.
- L. Q. Wang, J. J. Brink and J. R. Varcoe, Chem. Commun., 2017, 53, 11771–11773 RSC.
- S. A. Gursel, L. Gubler, B. Gupta and G. G. Scherer, Adv. Polym. Sci., 2008, 215, 157–217 Search PubMed.
- N. Ziv and D. R. Dekel, Electrochem. Commun., 2018, 88, 109–113 CrossRef.
- S. D. Poynton, R. C. T. Slade, T. J. Omasta, W. E. Mustain, R. Escudero-Cid, P. Ocon and J. R. Varcoe, J. Mater. Chem. A, 2014, 2, 5124–5130 RSC.
- V. Bambagioni, C. Bianchini, J. Filippi, A. Lavacchi, W. Oberhauser, A. Marchionni, S. Moneti, F. Vizza, R. Psaro, V. Dal Santo, A. Gallo, S. Recchia and L. Sordelli, J. Power Sources, 2011, 196, 2519–2529 CrossRef.
- R. Espiritu, B. T. Golding, K. Scott and M. Mamlouk, J. Power Sources, 2018, 375, 373–386 CrossRef.
- P. J. Larkin, Infrared and Raman Spectroscopy: Principles and Spectral Interpretation, Elsevier, 2011 Search PubMed.
- H. S. Shiau, I. V. Zenyuk and A. Z. Weber, J. Electrochem. Soc., 2017, 164, E3583–E3591 CrossRef.
Footnote |
| † Electronic supplementary information (ESI) available: Additional conductivity and SEM data. See DOI: 10.1039/c8ta04783a |
| This journal is © The Royal Society of Chemistry 2018 |

