
 Open Access Article
 This Open Access Article is licensed under a Creative Commons Attribution-Non Commercial 3.0 Unported Licence
The impact of non-uniform photogeneration on mass transport in dye-sensitised solar cells†
Roger
Jiang
 * and
Gerrit
Boschloo
*
* and
Gerrit
Boschloo
*
Address Department of Chemistry, Ångström Laboratory, Uppsala University, Box 523, SE-75120, Uppsala, Sweden. E-mail: roger.jiang@protonmail.com; gerrit.boschloo@kemi.uu.se
First published on 27th April 2018
Abstract
Following the introduction of cobalt(II/III)tris(2,2′-bipyridyl)-based redox mediators, dye-sensitised solar cells (DSSCs) have greatly advanced in power conversion efficiency (PCE). However, significant limiting factors include the fast electron recombination and slow mass transport of the oxidised redox mediator ([Co(bipy)3]3+). In this work, the effect of non-uniform photogeneration on the mass transport of [Co(bipy)3]3+ through an electrolyte-infiltrated mesoporous TiO2 film was investigated. Different illumination conditions were used to control the photogeneration profile and the subsequent spatial distribution of [Co(bipy)3]3+ throughout the TiO2 film. They included parameters such as the light intensity, substrate–electrode/electrolyte–electrode (SE/EE) illumination direction, wavelength, and TiO2 photoanode thickness. Using large and small optical perturbation photocurrent transients, electron recombination kinetics with [Co(bipy)3]3+ were analysed in the time domain. Importantly, strong SE-absorption was shown to significantly contribute to the gradual depletion of [Co(bipy)3]3+ at the counter electrode, along with an increased film thickness and light intensity, resulting in excess recombination with [Co(bipy)3]3+ on the 10−2–1 s timescale. Furthermore, charge extraction current decay transients showed that a substantial amount of [Co(bipy)3]3+ can accumulate inside the TiO2 film, resulting in significant recombination at the collecting fluorine-doped tin oxide (FTO) contact on the 10−3–10−2 s timescale. The sub-linear scaling of recombination with light intensity leads to deviating trends in charge extraction and electron transport measurements. Mass transport limitations and recombination losses at the FTO can be significantly reduced by maximising light absorption from the EE-side, which can increase PCE and reduce J–V hysteresis.
1 Introduction
Dye sensitised solar cells (DSSCs) have promising potential for low cost photovoltaic energy conversion.1,2 The state of the art DSSCs have reached record power conversion efficiencies (PCE) of 12–14.3%.3–5 This recent breakthrough in DSSC efficiency followed the introduction of alternative cobalt polypyridine redox mediators,6–8 which supersede the previous standard iodide/triiodide redox system. Some significant improvements include the greatly enhanced open-circuit voltage,3,9,10 the reduced competitive light absorption from the electrolyte,7,8,11 and the reduced tendency to corrode metal components.7,12,13 However, these advantages come with the trade-offs of faster electrolytic recombination6,8,12 and up to one order of magnitude lower diffusion coefficient.8,14 Therefore, substantial effort has been made to improve the mass transport of the redox mediator, for instance, by reducing the redox mediator bulkiness,8,14 increasing the redox mediator concentration,14–17 increasing the TiO2 porosity,18–21 reducing the TiO2 film thickness,8,16,17 reducing the inter-electrode distance,11,16 heating of the electrolyte,22,23 and reducing the electrolyte viscosity.14,20 Unfortunately, such optimisation has mainly been confined to highly flammable, volatile and toxic acetonitrile-based electrolytes, which, despite yielding record efficiencies on paper, are unsurprisingly unrealistic for commercialisation. More pressingly, little progress has been made to replace the iodide/triiodide redox system for robust electrolyte DSSCs. On the other hand, high stability devices engineered with more viscous and robust electrolytes perform much worse, primarily due to mass transport limitations of the redox mediator. Thus, it is important to better understand how the devices can become mass transport limited and develop strategies to circumvent this issue. Specifically, in this work, the effect of the absorption profile across the mesoporous TiO2 photoanode is investigated with respect to mass transport. Typically, DSSCs require strongly absorbing sensitisers or thicker sensitised films, in order to maximise light harvesting. However, the light absorption profile also affects the subsequent spatial distribution of oxidised redox mediators, and in particular, within the electrolyte-infiltrated TiO2 film. Critically, this could contribute to mass transport limitations, given that redox mediator diffusion is significantly lower in the electrolyte-infiltrated TiO2 relative to the bulk electrolyte.15The aim of this work is to critically study the factors contributing to device operating limitations and to develop strategies for improving mass transport, in order to shift away from volatile acetonitrile-based electrolytes. Despite the excellent photostability of cobalt-based electrolytes,15,16,24 electrolyte solvent leakage remains a critical issue for the long-term operating stability.15,25 Thus far, there has been substantial effort to increase the stability of DSSCs, with respect to sealing the electrolyte inside the device, for instance, through the use of electrolytic gelling agents,26–28 polymer electrolytes,29–32 and ionic liquids.33–36 Unfortunately, these methods significantly reduce redox mediator diffusion and thus the device performance, especially for bulkier redox mediators. In this work, various photogeneration profiles were investigated by controlling the direction of the illumination source facing the device,37–39 the wavelength of the illumination source,40 and the TiO2 photoanode thickness. The combination of higher light intensities, strongly absorbed wavelengths and thicker films can be used to simulate more extreme cases of mass transport limitation. This can be compared to other similar DSSC devices, in terms of equivalent photocurrent density output. Overall, this work is especially relevant to the development of more stable albeit inherently mass transport limited DSSCs, which remains a substantial portion of ongoing DSSC research. Nevertheless, the understanding of operating limitations should be broadly relevant to electrolytic DSSCs.
2 Experimental
2.1 Materials and chemicals
All chemicals were purchased from Sigma Aldrich unless otherwise stated. Fluorine doped SnO2 (FTO) glass substrates (TEC15 and TEC8) were purchased from Pilkington. TiO2 paste (DSL 18NR-T and DSL 30NR-D) was purchased from Dyesol. Cobalt(II/III)tris(2,2′-bipyridyl) (denoted hereafter as [Co(bipy)3]2+/3+) with hexafluorophosphate counterions was purchased from Dyenamo. LEG4 dye (DN-F05) was purchased from Dyenamo; the full chemical name of LEG4 is 3-{6-{4-[bis(2′,4′-dibutyloxybiphenyl-4-yl)amino-]phenyl}-4,4-dihexyl-cyclopenta-[2,1-b:3,4-b′]dithiophene-2-yl}-2-cyanoacrylic acid.2.2 Device fabrication
Fluorine doped tin oxide (FTO) glass substrates were cleaned using detergent, de-ionised water and ethanol. Working electrodes were prepared with an initial TiCl4 treatment; the TEC15 FTO substrates were heated in 40 mM TiCl4 aqueous solution at 70 °C for 1.5 h, and then sintered for 30 min at 500 °C. TiO2 films were screen printed onto the substrates using Dyesol 18NR-T TiO2 paste and 5 × 5 mm (120 T) screen printing meshes, and then sintered again. A final TiCl4 treatment was repeated for 30 min, followed by sintering. Finally, the substrates were cooled down to 120 °C, immersed in dye bath solution (0.2 mM LEG4 in 1![[thin space (1/6-em)]](https://www.rsc.org/images/entities/char_2009.gif) :1 tert-butanol:acetonitrile v/v) for 16 h, and then rinsed in acetonitrile. Counter electrodes were prepared by spreading 5 mM H2PtCl6 solution onto TEC8 FTO substrates, followed by heating at 400 °C for 30 min. Respective electrodes were sandwiched together via a Surlyn thermoplastic (Meltonix 1170-25, Solaronix), using a hot-press (Heptachroma) heated to 125 °C whilst applying 0.2 bar for 60 s, resulting in a spacing between the two FTO electrodes of approximately 20 μm. Electrolyte solution was injected through a pre-drilled hole on the counter electrode, and then sealed with Surlyn and a glass coverslip. The electrolyte consisted of 0.22 M Co(bipy)3(PF6)2, 0.04 M Co(bipy)3(PF6)3, 0.1 M LiClO4 and 0.2 M 4-tert-butylpyridine (TBP) in acetonitrile (ACN). TiO2 photoanode thicknesses were measured by using a profilometer (Veeco Dektak 3). TiO2 photoanode thicknesses ranged from 6.5 to 19.5 μm ± 0.2 μm, which corresponds to the bulk electrolyte thickness ranging from 13.5 to 0.5 μm. UV-vis absorption was measured using a Varian Cary 5000 spectrometer. For UV-vis measurements, a 3.5 μm LEG4-sensitised film (18NR-T) was measured in air. Absolute irradiance spectra were measured using a UV-vis spectrometer (HR2000, Ocean Optics) fitted with a cosine corrector (CC-3-UV, Ocean Optics), which was calibrated using a reference halogen light source (DH-2000-CAL, Ocean Optics).
:1 tert-butanol:acetonitrile v/v) for 16 h, and then rinsed in acetonitrile. Counter electrodes were prepared by spreading 5 mM H2PtCl6 solution onto TEC8 FTO substrates, followed by heating at 400 °C for 30 min. Respective electrodes were sandwiched together via a Surlyn thermoplastic (Meltonix 1170-25, Solaronix), using a hot-press (Heptachroma) heated to 125 °C whilst applying 0.2 bar for 60 s, resulting in a spacing between the two FTO electrodes of approximately 20 μm. Electrolyte solution was injected through a pre-drilled hole on the counter electrode, and then sealed with Surlyn and a glass coverslip. The electrolyte consisted of 0.22 M Co(bipy)3(PF6)2, 0.04 M Co(bipy)3(PF6)3, 0.1 M LiClO4 and 0.2 M 4-tert-butylpyridine (TBP) in acetonitrile (ACN). TiO2 photoanode thicknesses were measured by using a profilometer (Veeco Dektak 3). TiO2 photoanode thicknesses ranged from 6.5 to 19.5 μm ± 0.2 μm, which corresponds to the bulk electrolyte thickness ranging from 13.5 to 0.5 μm. UV-vis absorption was measured using a Varian Cary 5000 spectrometer. For UV-vis measurements, a 3.5 μm LEG4-sensitised film (18NR-T) was measured in air. Absolute irradiance spectra were measured using a UV-vis spectrometer (HR2000, Ocean Optics) fitted with a cosine corrector (CC-3-UV, Ocean Optics), which was calibrated using a reference halogen light source (DH-2000-CAL, Ocean Optics).
In a follow-up experiment, additional 6.5 μm TiO2 films were prepared to compare the effect of different FTO blocking layers: (a) with TiCl4 pre-treatment, (b) without TiCl4 pre-treatment, and (c) with a compact TiO2 blocking layer prepared following a spray pyrolysis method.15
2.3 Device characterisation
Measurements were made under white LED (WLED) illumination (Bridgelux, BXRC-27G10K0-L-03) and maintained at 25 °C (WLED colour spectrum shown in Fig. 2a and S1b†). The illumination intensity was further concentrated by using an aspheric Fresnel lens (46-389, Edmund Optics). This enables higher light intensity from a greater distance, which minimises the amount of heat output from the LED reaching the cell. Both the LED and cell were mounted on fan-cooled heatsinks to maximise cooling. This enabled the cells to be kept at 25 °C, even under high intensity illumination. Importantly, this excludes temperature as a variable from the experiment, which can significantly affect mediator diffusion and PCE.41,42 The light intensity of the WLED was calibrated to produce the same photocurrent, using a certified reference Si cell (Fraunhofer ISE), as measured under AM 1.5 solar simulator illumination (Newport). Therefore, we can compare equivalent “sun” intensities, in terms of the photon flux density. Band-pass filters were used in conjunction with the WLED to vary the relative wavelength output (transmission spectra of filters and absolute irradiance spectrum of WLED with filters, shown in Fig. S1a† and 2a, respectively). For brevity, the relative illumination wavelengths are hereon referred to as “blue”, “green”, “white” and “red” (white refers to the unfiltered WLED source). Our setup was capable of sustaining 2 suns intensity red band-pass filtered illumination, which required an equivalent of 8.765 sun unfiltered white LED illumination. The cells were measured with a 5 × 5 mm black anodised aluminium mask.Fig. 1 illustrates the entirety of the measurement procedure used in this study. A series of large and small optical perturbations were applied to the cell, and the short circuit photocurrent response was acquired as a function of time. Photocurrent transients are simple and quick to measure; each photocurrent transient measurement was acquired within ∼10 s, and the total acquisition time for all the data presented in this study (excluding repeats) was ∼42 min. Shorter measurements have the advantage of minimising light exposure, which reduces the potential for drift or degradation, improving measurement accuracy and repeatability. In general, this method can be useful for the screening of other less photostable devices.
 | ||
| Fig. 1 Example of the data acquisition sequence. Sections of the waveform are coloured for illustrative purposes. (a) Photocurrent rise transients (red) and charge extraction transients (green) obtained by switching light on and off, respectively. (b) Small perturbation current decay transients (blue) obtained following small optical perturbations under steady-state illumination. (c) Charge extraction current decay transient and cumulative charge integral. | ||
The photocurrent transient measurements were performed under short-circuit conditions. Ultrafast solid-state switches were used to control power delivery to the LEDs and timed using a DAQ (NI-6211 and NI-6703, National Instruments). Light intensity and optical modulations were applied by using a programmable power supply (CPX400DP, Thurlby Thandar Instruments). Photocurrent rise transients (Fig. 1a, red) were obtained by measuring the photocurrent response (at short-circuit and 25 °C), following dark to illumination. Next, after 5 s of illumination, a series of small optical perturbations were applied (Fig. 1a and b, blue) as a square wave pulse (0.1 s on, 0.4 s off). The modulation pulse intensity was maintained at 5–2% of the stand-by sun intensity; greater perturbations were required at lower intensities in order to improve the signal-to-noise ratio. Finally, after 7 s, the light was switched off, whilst simultaneously measuring the photocurrent decay transient (Fig. 1a and c, green) for 1 s in the dark. The subsequent current decay transient in the dark was integrated to estimate the amount of excess charge density stored inside the TiO2 photoanode (QSC).43,44 Charge density was calculated assuming a bulk TiO2 volume ratio of 45%, and QSC units are shown as the number of electrons per cubic centimetre (e cm−3).
3 Results and discussion
3.1 Cross-sectional absorption profile
Fig. 2a shows the UV-vis absorption spectrum of a LEG4-sensitised photoanode, which exhibits a broad absorption peak around 460 nm. Table 1 lists the decadic attenuation constant (α) and the light penetration depth (δp), calculated using absorbance values from Fig. 2a, at various wavelengths. From 460 to 660 nm, δp values range from 1.8 to 34.7 μm. In comparison, high efficiency DSSCs typically have photoanode thicknesses ranging between 5 and 10 μm. Unsurprisingly, DSSCs with strongly absorbing sensitisers tend to absorb less uniformly across the photoanode. Fig. 2b illustrates the exponential attenuation of monochromatic light across the sensitised photoanode. Importantly, this affects the electron photogeneration profile which is proportional to light absorption throughout the photoanode.37,43 Additionally, the direction of illumination can be varied, with the illumination source facing either the substrate–electrode (SE) or electrolyte–electrode (EE). These parameters can be used to qualitatively control the photogeneration profile, and the subsequent spatial distribution of injected electrons in TiO2 and [Co(bipy)3]3+ in the electrolyte. This changes the average diffusion distance for the respective charge carriers, which is illustrated in Fig. 3. For instance, strong SE-absorption (i.e., SE-blue) should generate more [Co(bipy)3]3+ closer to the SE-side, which would increase the average diffusion distance of [Co(bipy)3]3+ to the counter electrode. Conversely, more uniform SE-absorption (i.e., SE-red) or strong EE-blue absorption should generate more [Co(bipy)3]3+ closer to the EE-side, which would decrease the average diffusion distance to the counter electrode. | ||
| Fig. 2 (a) UV-vis absorption spectrum of a 3.5 μm LEG4-sensitised TiO2 film measured in air. Comparison of the irradiance spectrum of light sources; comparison of WLEDs with band-pass filters. (b) Transmittance of various wavelengths through the cross section of the LEG4-sensitised TiO2 film, approximated using the Beer–Lambert law, assuming uniform attenuation. Comparison of SE/EE-illumination directions (solid/dashed lines). Photoanode thicknesses ranging from 6.5 to 19.5 μm are shown (grey lines). | ||
| λ/nm | Absorbance (A) | Attenuation constant (α)/m−1 | Penetration depth (δp)/μm |
|---|---|---|---|
| 460 | 1.94 | 5.56 × 10⁵ | 1.80 |
| 560 | 1.15 | 3.30 × 10⁵ | 3.03 |
| 660 | 0.10 | 2.88 × 10⁴ | 34.70 |
 | ||
| Fig. 3 Simplified schematic of a DSSC cross section. Coloured arrows illustrate various wavelengths and subsequent photogeneration of charge carriers. Black and purple arrows illustrate the average diffusion distance for electrons and holes, respectively. | ||
Some caveats should be noted. Firstly, band-pass filtered LED illumination was used, rather than a monochromatic source, for ease of implementation. Nevertheless, the discussion above remains relevant as the relative absorption profiles can still be compared. Secondly, a uniform photoanode was required to fairly compare SE/EE-illumination directionality. Therefore, TiO2 films were prepared as a transparent TiO2 layer. Typically, in high performance devices, an additional TiO2 scattering layer is added to increase the photocurrent.45,46 As such, the devices in this study produce less current than typically expected. Also, Fig. 2 shows that there is a substantial spectral mismatch of the WLED versus AM 1.5; the current measured using WLEDs was >20% lower when compared to AM 1.5 irradiance. To demonstrate that the findings in this study are broadly relevant to electrolytic DSSCs, a repeat set of measurements based on AM 1.5 characterised high efficiency DSSCs is included in the ESI (Fig. S10-1X†). These additional results fully replicate the trends presented in this manuscript, which shows that the lower current of the devices does not affect the conclusion. Thirdly, unlike iodide-based electrolytes, the absorption losses to the electrolyte under EE-illumination are relatively minor, given that [Co(bipy)3]2/3+ is weakly absorbing.7,8,11 The uniformity and transparency of Pt electrodes can affect transmission losses for EE-side illumination. Overall, up to an ∼10% optical transmission loss in the 300–700 nm range for the back electrode relative to the front electrode (ESI Fig. S9†) was observed. EE-illuminated devices tend to exhibit lower current when compared to SE-illumination, at lower light intensities, primarily due to the reduced optical transmittance of TEC8 glass relative to TEC15 glass. Nevertheless, it is later shown that the photocurrent is substantially higher for EE-illumination at high light intensities, where mass transport limitations may occur. Finally, the use of higher than one sun intensities and non-uniform absorption can be compared to other DSSCs with more strongly absorbing sensitisers, in terms of equivalent photocurrent density. Also, higher than one sun light intensities can be used to more easily distinguish differences in limiting current and operating limitations.
3.2 Photocurrent linearity and photocurrent turn-on transients
Deviations in the linearity of photocurrent as a function of light intensity can be used to determine the presence of current limitations.15,16,47,48Fig. 4a and b compare the steady state current (JSS) obtained after equilibrating for 5 seconds under constant illumination, for different illumination wavelengths and illumination directions. The effects of the photoanode thickness and non-uniform absorption profile are compared. Most notably, Fig. 4a and b show that stronger EE-absorption (i.e., EE-blue) results in significantly higher and more linear JSS, irrespective of increasing photoanode thickness or light intensity. Conversely, stronger SE-absorption (i.e., SE-blue) results in lower JSS, which scales linearly until ∼0.5 sun (see the vertical dashed line). Above 0.5 sun, JSS sharply decreases and then scales linearly with a reduced slope, which shows that current becomes limited with respect to light intensity. This indicates that recombination sharply increases and subsequently scales proportionally with light intensity. Comparing at 2 suns, JSS increases in the order of SE-blue, SE-green, SE-white, SE-red, EE-red, EE-white, EE-green and EE-blue. Overall, at higher intensities, JSS increases as the absorption profile is skewed to the EE-side, and absorption is minimised from the SE-side. This is consistent with current limitations resulting from the insufficient mass transport of [Co(bipy)3]3+ to the counter electrode. Moreover, this shows that current limitations significantly worsen when the [Co(bipy)3]3+ diffusion distance through the TiO2 mesopores increases. This is in agreement with rotating disc electrode voltammetry measurements of redox mediator diffusion through TiO2 films.14 Importantly, this shows that the spatial absorption profile across the photoanode significantly contributes to current limitations, and even more so than parameters such as photoanode thickness and light intensity. Finally, Fig. 4a and b show that JSS tends to scale more invariantly with respect to the wavelength (see black arrows), for thinner photoanodes under SE-illumination and thicker photoanodes under EE-illumination. These trends indicate two different underlying current limiting processes, which are examined below. | ||
| Fig. 4 (a and b) Steady-state short-circuit photocurrent (JSS) versus light intensity. Comparison of SE/EE-illumination (solid/open markers). (c–f) Short-circuit photocurrent turn-on transients, following dark to 1 sun illumination. Comparison of SE-illumination (top) and EE-illumination (bottom). Comparison of photoanode thicknesses and illumination wavelengths (blue, green, white and red illumination). Additional cells with >6.5% PCE and different TiO2 films shown in Fig. S9 and 10† have identical trends. | ||
Photocurrent turn-on transients can be used to identify current limiting processes in the time domain. Fig. 4c–f show the photocurrent transient response, following illumination from dark, under short-circuit conditions. For brevity, only 1 sun photocurrent transients are compared here. Comparing SE-illumination, Fig. 4c and d show that strong SE-absorption results in an initial peak (Jpeak), followed by a secondary Jpeak decay transient, reaching JSS after 10−2–1 s. Unlike JSS, Jpeak scales linearly with light intensity and represents the maximum extractable current prior to current limitations. Fig. 4c and d show that Jpeak increases proportionally with more strongly absorbed wavelengths, although this reaches a plateau as TiO2 film thickness increases. This shows that the devices are limited by electron injection from the dye and/or electron collection through the TiO2 film. The timescale of the subsequent Jpeak decay transients is consistent with redox mediator diffusion and has been experimentally attributed to the mass transport limitations of the redox mediator.8,14,18,19 Mass-transport limitations typically arise due to the depletion of oxidised redox mediators at the counter electrode.48 For cobalt-based DSSCs, the oxidised [Co(bipy)3]3+ mediator is usually the mass transport limiting species. The mass transport limitations of the reduced [Co(bipy)3]2+ mediator can be disregarded given the similar diffusion coefficients of [Co(bipy)3]2+ and [Co(bipy)3]3+ in acetonitrile,8,49 the significantly larger concentration of [Co(bipy)3]2+ in typical electrolytes, and the high dye regeneration efficiency of LEG4/cobalt DSSCs.50 The assertion that insufficient [Co(bipy)3]3+ mass transport leads to insufficient dye regeneration and increased electron-dye recombination18 is erroneous unless it somehow influences the diffusion of [Co(bipy)3]2+. Following the depletion of [Co(bipy)3]3+ at the counter electrode, electrons inside the TiO2 are prevented from flowing to the external circuit, due to charge conservation. This leads to increased electron-back recombination, which can occur either via [Co(bipy)3]3+ or the oxidised dye. Later on, this is shown to occur primarily at the FTO collecting contact of the working electrode. Comparing EE-illumination, Fig. 4e and f show that the photocurrent stabilises after ∼10−2 s of illumination, indicating the absence of [Co(bipy)3]3+ mass transport limitations. This is consistent with the increased photogeneration of [Co(bipy)3]3+ closer to the counter electrode, increasing the overall diffusion flux of [Co(bipy)3]3+ to the counter electrode.
Interestingly, Fig. 4e and f show that under strong EE-absorption, the initial photocurrent rise transient is biphasic, comprising two independent single exponential rises. This consists of a slow rise shoulder preceding a fast rise, which follows a sharp transition occurring between 10−3and 10−2 s (see the vertical dashed line, Fig. 4e and f). This shows that the overall collection of electrons in the external circuit is initially limited on the 10−4–10−2 s time-scale. A similar rise shoulder has been previously reported in the literature for iodide-based DSSCs,51 although the rise delay appears on the 10−4–10−3 s timescale and is far less pronounced than that of Fig. 4. The delay in current rise can be explained by the time taken for a sufficient number of electrons, injected from the EE-side, to diffuse through the TiO2 film and fill the electron trap states closer to the TiO2/FTO interface. Overall, this process limits the initial electron collection in the external circuit and is thus referred to as “tCOL”. Moreover, tCOL linearly correlates with the electron transport time constant (ttr), obtained in the subsequent measurements (ESI, Fig. S2†). Also, tCOL increases surprisingly linearly with photoanode thickness and decreases with light intensity, which is in agreement with previous observations for ttr.52 In addition, tCOL exhibits a power law dependence on light intensity (ESI, Fig. S3†), as similarly reported for ttr.53–56 These correlations may suggest that tCOL is equivalent to ttr, since both describe electron collection through the TiO2 film. Finally, it is interesting to note that the current reached at tCOL, hereon referred to as “JCOL”, linearly correlates with JSS (ESI, Fig. S4†). This suggests that JSS may be determined from the initial rise shoulder of the turn-on photocurrent rise transient.
Fig. 5 shows the J–V of an atypical DSSC with an extremely thick TiO2 film of 19.5 μm. This was intentionally used to study the effect of mass transport on the J–V characteristics. Identical trends were reproduced with thinner TiO2 performance optimised DSSCs (see ESI Fig. S12 and 13†). Counterintuitively, the performance of DSSCs with mass transport limitations can be substantially improved with EE-illumination, strongly absorbing sensitisers and thicker photoanodes. This shows that thicker films are not inherently worse for mass transport – rather that the real issue is the average distance that redox mediators need to travel through the film. Fig. 5 shows that stronger EE-absorption also leads to significantly greater PCE. At higher intensities, both JSC and VOC increase under stronger EE-absorption, which is consistent with the increased diffusion flux of [Co(bipy)3]3+ to the counter electrode and reduced electron back recombination to [Co(bipy)3]3+. Previous studies of iodide-based DSSCs have reported lower PCE under EE-illumination (relative to SE-illumination).38 Typically, this can be attributed to light absorption losses to the bulk electrolyte, since EE-illumination increases the distance that light travels through the bulk electrolyte prior to reaching the sensitised photoanode. In contrast, cobalt bipyridine-based electrolytes are significantly less absorbing and can be more suitable for operation under EE-illumination. Also, due to the presence of the Jpeak decay transients (as observed in Fig. 4c and d), the cells were initially equilibrated under short-circuit conditions and illumination, prior to scanning the J–Vs. This prevents the overestimation of JSC and is generally recommended for the measurement of cells which do not quickly stabilise to JSS. To compare hysteresis, the J–Vs were scanned cyclically, from 0 V to 1 V to −0.1 V and return. Fig. 5 shows that hysteresis increases, especially near the maximum power point, when scanning in the direction from VOC to JSC, under strong SE-absorption and higher light intensities. This leads to an overshoot in current, leading to an overestimated fill-factor and PCE. Such overshoots are not present under EE-illumination. The trends of J–V overshoot hysteresis were also observed for efficiency optimised DSSCs at higher light intensities (ESI Fig. S13†). While this issue is less pertinent for optimised ACN devices at 1 sun, it can be highly noticeable for DSSCs with more viscous electrolytes. Similar overshoots can be observed in J–Vs reported in the literature,19,57 including some that have not been commented upon.34,35,58 The effect of applied bias on the J–V hysteresis will be reported elsewhere.59
 | ||
| Fig. 5 J–V comparing an atypical 19.5 μm device (WLED) and efficiency optimised device (AM 1.5), with PCE overlaid. Hysteresis increases for strong SE-illumination and thick films. See ESI Fig. S12† for 1 sun AM 1.5 J–Vs of other efficiency optimised DSSCs. | ||
Additionally, devices with performance optimised TiO2 films were characterised under AM 1.5 solar irradiance (see ESI, Fig. S12†). A slight improvement in photocurrent was obtained when changing from DSL18NRT-based TiO2 films to bilayer TiO2 films consisting of DSL30NRD and WER2-O scattering particles. It should be noted that the TiO2 porosity is greater for films made with DSL30NRD, when compared to DSL18NRT. In addition, lower concentrations of TiCl4 post treatment were tested for the DSL30NRD-based DSSCs. Measured under AM 1.5, the improvement in 1 sun J–V performance was negligible for the different TiO2 films. Overall, the 1 sun efficiencies were similar (Fig. S12†) showing that the devices are mainly limited by light absorption and the diffusion distance through the TiO2 film, as opposed to the porosity of the TiO2 film. In later sections, photocurrent transient measurements were repeated with these higher efficiency devices and similar trends could be observed.
3.3 Short-circuit charge extraction current decay transients
Charge extraction can be used to estimate the density of excess charge carriers stored inside the TiO2 photoanode (QSC), under illumination and at short-circuit. However, this requires minimal recombination losses in order to fully extract the excess charge.43,44,60 Albeit unconventional, charge extraction can also be ideal for analysing collection kinetics. Under dark and short-circuit conditions, the excess charge relaxes predominantly via collection and recombination. Typically, the QSCversus JSS curve follows a power law,43,61 assuming that collection dominates, which appears linear on a log–log plot (hereon, power law trends are referred to as “linear”). However, sub-linear deviations can arise in the QSC curves when the collection efficiency changes as a function of light intensity. Previous work shows that non-linear QSC deviations can be caused by a reduction in the total concentration of [Co(bipy)3]3+ in the bulk electrolyte.15 By extension, the following results show that non-linear QSC deviations can also arise, for a fixed bulk electrolyte, purely as a function of the steady-state photogeneration profile.Most strikingly, Fig. 6 shows that SE/EE-illumination directionality significantly affects the QSC curve linearity. To compare linearity, a power law extrapolation was applied to the linear regions of the QSC curves, which is shown for EE-blue (dashed blue line) and SE-blue (solid blue line). Under EE-illumination, the QSC curves (open markers) tend to be linear and overlap, irrespective of the light intensity, thickness or illumination wavelength; with the exception of red illumination for which QSC is slightly lower. This shows that under EE-illumination, the steady-state electron generation profile scales invariantly, with respect to the thickness and wavelength, whilst collection efficiency remains constant. In stark contrast, SE-illumination leads to the QSC curves (solid markers) deviating from linearity above ∼0.5 sun (∼3–4 mA cm−2, vertical blue dashed line), especially at higher light intensities (blue arrows). Moreover, the magnitude and shape of the QSC curves are affected by both the thickness and the wavelength. Fig. 6a–d show that QSC shifts vertically down for stronger SE-absorption and thicker films. This is most visible when comparing SE-blue (see black arrows). Such downward shifts in QSC can indicate a shift in the conduction band edge potential or faster recombination kinetics at the TiO2/electrolyte interface.62 The former is less likely, given that an identical cell under EE-illumination results in QSC scaling invariantly, ruling out the possibility of electrolytic components significantly influencing the TiO2 surface charges. Typically, QSC would be expected to increase for thicker films, given the increased capacity of the photoanode to generate and store charge. However, thicker films and stronger SE-absorption contribute to the increased accumulation of [Co(bipy)3]3+ inside the mesoporous TiO2 film, which increases electron recombination to [Co(bipy)3]3+. Up to ∼0.5 sun, the QSC curves remain linear as recombination scales proportionally with light intensity. The vertical down shifts in QSC correspond to increased recombination losses, which scale proportionally with light intensity. However, at higher intensities, recombination scales non-linearly which results in the QSC deviating from linearity. Moreover, at higher light intensities, the QSC curve gradually changes in shape as a function of SE-absorption and thickness. This is most visible when comparing SE-blue at higher light intensities (vertical dashed blue line); sub-linear deviations at higher intensities are highlighted (blue arrows). For instance, Fig. 6a–c show that thinner cells exhibit QSC deviations which decrease below linearity, whereas Fig. 6d shows that thicker cells exhibit QSC deviating above linearity. At first glance, these trends appear to violate charge conservation; however, the former indicates excessive recombination losses, whereas the latter indicates reducing recombination losses. Compared to Fig. 4, this shows that the QSC deviations only occur when there is a current limitation. To further analyse how current limitation affects the overall collection kinetics, the raw current decay transients obtained from charge extraction measurements were analysed.
 | ||
| Fig. 6 Excess charge density extracted from short-circuit (QSC). (a–d) Increasing photoanode thickness (6.5–19.5 μm). Comparison of SE/EE-illumination directions (solid/open markers). Comparison of illumination wavelengths. | ||
Charge extraction photocurrent decay transients show the overall current collected to the external circuit, as a function of time. Under illumination and short-circuit conditions, the steady-state electron concentration profile follows an exponential distribution, as a function of light intensity.51,63 The subsequent current decay transient in the dark depends on a number of dynamically changing factors including the total electron concentration, the spatial electron concentration gradient, electron trapping and the electrolyte concentration profile. The interpretation of such transients is complicated and to the best of our knowledge has yet to be attempted. Fig. 7a shows the typical photocurrent decay transient, similarly observed in the literature,43,64,65 which can be described as comprising an initial shoulder followed by an exponential tail. Time domain analysis can be simplified by qualitatively analysing the photocurrent transients as a function of the photogeneration profile. In principle, assuming that excess recombination to [Co(bipy)3]3+ is occurring, there should be significantly increased current decay on the 10−3 s timescale, as previously observed in the turn-on photocurrent transients (Fig. 4c and d). Most notably, Fig. 7b–d show a greater current decay rate on the 10−3–10−2 s timescale, which increases with light intensity and stronger SE-absorption. No such peaks are observed under EE-illumination. Again, this increased rate of current decay in Fig. 7b–d is consistent with greater photogeneration of [Co(bipy)3]3+ inside the mesopores. Also, this shows that significant quantities of [Co(bipy)3]3+ remain inside the mesoporous TiO2, following switching to the dark. This temporarily increases electron back recombination, which decreases as [Co(bipy)3]3+ gradually diffuses out of the pores. The decay rate increases since recombination provides an additional pathway for the excess electrons to relax. As such, the initial current decay rate on the 10−4–10−3 s timescale is also faster under higher intensities and stronger SE-absorption. Moreover, Fig. 7b and c show that following the excess recombination dip, the current transient temporarily rises again. This shows that excess electrons remained inside the TiO2 and could not be fully extracted until the rate of electron recombination to [Co(bipy)3]3+ had decreased. Also, this indicates that the thicker photoanodes actually store more electrons, however, extract less charge due to greater recombination. This accounts for the upwards curve of QSC observed in Fig. 7d; despite greater overall net recombination losses, more electrons gradually accumulate inside the TiO2 at higher intensities. In addition, when the current transient reaches temporarily zero in Fig. 7b–d, the rates of recombination to [Co(bipy)3]3+ and electron collection are momentarily equal. Also, under high intensities and strong SE-absorption, the electron flow can even reverse its direction. The reversal in current can only occur when electrons are flowing back from the external circuit and into the photoanode, when the net recombination flux exceeds the collection flux. Given that there is already an excess number of electrons inside the TiO2, it is unlikely that recombination via the mesoporous TiO2 can account for net current reversal. As such, this indicates that significant quantities of [Co(bipy)3]3+ accumulate inside the mesoporous TiO2 and at the FTO interface, resulting in both recombination with electrons in TiO2 and electrons from the external circuit. To confirm that recombination occurs primarily at the FTO interface, follow-up measurements were made on similar cells comparing the effect of TiO2 blocking layers on the FTO.
 | ||
| Fig. 7 Normalised QSC photocurrent decay transients in the dark. (a) Comparison of light intensity (0.1–2 suns) for the 19.5 μm cell under SE-blue illumination. (b) Comparison of light intensity (0.1–2 suns) for the 19.5 μm cell under SE-blue illumination. (c) Comparison of illumination wavelengths and SE/EE directionality at 2 suns for the 19.5 μm cell. (d) Comparison of illumination wavelengths and SE/EE directionality at 2 suns for the 6.5 μm cell. ESI Fig. S11† shows that trends also apply to high efficiency cells. | ||
Fig. 8 compares the charge extraction current decay transients, for comparable 6.5 μm cells, albeit prepared with different TiO2 blocking layers on FTO. The blocking layer on FTO adds a compact layer of TiO2 which suppresses back-recombination of electrons via the FTO collecting contact with [Co(bipy)3]3+. Thus far, all devices were prepared using a TiCl4 treatment, which introduces a thin compact TiO2 blocking layer onto the FTO interface. The blocking effect increases in the ascending order of untreated FTO, TiCl4 treated FTO and compact TiO2 treated FTO prepared with spray pyrolysis. Fig. 8 shows that reduced FTO blocking leads to faster current decay with an increased dip at 2 ms, which indicates faster recombination. For the thickest blocking layer, significantly more charge is extracted with a longer current decay shoulder, and recombination on the 10−3 s timescale is greatly reduced. Similar to Fig. 6d, cells with blocking layers exhibit QSC,SE deviations which rise (ESI, Fig. S3†). This shows that when FTO recombination is suppressed, there is a net build-up of electrons inside the TiO2, due to [Co(bipy)3]3+ depletion at the counter electrode. Overall, Fig. 8 shows that recombination occurs primarily at the FTO contact, as opposed to the mesoporous TiO2 film. This shows that sensitisers with steric alkoxy chains, such as LEG4, are quite effective in suppressing the recombination of electrons in the mesoporous TiO2 with [Co(bipy)3]3+. Moreover, strong EE-absorption can also be effective in suppressing FTO recombination, as shown by FTO–EE in Fig. 8. This shows that FTO blocking layers are not inherently necessary for EE-illuminated cells. Finally, similar to Fig. 6d, the QSC curves of the devices with thicker TiO2 blocking layers on the FTO (ESI, Fig. S5†) tend to deviate above linearity. This shows that when electron recombination at the FTO substrate is suppressed, and the device is limited by [Co(bipy)3]3+ mass transport, and then more electrons can accumulate inside the TiO2 film, as a function of current density. In addition, this non-linear recombination process has been recently confirmed with 8.2% copper polypyridine redox mediator-based DSSCs.66
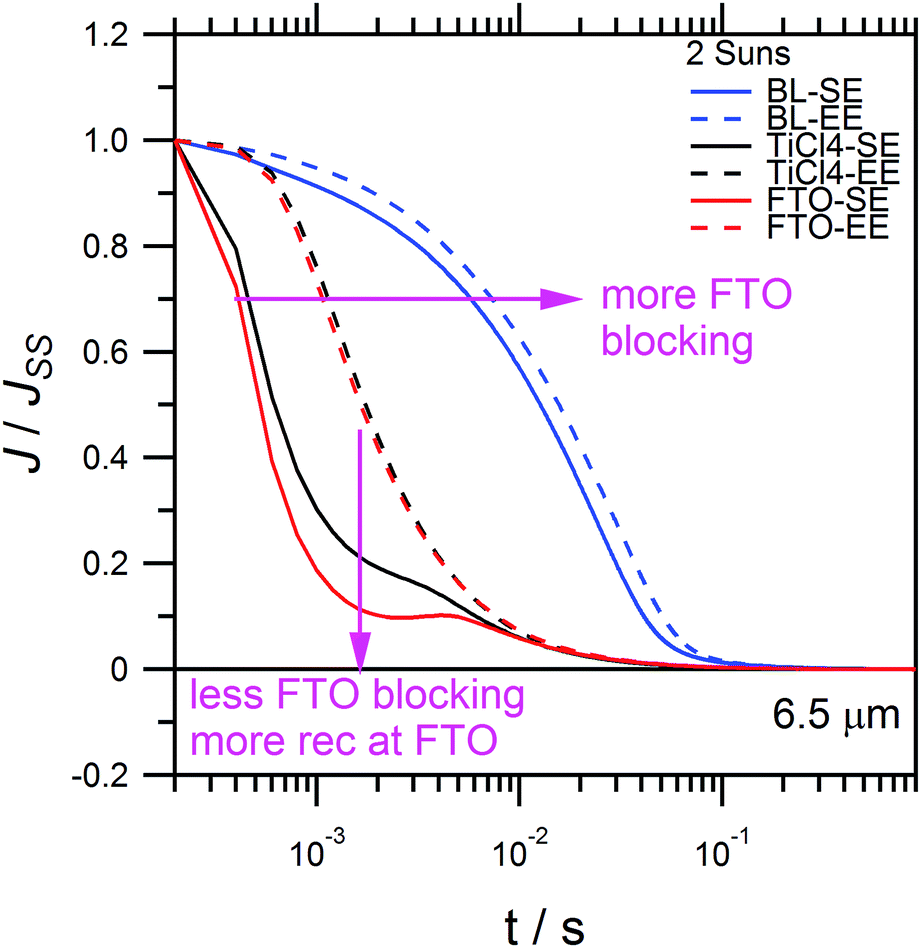 | ||
| Fig. 8 Comparison of charge extraction current decay transients for additional 6.5 μm cells prepared with various FTO-blocking layers: compact TiO2 blocking layer (BL), TiCl4 pre-treatment (TiCl4) and untreated FTO (FTO). Comparison for 2 suns SE-blue and EE-blue illumination. | ||
3.4 Small perturbation photocurrent decay transients
Finally, small perturbation photocurrent transients will be compared with large perturbation photocurrent transients, to determine whether similar information can be obtained under steady-state illumination. Typically, small perturbation transients at steady-state are more frequently used in the literature;43,52,53,55,66 however, there can be a loss of useful information when linearizing the photocurrent response.44,60 Suggestions for more accurate measurements of electron transport are discussed below.Fig. 9 shows the photocurrent response, following a small square-wave optical modulation in light intensity, under steady-state short-circuit conditions. Small perturbation photocurrent decay transients are commonly used to calculate the electron transport time-constant (τtr), which describes the average time required for the photoinjected electron to diffuse through the mesoporous TiO2 to the external circuit. This can be determined from a single exponential decay fit to the small perturbation photocurrent decay transient.43,52,53 Typically, DSSCs with high collection efficiency are expected to exhibit a mono-exponential decay, which can be observed in Fig. 10 for devices with stronger EE-absorption and thicker TiO2 films. Interestingly, the decay time-constants obtained under EE-illumination appear to be invariant with respect to the illumination wavelength (ESI, Fig. S6†). This shows that electron transport measurements under EE-illumination are less sensitive to the colour spectrum of the light source, which could also improve the comparability of electron transport measurements between different labs. This is in agreement with previous studies which have also recommended EE-illumination for more reliable measurement of electron transport.37,39
 | ||
| Fig. 9 Short-circuit photocurrent response, following a small optical perturbation under short-circuit illumination conditions. Comparison of SE/EE-illumination directionality for SE-blue illumination at 2 suns. Baseline subtracted by JSS. | ||
 | ||
| Fig. 10 Photocurrent decay transients following small optical perturbation, measured under steady-state illumination and short-circuit conditions. Baseline subtracted by steady state current (JSS) and normalised at the start of the current decay. (a and b) Comparison of increasing light intensity (0.1–2 suns). (c and d) Comparison of illumination wavelengths. | ||
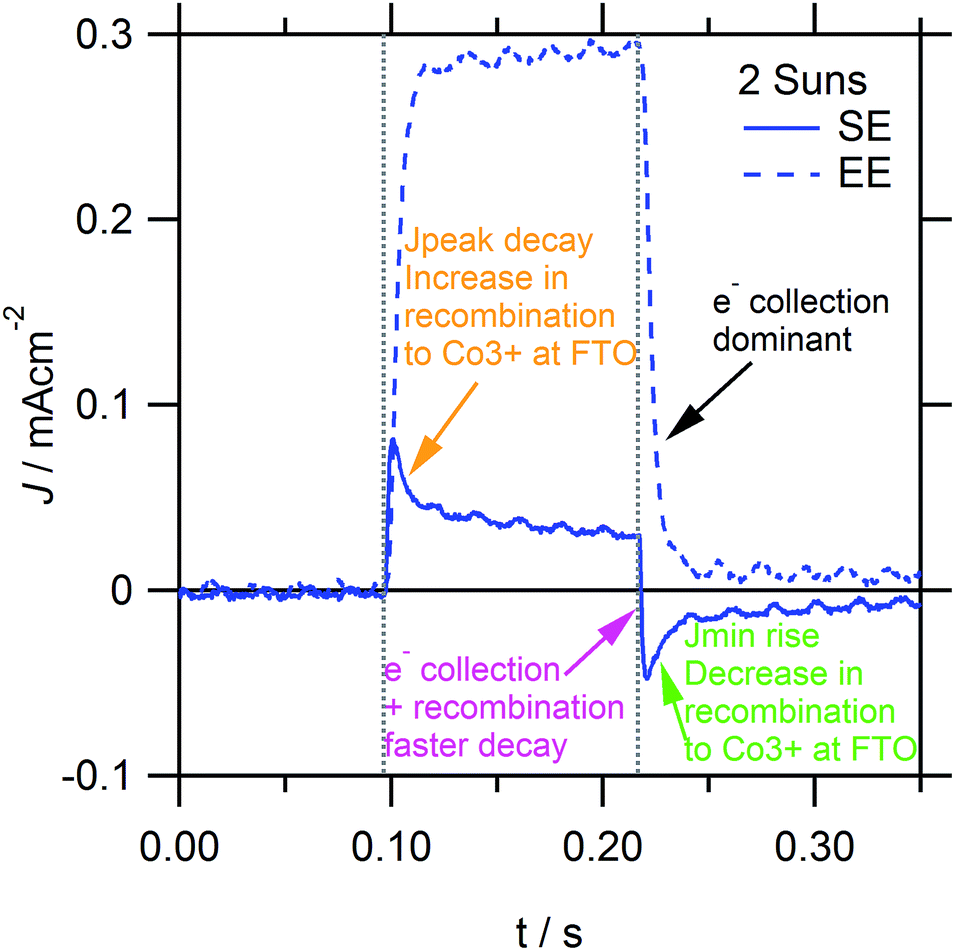
Similar to Fig. 7, the photocurrent decay transients in Fig. 10 show that excess electron recombination to [Co(bipy)3]3+ occurs on the 10−3–10−2 s timescale, which increases for stronger SE-absorption, higher light intensities and thinner TiO2 films. In addition, the small perturbation rise and decay transients in Fig. 9 (see dashed lines) are essentially identical, unlike the respective large perturbation transients in Fig. 4 and 7. Similar to Fig. 4, Fig. 9 shows that Jpeak decay and Jmin rise transients also occur on the 10−2–1 s timescale, which corresponds to the gradual increase or decrease in electron recombination to [Co(bipy)3]3+ at the FTO interface, respectively (see Fig. 9, orange and green arrows). Furthermore, Fig. 9 (see the purple arrow) and Fig. 10 show that, under [Co(bipy)3]3+ mass transport limitation, the photocurrent decay transient is faster. This sharply reduces the decay time constant (ESI, Fig. S6†), which subsequently describes electron recombination, in addition to electron collection. When excess recombination occurs, the overall photocurrent decay transient fits well to a biexponential function, although the reason for this is not entirely clear. Such an interpretation would only be valid assuming that there are two independent processes by which the excess charge can relax. However, it may not be expected for electron collection and recombination to occur independently, given that both processes could affect the overall concentration of excess electrons inside the TiO2 film. Otherwise, this could be interpreted as the relaxation of [Co(bipy)3]3+ accumulated near the FTO interface contributing to net electron recombination, primarily via the electrons inside the FTO substrate, and independently of the electrons inside the mesoporous TiO2 film. This hypothesis is supported by a decrease in excess recombination, for devices with an increased thickness of pinhole TiO2 blocking layers on FTO (ESI, Fig. S7†). Finally, it is interesting to note that similar to Fig. 7, 10c and d show that the photocurrent decay transient is preceded by an initial slow decay shoulder, which increases with TiO2 film thickness and stronger EE-absorption. The initial delay could relate to tCOL, which was observed in the turn-on rise photocurrent transients in Fig. 4, and would be consistent with the increased delay in collecting electrons which are photoinjected further from the collecting FTO contact. However, to further confirm this, additional measurements with higher resolution are required. All these trends have been reproduced in high efficiency DSSCs with various optimised TiO2 film structures (ESI, Fig. S13–15†).
Overall, small perturbation transients yield similar information to large perturbation transients. However, given the much smaller range of the data signal, the measurements of photocurrent can be highly sensitive to noise and drift – the latter of which can be improved through time-consuming averaging. In general, greater noise was observed at lower intensities whereas greater drift was observed at higher intensities. Whatever the case, devices more prone to drift will be less suitable for small perturbation measurements and may be better measured using large perturbation measurements. Importantly, the presence of current limitations such as [Co(bipy)3]3+ mass transport can be harder to distinguish from small perturbation transients, especially at lower light intensities. Therefore, it is highly recommended to measure large perturbation turn-on transients, prior to measuring small perturbation transients or any other steady-state measurements, in order to avoid inaccuracy in the determination of collection-dependent variables such as electron transport time and extracted charge density.
4 Conclusions
In summary, non-uniform intense absorption from the substrate–electrode side (strong SE-absorption) can significantly contribute to both the gradual depletion of [Co(bipy)3]3+ at the counter electrode and the increased accumulation of [Co(bipy)3]3+ inside the electrolyte-infiltrated TiO2 film. This greatly increases electron recombination to [Co(bipy)3]3+, especially at the FTO collecting contact of the working electrode. The recombination can be suppressed via the addition of pinhole-free TiO2 blocking layers on the FTO or by increasing photogeneration from the EE-side, thereby reducing the amount of [Co(bipy)3]3+ close to the FTO interface. More importantly, stronger EE-absorption reduces the overall diffusion distance of [Co(bipy)3]3+ through the electrolyte-infiltrated TiO2 film. This substantially alleviates the mass transport limitations of [Co(bipy)3]3+ to the counter electrode.More generally, we have developed a powerful method for the interpretation of both large and small photocurrent transients. Through the combination of the illumination wavelength and illumination direction, we directly control the subsequent photogeneration profile of charge carriers throughout the mesoporous TiO2 film. By analysing photocurrent transients in the time domain, the time-of-flight transits for electron and hole collection kinetics could be observed. Using this approach, we could directly simplify the interpretation of large perturbation phototransients directly in the time domain, using a qualitative analysis. Furthermore, the large perturbation phototransients yield similar if not more information than the standard small perturbation phototransients. The further use of large perturbation photocurrent transients is recommended because of their speed, simplicity and repeatability.
The findings of this work are especially relevant to the development of more stable DSSCs with viscous electrolytes, which are likely to be limited by the mass transport of the redox mediator. This work shows that the absorption profile can exacerbate mass transport issues in acetonitrile-based DSSCs – however, this work is not intended for the optimisation of acetonitrile-based DSSCs. It is aimed at providing strategies to optimise the efficiency of DSSCs with more viscous electrolytes. This work should encourage further optimisation of alternative redox mediator DSSCs (such as cobalt polypyridine or copper polypyridine) using more robust viscous electrolytes and EE-side optimisation. Additional work is required to optimise the addition of TiO2 scattering layers for EE-side absorption. The performance optimisation of more viscous electrolyte cobalt-based DSSCs in 3-methoxypropionitrile is being carried out in separate ongoing experiments, and preliminary results have yielded greater than 8% PCE at 1 sun. In such devices, it should be important to maximise light absorption from the EE-side or to minimise light absorption near the collecting FTO interface of the working electrode. Further improvements in performance can be possible, for instance, by reducing the concentration of the oxidised redox mediator (i.e., [Co(bipy)3]3+) in the bulk electrolyte, optimising the TiO2 porosity, and the addition of back-scattering TiO2 layers (on the SE-side). Additional passivation of the TiO2 photoanode for instance via the addition of Al2O3 barrier layers can also be used to further reduce recombination losses. Also, this work reintroduces the feasibility of bulkier redox mediators, which were previously disregarded due to slow mass transport. Hopefully, this work should encourage additional work into higher viscosity electrolytes, in order to replace volatile acetonitrile-based electrolytes, which should be a critical step forward towards the development of commercially viable DSSCs.
Conflicts of interest
There are no conflicts to declare.Acknowledgements
This work was funded by the Swedish Energy Agency, the Swedish Research Council and the ST and UP for Energy Program.Notes and references
- B. O'Regan and M. Grätzel, Nature, 1991, 353, 737–740 CrossRef.
- A. Hagfeldt, G. Boschloo, L. Sun, L. Kloo and H. Pettersson, Chem. Rev., 2010, 110, 6595–6663 CrossRef PubMed.
- A. Yella, H.-W. Lee, H. N. Tsao, C. Yi, A. K. Chandiran, M. K. Nazeeruddin, E. W.-G. Diau, C.-Y. Yeh, S. M. Zakeeruddin and M. Grätzel, Science, 2011, 334, 629–634 CrossRef PubMed.
- S. Mathew, A. Yella, P. Gao, R. Humphry-Baker, B. F. E. Curchod, N. Ashari-Astani, I. Tavernelli, U. Rothlisberger, M. K. Nazeeruddin and M. Grätzel, Nat. Chem., 2014, 6, 242–247 CrossRef PubMed.
- K. Kakiage, Y. Aoyama, T. Yano, K. Oya, J. Fujisawa and M. Hanaya, Chem. Commun., 2015, 51, 15894–15897 RSC.
- H. Nusbaumer, J. Moser, S. M. Zakeeruddin, M. K. Nazeeruddin and M. Grätzel, J. Phys. Chem. B, 2001, 105, 10461–10464 CrossRef.
- H. Nusbaumer, S. M. Zakeeruddin, J.-E. Moser and M. Grätzel, Chem.–Eur. J., 2003, 9, 3756–3763 CrossRef PubMed.
- S. M. Feldt, E. A. Gibson, E. Gabrielsson, L. Sun, G. Boschloo and A. Hagfeldt, J. Am. Chem. Soc., 2010, 132, 16714–16724 CrossRef PubMed.
- S. M. Feldt, G. Wang, G. Boschloo and A. Hagfeldt, J. Phys. Chem. C, 2011, 115, 21500–21507 Search PubMed.
- J.-H. Yum, E. Baranoff, F. Kessler, T. Moehl, S. Ahmad, T. Bessho, A. Marchioro, E. Ghadiri, J.-E. Moser, C. Yi, M. K. Nazeeruddin and M. Grätzel, Nat. Commun., 2012, 3, 631 CrossRef PubMed.
- T. Uchiyama, T. N. Murakami, N. Yoshii, Y. Uemura, N. Koumura, N. Masaki, M. Kimura and S. Mori, Chem. Lett., 2013, 42, 453–454 CrossRef.
- S. A. Sapp, C. M. Elliott, C. Contado, S. Caramori and C. A. Bignozzi, J. Am. Chem. Soc., 2002, 124, 11215–11222 CrossRef PubMed.
- K. Miettunen, S. Jouttijarvi, R. Jiang, T. Saukkonen, J. Romu, J. Halme and P. Lund, J. Electrochem. Soc., 2014, 161, H138–H143 CrossRef.
- J. J. Nelson, T. J. Amick and C. M. Elliott, J. Phys. Chem. C, 2008, 112, 18255–18263 Search PubMed.
- R. Jiang, A. Anderson, P. R. F. Barnes, L. Xiaoe, C. Law and B. C. O'Regan, J. Mater. Chem. A, 2014, 2, 4751–4757 Search PubMed.
- H. Ellis, R. Jiang, S. Ye, A. Hagfeldt and G. Boschloo, Phys. Chem. Chem. Phys., 2016, 18, 8419–8427 RSC.
- S. Nakade, Y. Makimoto, W. Kubo, T. Kitamura, Y. Wada and S. Yanagida, J. Phys. Chem. B, 2005, 109, 3488–3493 CrossRef PubMed.
- H. Kim, S. Ko, I. Jang and N. Park, Chem. Commun., 2011, 47, 12637 RSC.
- H. N. Tsao, P. Comte, C. Yi and M. Grätzel, ChemPhysChem, 2012, 13, 2976–2981 CrossRef PubMed.
- T. T. Trang Pham, T. M. Koh, K. Nonomura, Y. M. Lam, N. Mathews and S. Mhaisalkar, ChemPhysChem, 2014, 15, 1216–1221 CrossRef PubMed.
- L.-P. Heiniger, F. Giordano, T. Moehl and M. Grätzel, Adv. Energy Mater., 2014, 4, 1400168 CrossRef.
- W. Xiang, F. Huang, Y. Cheng, U. Bach and L. Spiccia, Energy Environ. Sci., 2013, 6, 121–127 Search PubMed.
- W. Xiang, W. Huang, U. Bach and L. Spiccia, Chem. Commun., 2013, 49, 8997 RSC.
- Y. Hao, W. Yang, L. Zhang, R. Jiang, E. Mijangos, Y. Saygili, L. Hammarström, A. Hagfeldt and G. Boschloo, Nat. Commun., 2016, 7, 13934 CrossRef PubMed.
- F. Bella, Electrochim. Acta, 2015, 175, 151–161 CrossRef.
- F. Bella, J. R. Nair and C. Gerbaldi, RSC Adv., 2013, 3, 15993 RSC.
- F. Bella, E. D. Ozzello, S. Bianco and R. Bongiovanni, Chem. Eng. J., 2013, 225, 873–879 CrossRef.
- G. P. Salvador, D. Pugliese, F. Bella, A. Chiappone, A. Sacco, S. Bianco and M. Quaglio, Electrochim. Acta, 2014, 146, 44–51 CrossRef.
- F. Bella, A. Sacco, G. Massaglia, A. Chiodoni, C. F. Pirri and M. Quaglio, Nanoscale, 2015, 7, 12010–12017 RSC.
- F. Bella, A. Lamberti, A. Sacco, S. Bianco, A. Chiodoni and R. Bongiovanni, J. Membr. Sci., 2014, 470, 125–131 CrossRef.
- F. Bella and R. Bongiovanni, J. Photochem. Photobiol., C, 2013, 16, 1–21 CrossRef.
- F. Bella, D. Pugliese, J. R. Nair, A. Sacco, S. Bianco, C. Gerbaldi, C. Barolo and R. Bongiovanni, Phys. Chem. Chem. Phys., 2013, 15, 3706 RSC.
- P. Wang, S. M. Zakeeruddin, R. Humphry-Baker and M. Grätzel, Chem. Mater., 2004, 16, 2694–2696 CrossRef.
- S. M. Zakeeruddin and M. Grätzel, Adv. Funct. Mater., 2009, 19, 2187–2202 CrossRef.
- P. Wang, S. M. Zakeeruddin, J.-E. Moser, R. Humphry-Baker and M. Grätzel, J. Am. Chem. Soc., 2004, 126, 7164–7165 CrossRef PubMed.
- M. Marszalek, F. D. Arendse, J.-D. Decoppet, S. S. Babkair, A. A. Ansari, S. S. Habib, M. Wang, S. M. Zakeeruddin and M. Grätzel, Adv. Energy Mater., 2014, 4, 1301235 CrossRef.
- J. Halme, K. Miettunen and P. Lund, J. Phys. Chem. C, 2008, 112, 20491–20504 Search PubMed.
- P. R. F. Barnes and B. C. O'Regan, J. Phys. Chem. C, 2010, 114, 19134–19140 Search PubMed.
- P. R. F. Barnes, A. Y. Anderson, S. E. Koops, J. R. Durrant and B. C. O'Regan, J. Phys. Chem. C, 2009, 113, 1126–1136 Search PubMed.
- J. Halme, G. Boschloo, A. Hagfeldt and P. Lund, J. Phys. Chem. C, 2008, 112, 5623–5637 Search PubMed.
- M. Berginc, U. Opara Krašovec, M. Jankovec and M. Topič, Sol. Energy Mater. Sol. Cells, 2007, 91, 821–828 CrossRef.
- M. Berginc, U. Opara Krašovec, M. Hočevar and M. Topič, Thin Solid Films, 2008, 516, 7155–7159 CrossRef.
- P. R. F. Barnes, K. Miettunen, X. Li, A. Y. Anderson, T. Bessho, M. Grätzel and B. C. O'Regan, Adv. Mater., 2013, 25, 1881–1922 CrossRef PubMed.
- N. W. Duffy, L. M. Peter, R. M. G. Rajapakse and K. G. U. Wijayantha, Electrochem. Commun., 2000, 2, 658–662 CrossRef.
- Y. Lin, Y. T. Ma, L. Yang, X. R. Xiao, X. W. Zhou and X. P. Li, J. Electroanal. Chem., 2006, 588, 51–58 CrossRef.
- Y. Chiba, A. Islam, R. Komiya, N. Koide and L. Han, Appl. Phys. Lett., 2006, 88, 223505 CrossRef.
- C. Law, L. Miseikis, S. Dimitrov, P. Shakya-Tuladhar, X. Li, P. R. F. Barnes, J. Durrant and B. C. O'Regan, Adv. Mater., 2014, 26, 6268–6273 CrossRef PubMed.
- N. Papageorgiou, M. Grätzel and P. P. Infelta, Sol. Energy Mater. Sol. Cells, 1996, 44, 405–438 CrossRef.
- W. Yang, N. Vlachopoulos, Y. Hao, A. Hagfeldt and G. Boschloo, Phys. Chem. Chem. Phys., 2015, 17, 15868–15875 RSC.
- H. Ellis, S. K. Eriksson, S. M. Feldt, E. Gabrielsson, P. W. Lohse, R. Lindblad, L. Sun, H. Rensmo, G. Boschloo and A. Hagfeldt, J. Phys. Chem. C, 2013, 117, 21029–21036 Search PubMed.
- P. R. F. Barnes, A. Y. Anderson, J. R. Durrant and B. C. O'Regan, Phys. Chem. Chem. Phys., 2011, 13, 5798 RSC.
- J. Nissfolk, K. Fredin, J. Simiyu, L. Häggman, A. Hagfeldt and G. Boschloo, J. Electroanal. Chem., 2010, 646, 91–99 CrossRef.
- J. Nissfolk, K. Fredin, A. Hagfeldt and G. Boschloo, J. Phys. Chem. B, 2006, 110, 17715–17718 CrossRef PubMed.
- F. Cao, G. Oskam, G. J. Meyer and P. C. Searson, J. Phys. Chem., 1996, 100, 17021–17027 CrossRef.
- A. C. Fisher, L. M. Peter, E. A. Ponomarev, A. B. Walker and K. G. U. Wijayantha, J. Phys. Chem. B, 2000, 104, 949–958 CrossRef.
- J. van de Lagemaat and A. J. Frank, J. Phys. Chem. B, 2000, 104, 4292–4294 CrossRef.
- H. N. Tsao, J. Burschka, C. Yi, F. Kessler, M. K. Nazeeruddin and M. Grätzel, Energy Environ. Sci., 2011, 4, 4921 Search PubMed.
- H. J. Lee, P. Chen, S.-J. Moon, F. Sauvage, K. Sivula, T. Bessho, D. R. Gamelin, P. Comte, S. M. Zakeeruddin, S. Il Seok, M. Grätzel and M. K. Nazeeruddin, Langmuir, 2009, 25, 7602–7608 CrossRef PubMed.
- R. Jiang and G. Boschloo, Manuscript in preparation.
- L. M. Peter, N. W. Duffy, R. L. Wang and K. G. U. Wijayantha, J. Electroanal. Chem., 2002, 524–525, 127–136 CrossRef.
- G. Boschloo, L. Häggman and A. Hagfeldt, J. Phys. Chem. B, 2006, 110, 13144–13150 CrossRef PubMed.
- N. Kopidakis, N. R. Neale and A. J. Frank, J. Phys. Chem. B, 2006, 110, 12485–12489 CrossRef PubMed.
- B. van der Zanden and A. Goossens, J. Phys. Chem. B, 2000, 104, 7171–7178 CrossRef.
- G. Boschloo and A. Hagfeldt, J. Phys. Chem. B, 2005, 109, 12093–12098 CrossRef PubMed.
- P. R. F. Barnes, A. Y. Anderson, M. Juozapavicius, L. Liu, X. Li, E. Palomares, A. Forneli and B. C. O'Regan, Phys. Chem. Chem. Phys., 2011, 13, 3547–3558 RSC.
- B. C. O'Regan and F. Lenzmann, J. Phys. Chem. B, 2004, 108, 4342–4350 CrossRef.
Footnote |
| † Electronic supplementary information (ESI) available. See DOI: 10.1039/c8ta02083c |
| This journal is © The Royal Society of Chemistry 2018 |