 Open Access Article
Highly permeable CHA membranes prepared by fluoride synthesis for efficient CO2/CH4 separation
Liang
Yu
 *,
Allan
Holmgren
,
Ming
Zhou
and
Jonas
Hedlund
Chemical Technology, Luleå University of Technology, SE-971 87 Luleå, Sweden. E-mail: liang.yu@ltu.se; Fax: +46 920491199; Tel: +46 920493002
First published on 28th March 2018
Abstract
All-silica CHA nanocrystals, much smaller (20–200 nm) than previously reported, were prepared by an improved method developed in the present work. The nanocrystals are prepared by adding milled crystals to a fluoride synthesis mixture and we observed that much smaller crystals are obtained by adding a much higher fraction of milled crystals. In the next step, CHA membranes with a thickness of ca. 1.3 μm were prepared by hydrothermal treatment of a monolayer of nanocrystals supported on porous graded alumina discs in a fluoride synthesis gel. Finally, the membranes were calcined at 480 °C. The highest measured single gas CO2 permeance was 172 × 10−7 mol m−2 s−1 Pa−1 at room temperature. The highly permeable membranes were evaluated for separation of CO2 from an equimolar mixture with CH4 at varying temperatures. The highest observed CO2 mixture permeance was 84 × 10−7 mol m−2 s−1 Pa−1 at 276 K with a separation selectivity of 47 at 9 bar feed pressure and atmospheric permeate pressure. At room temperature, the CO2 mixture permeance was also as high as 78 × 10−7 mol m−2 s−1 Pa−1 with a separation selectivity of 32. To the best of our knowledge, these CO2 permeances are by far the highest reported for CHA membranes, while the selectivity is similar to that reported previously at comparable test conditions.
Introduction
Natural gas and biogas, i.e. mixtures of mainly CH4 and CO2, are environmentally-friendly fuels. However, removal of CO2 from the raw gas is necessary before use in most applications.1Removal of CO2 from CH4 can be carried out by, e.g. pressure swing adsorption, cryogenic separation, absorption or membrane separation. Absorption or adsorption is currently the dominating techniques for CO2 separation despite being energy-intensive and rather expensive and the development of efficient CO2 separation methods is accordingly of great interest.1 Membrane separation processes have relatively low energy consumption. In recent years, the application of membrane technology for CO2 separation has hence received considerable attention.2–4 Membranes can allow for efficient and sustainable separation of CO2 without phase change, and the membrane processes are highly amenable to scale up or scale down.
Despite these advantages, membranes do not dominate industrial CO2 separation from CH4. Current commercial CO2-selective membranes are polymeric membranes possessing limited stability to CO2, and limited lifespan. Additionally, these membranes have low CO2 permeance, i.e. below 1000 gpu (3.35 × 10⁻⁷ mol m−2 s−1 Pa−1), necessitating large membrane areas and many membrane modules, resulting in relatively high costs. Zeolite membranes have been considered promising alternatives to polymeric membranes due to much higher chemical stability.4 In addition, zeolite membranes are porous, which may allow for much higher permeances compared to dense polymeric membranes. In turn, a much smaller membrane area and fewer membrane modules would be needed for a given separation task. We have shown that highly permeable zeolite membranes are economically competitive with polymeric membranes for CO2 separation.5
Several types of zeolite membrane have been investigated for CO2 separation from CH4, such as MFI,6 zeolite T,7 DDR,8 SAPO-34,9 and AlPO-18 (ref. 10) etc. Particularly interesting for this separation is CHA (also known as SSZ-13) zeolite. The unit cell is rhombohedral with a 3-dimensional pore structure and intersecting channels running in the 〈100〉 family of directions. The window diameter is 0.37 nm × 0.37 nm,11i.e. in-between the kinetic diameters 0.33 and 0.38 nm of CO2 and CH4, respectively. SSZ-13 and all-silica CHA zeolites displayed a CO2/CH4 adsorption selectivity of up to 4.1 at room temperature.12 The pore size and its selective adsorption properties, makes this zeolite promising as a membrane and simulations have shown that the CO2/CH4 permeation selectivity could be around 100 at room temperature.13 Previously, SSZ-13 crystals14 and membranes15,16 were synthesized using N,N,N-trimethyl-1-adamant ammonium hydroxide (TMAdaOH) as the structure-directing agent (SDA). A SSZ-13 membrane with a CO2/CH4 separation selectivity of 13 and a CO2 permeance of 1.7 × 10⁻⁷ mol m−2 s−1 Pa−1 has been reported.16 Steam-stable high-silica CHA membranes with a CO2/CH4 selectivity as high as 300 and a CO2 permeance of 2.0 × 10⁻⁷ mol m−2 s−1 Pa−1 have also been reported.17 Another example is a high-silica SSZ-13 CHA membrane with a CO2 permeance of 3.0 × 10⁻⁷ mol m−2 s−1 Pa−1 and a separation selectivity of 42 for equimolar CO2/CH4 mixtures.18
Fluoride-mediated synthesis of zeolite membranes has been reported to improve the stability and reduce membrane defects.19 In aluminium-free fluoride media, the concentration of lattice defects should also be low as indicated by research of Hensen et al.20 However, the precursors, i.e. CHA seeds, utilized so far were too large to admit the growth of a thin intergrown membrane in fluoride media.
To prepare thin and aluminium-free CHA membranes entirely in fluoride media, Si-CHA zeolite nanocrystals, which are also prepared from fluoride media, are needed. The synthesis of such nanoparticles is a challenge due to the inhomogeneous nature of the fluoride synthesis gel.17 However, in the present work, we successfully synthesised Si-CHA zeolite nanocrystals in fluoride media for the first time. In the next step, these crystals were used as seeds and enabled growth of very thin and highly permeable membranes by hydrothermal treatment in a fluoride synthesis gel.
Experimental
Preparation of Si-CHA nanocrystals
In the first step, CHA microcrystals were prepared by mixing distilled water, colloidal silica (Ludox AS-40), N,N,N-trimethyl-1-adamant ammonium hydroxide (TMAdaOH 25%, SACHEM, Inc.) and hydrofluoric acid (48%) in a PTFE bottle. After stirring overnight, part of the water was removed by freeze-drying to obtain a synthesis gel with a molar composition of 1.0SiO2![[thin space (1/6-em)]](https://www.rsc.org/images/entities/char_2009.gif) :
:![[thin space (1/6-em)]](https://www.rsc.org/images/entities/char_2009.gif) 1.4TMAdaF
1.4TMAdaF![[thin space (1/6-em)]](https://www.rsc.org/images/entities/char_2009.gif) :
:![[thin space (1/6-em)]](https://www.rsc.org/images/entities/char_2009.gif) 9.4H2O. Hydrothermal synthesis was then carried out at 175 °C for 1 day. Pure CHA microcrystals were obtained after centrifuging and washing by distilled water six times.
9.4H2O. Hydrothermal synthesis was then carried out at 175 °C for 1 day. Pure CHA microcrystals were obtained after centrifuging and washing by distilled water six times.
The CHA microcrystals were milled in DDI water using 3 mm glass beads in a glass bottle by shaking at 500 rpm for 1 day. In the next step, CHA nanocrystals were prepared using essentially the same procedure as for the preparation of Si-CHA microcrystals, except that a certain amount of milled CHA microcrystals dispersed in water was added to the synthesis gel before freeze-drying. The mass ratio between milled CHA microcrystals and SiO2 in the gel was 1![[thin space (1/6-em)]](https://www.rsc.org/images/entities/char_2009.gif) :
:![[thin space (1/6-em)]](https://www.rsc.org/images/entities/char_2009.gif) 3.9. After freeze-drying, the final molar composition of the gel used for growth of nanocrystals (apart from the milled CHA microcrystals) was the same as for the gel used for preparation of CHA microcrystals. Finally, CHA nanocrystals were obtained by hydrothermal treatment of the gel at 160 °C for 1 day. After repeated centrifugation and re-dispersion in water six times, a 1 wt% colloidal dispersion of CHA nanocrystals was prepared and the pH was adjusted to 10 by ammonia.
3.9. After freeze-drying, the final molar composition of the gel used for growth of nanocrystals (apart from the milled CHA microcrystals) was the same as for the gel used for preparation of CHA microcrystals. Finally, CHA nanocrystals were obtained by hydrothermal treatment of the gel at 160 °C for 1 day. After repeated centrifugation and re-dispersion in water six times, a 1 wt% colloidal dispersion of CHA nanocrystals was prepared and the pH was adjusted to 10 by ammonia.
Membrane preparation and characterisation
The membranes were prepared as described in detail in a pending patent application.21 Porous graded α-alumina discs (Fraunhofer IKTS, Germany) with a diameter of 25 mm were used as supports. The top layer of the disc was 30 μm thick with a pore size of 100 nm, and the base layer was 3 mm thick with a pore size of 3 μm. Before seeding, the colloidal dispersion of CHA nanocrystals was filtered through a 0.8 μm filter. The synthesis gel used for growth of the seed layer to a membrane was prepared in the same way and had the same molar composition as the gel used for the preparation of CHA microcrystals but the gel was aged at 60 °C for 6 h prior to use. The aged gel was poured into a PTFE-lined autoclave (30 ml) in which the seeded α-alumina support was placed on the bottom of the autoclave with the seeded side down. Film growth was carried out at 160 °C for 18 h. After synthesis, the membrane was rinsed in a 0.1 M aqueous NH3 solution and then dried at 80 °C overnight. Finally, the organic template in the membranes was removed by calcination at 480 °C for 16 h at a heating rate of 0.2 °C min−1 and a cooling rate of 0.3 °C min−1.The phase of the zeolite crystals and films was determined by X-ray diffraction (XRD) using a PANalytical Empyrean diffractometer equipped with a Cu LFF HR X-ray tube and a PIXcel3D detector. During the measurement, the irradiated length was fixed to 1 mm by a variable divergence slit. The morphology and microstructure of the crystals and membranes was investigated by scanning electron microscopy (SEM), using an FEI Magellan 400 field emission instrument. The samples were not coated prior to analysis.
Single gas and mixed-gas separation experiments
The membranes were mounted in stainless steel cells using graphite gaskets (Eriks, the Netherlands) for sealing. To evaluate the quality of the as-synthesized membranes, single gas He permeation experiment was carried out before calcination using 6 bar (absolute) feed pressure and atmospheric permeate pressure, i.e. a ΔP of 5 bar. Single gas permeation experiments of He and CO2 at room temperature were carried out using 1.8 bar (absolute) feed pressure and atmospheric permeate pressure, i.e. a ΔP of 0.8 bar directly after calcination. Single gas CO2 permeation experiments at room temperature were also carried out at different feed pressures and atmospheric permeate pressure after calcination.Before separation experiments, the membranes were dried in a flow of helium at 300 °C for 6 h with a heating rate of 1 °C min−1 and then allowed to cool naturally. For permeation experiments at sub-ambient temperatures, the cell was placed in a thermostated silicone oil bath. Permeation experiments were performed in a continuous flow mode using an equimolar CO2/CH4 gas mixture that was fed to the membrane using mass flow controllers. The retentate pressure was controlled by a back pressure regulator and the pressure on both sides of the membrane was monitored by pressure gauges. The feed pressure was 9 bar (absolute pressure) and the volumetric flow rate was 10 Nl min−1. The permeate was kept at atmospheric pressure and no sweep gas was used. Consequently, the pressure ratio, φ = PFeed/PPerm, was 9. The permeate flow was measured using a bubble flow meter, and the composition of feed and permeate streams was analysed online using a GC (490 Micro GC, Agilent).
Results and discussion
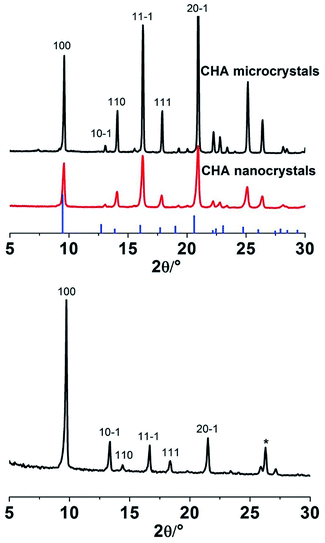
Fig. 1a shows a SEM image of as-synthesised CHA microcrystals. The crystals were ca. 20 μm in size, with a well-defined pseudocube habit, as reported previously for CHA crystals prepared in fluoride media.20 The XRD pattern for these crystals is shown in Fig. 2. The detected reflections were typical of the CHA framework,11 no other phase was present as evident from comparison with the reference pattern of K-exchanged aluminosilicate CHA indicated by bars.22 The shift of the reflections can be assigned to the aluminium free form of the zeolite crystals prepared in the present work as compared to the reference zeolite with an Si/Al ratio of 2.23Fig. 1b shows a SEM image of the prepared Si-CHA nanocrystals. The size of the crystals is ranging from ca. 20 to 200 nm and again, the crystals display a well-defined pseudocube habit.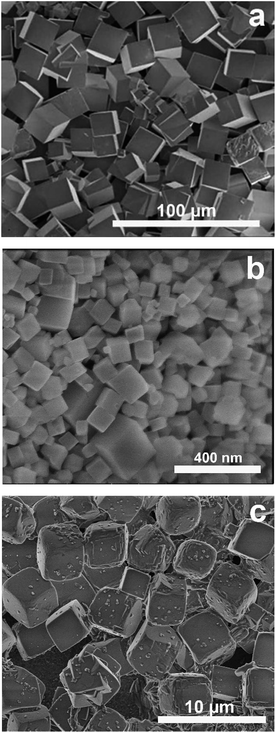 | ||
| Fig. 1 SEM images of CHA microcrystals (a), nanocrystals (b) and the microcrystals (c) collected from the bottom of the autoclave after membrane synthesis. | ||
XRD data confirm that the nanocrystals are comprised of pure CHA phase, see Fig. 2. The lower intensities and broader reflections are a result of broadening due to small crystal size. The SEM image in Fig. 1c illustrates that CHA microcrystals with a size of ca. 3 μm also formed in the autoclave during membrane synthesis. The recovered CHA microcrystals could also be used for preparation of CHA nanocrystals, implying that our method offers a green synthesis route.
Fig. 3a shows a SEM image of the support seeded with Si-CHA nanocrystals. As the rounded alumina grains are barely visible, it can be concluded that the seed layer is a quite dense monolayer of CHA crystals. The XRD pattern of an as-synthesised CHA membrane (Fig. 2) shows that the film comprises only the CHA phase, i.e. with no presence of other zeolite or amorphous phases. The strong diffraction peak at 2θ = 9.6° shows that the CHA crystals in the film are weakly (100) oriented, which is in line with previous reports for other Si-CHA membranes.23 Consequently, crystals are preferentially oriented with pores running in the 〈100〉 family of directions across the membrane, i.e. perpendicular to the membrane surface.
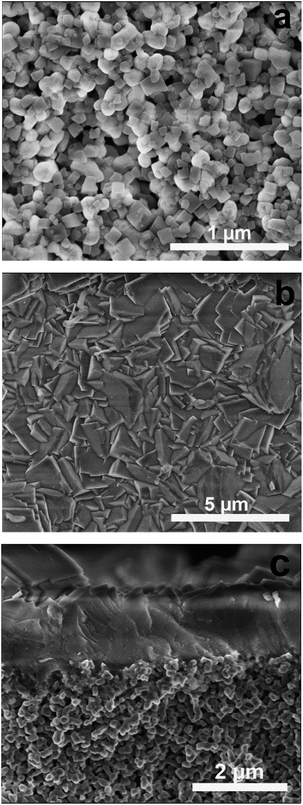 | ||
| Fig. 3 SEM images of the Si-CHA seed layer on the support (a), top-view (b) and cross-section (c) of a calcined CHA membrane. | ||
Non-calcined as-synthesised CHA membranes contain TMAda+ template molecules blocking the zeolite pores. Accordingly, defect-free membranes are impermeable before removing the template by calcination. To evaluate the quality of the as-synthesised membranes, the single gas helium permeance was measured at 293 K and 5 bar feed pressure and atmospheric permeate pressure for 9 membranes. The helium permeance was very low in the range 0.5 to 6 × 10⁻⁹ mol m−2 s−1 Pa−1 indicating that the membranes are essentially free from defects before calcination. After calcination, the morphology of the membranes was characterised by SEM. Top-view SEM images (see Fig. 3b) show that the film is continuous and comprised of well-intergrown zeolite crystals. No defects such as pinholes or cracks in the membrane could be observed. The cross-sectional SEM image show that the film appears to be rather even with a total thickness of about 1.3 μm (see Fig. 3c). Moreover, the support was open and clean, no invasion could be observed.
Table 1 shows single gas permeances before and after calcination for four membranes prepared in the same batch. Very low helium permeances, in average 2.8 × 10⁻⁹ mol m−2 s−1 Pa−1, were observed before calcination, i.e. the membranes are essentially defect-free before removing template. After calcination, the average single gas helium permeance increases to about 34 × 10−7 mol m−2 s−1 Pa−1. Meanwhile, the average CO2 single gas permeance was as high as 122 × 10−7 mol m−2 s−1 Pa−1 at 1.8 bar (absolute) feed pressure and 1 bar (absolute) permeate pressure at room temperature. A previously reported SSZ-13 membrane displayed a single gas CO2 permeance of approximately 3 × 10⁻⁷ mol m−2 s−1 Pa−1 at room temperature and 6 bar feed pressure and atmospheric pressure on permeate side.16 The very high permeance of the CHA membranes reported in the present work is a result of the graded support with low flow resistance and the thin zeolite film layer grown on a support without invasion as well as the low pressure difference (ΔP = 0.8 bar) for the measurement, and also of the drying procedure. As reported for polymeric membranes, the drying process may have a significant effect on the separation performance.24–26 For zeolite membranes, adsorption of e.g. water from the ambient in the zeolite pores may reduce the CO2 permeance. For non-dried membranes, about 50% lower CO2 permeance was observed with similar separation factor, during mixture separation.
| Membranes | Permeance, 10−7 mol m−2 s−1 Pa−1 | ||
|---|---|---|---|
| He | He | CO2 | |
| Before calcination | After calcination | After calcination | |
| M1 | 0.015 | 32 | 126 |
| M2 | 0.013 | 31 | 118 |
| M3 | 0.027 | 35 | 121 |
| M4 | 0.058 | 37 | 122 |
| Average | 0.028 | 34 | 122 |
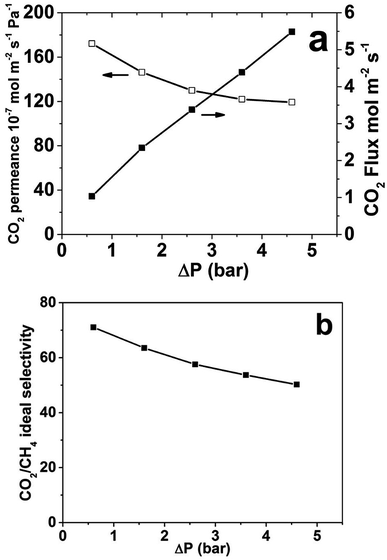
Fig. 4 shows the CO2 single gas permeance and flux as well as CO2/CH4 ideal selectivity as a function of ΔP at atmospheric permeate pressure and room temperature for membrane M1. The highest observed CO2 single gas permeance was 172 × 10−7 mol m−2 s−1 Pa−1 at the lowest investigated ΔP of 0.5 bar. As ΔP increase, i.e. the feed pressure increased, the permeance reduced somewhat, which indicates that the adsorbed concentration of CO2 is not increasing proportionally to the feed pressure increase and also that the pressure drop over the support is increasing with increasing feed pressure and ΔP. As the single gas CH4 permeance was very low and almost constant (not shown), the ideal selectivity follows the same trend as the single gas CO2 permeance and is decreasing with increasing ΔP. The CO2 flux increases with increasing ΔP. The highest CO2 flux was 5.5 mol m−2 s−1 at a ΔP of 4.5 bar. However, the flux did not increase proportionally to ΔP; as ΔP increased from 0.5 to 4.5 bar, nine times, the flux only increased from 1.03 to 5.49 mol m−2 s−1, only around five times. Again, this can be ascribed to that the adsorbed concentration of CO2 is not increasing proportionally to the feed pressure increase and also that the pressure drop over the support is increasing with increasing feed pressure and ΔP.
The average separation selectivity for equimolar CO2/CH4 gas mixture for four CHA membranes prepared using the same method but in 4 batches was 25 with a standard deviation of 8 at room temperature. The best membrane was further investigated and all other data was recorded for this membrane. Fig. 5 illustrates the measured membrane separation selectivity and permeance as a function of temperature with experimental error indicated at 293 K. The membranes were CO2-selective in the entire studied temperature range. The separation selectivity increased with decreasing temperature most likely due to both increased CO2/CH4 adsorption selectivity and increased blocking of defects by capillary condensation of CO2 at lower temperatures. The same trend was observed for the separation factor (see Table 2). At room temperature, a CO2/CH4 separation selectivity of 32 was observed, with a corresponding separation factor of 26. Starting from the highest temperature (318 K), the selectivity increased with decreasing temperature, and the highest observed separation selectivity was 76, with a corresponding separation factor of 60, at the lowest temperature studied (249 K).
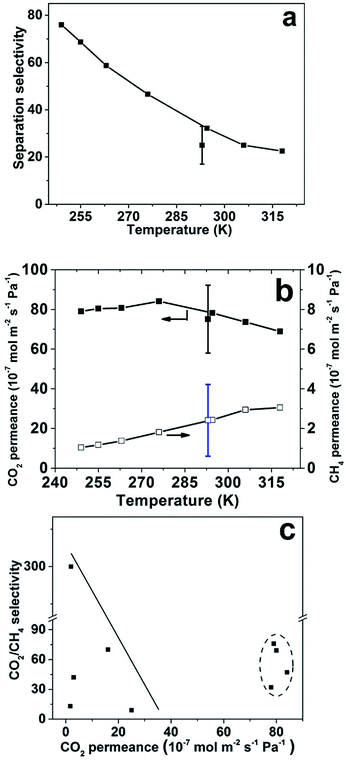 | ||
| Fig. 5 Equimolar CO2/CH4 gas mixture separation results at feed pressure of 9 bar and permeate pressure of 1 bar, (a) CO2/CH4 separation selectivity as a function of temperature; (b) CO2 and CH4 permeances as a function of temperature and (c) comparison with data from SSZ-13 and SAPO-34 membranes reported by other groups.9,16,18,27,28 Data within the dotted oval are results from the present work. The points with error bars indicate the average and standard deviation for four membranes prepared using the same method but in 4 batches measured at room temperature and the best membrane was selected for the measurement at different temperatures. | ||
| T (K) | CO2 flux (mol m−2 s−1) | Permeate concentration (mol%) | CO2/CH4 membrane separation factor | |
|---|---|---|---|---|
| CO2 | CH4 | |||
| a Average and standard deviation at about 293 K measured for four CHA membranes prepared using the same method but in 4 batches. | ||||
| 318 | 2.45 | 94.74 | 5.26 | 18 |
| 306 | 2.61 | 95.23 | 4.77 | 20 |
| 295 | 2.77 (2.67 ± 0.6)a | 96.23 | 3.77 | 26 (20 ± 6)a |
| 276 | 2.97 | 97.35 | 2.65 | 37 |
| 263 | 2.84 | 97.88 | 2.12 | 46 |
| 255 | 2.83 | 98.18 | 1.82 | 54 |
| 249 | 2.78 | 98.35 | 1.65 | 60 |
Fig. 5b shows that the CO2 permeance was very high in the studied temperature range, and passed through a maximum value at 276 K. The highest observed CO2 permeance during mixture separation was 84 × 10−7 mol m−2 s−1 Pa−1 with a CO2/CH4 separation selectivity of 47 at the same temperature. The mixture CO2 permeance was also as high as 78 × 10−7 mol m−2 s−1 Pa−1 at room temperature. To the best of our knowledge, these CO2 permeances are the highest reported for CHA membranes at the similar conditions. However, this permeance is much lower than the single gas permeance of 122 × 10−7 mol m−2 s−1 Pa−1, measured at comparable conditions, at a feed pressure of 4.5 bar during single gas permeation, i.e. the same as the partial pressure of CO2 of 4.5 bar on feed side during mixture separation. This is likely due to the influence of CH4 on the transport of CO2 through the membrane by competitive adsorption with CO2. Fig. 5c summarizes the best CO2/CH4 separation data reported for CHA membrane in the literature9,16,18,27,28 and the separation data obtained in the present work. Obviously, the membranes reported in the present work display very high permeance, while the separation selectivity is comparable to previous reports for the best SSZ-13 and SAPO-34 zeolite membranes,18,27 but lower than Zhou et al., that reported a SSZ-13 membrane with a selectivity of 300.29 The observed CO2 permeances for the CHA membranes in the present work are comparable with our previous reported high-flux MFI membrane, but with 8 times higher separation factor at similar test conditions.6 In addition, polymeric membranes usually show comparable selectivities of 10–100 for CO2/CH4 separation, however the CO2 permeances are normally lower than 1000 GPU, i.e. lower than 3.35 × 10⁻⁷ mol m−2 s−1 Pa−1.30
Table 2 shows the CO2 fluxes, the concentration of CO2 and CH4 in the permeate stream and the CO2/CH4 separation factor with average and standard deviation at room temperature for four CHA membranes prepared using the same method but in 4 batches. The latter term denotes the ratio of CO2 and CH4 concentration in the permeate stream over the same ratio in the feed. In the entire temperature range, the observed CO2 flux was very high, i.e. 2.45–2.97 mol m−2 s−1, corresponding to 388–470 kg m−2 h−1 although the partial pressure difference of CO2 across the membrane was relatively low at about 350 kPa. At room temperature, the average separation factor was 20 with a standard deviation of 6 for four CHA membranes and the best separation factor was 26 with a CO2 flux of 2.77 mol m−2 s−1 (438 kg m−2 h−1), which was significantly higher than that for our MFI membranes with a separation factor of 3.5 and a flux of 300 kg m−2 h−1.6 It was also more than 175 times higher than that (2.5 kg m−2 h−1) reported for the highly CO2-selective SAPO-34 zeolite membranes at similar experimental conditions.9
Conclusions
In the present work, high-flux CHA membranes with a thickness of ca. 1.3 μm were synthesized from Si-CHA nanocrystals with much smaller size (20–200 nm) than previously reported using fluoride as mineralizing agent for the first time. The membranes displayed a very high performance for separation of equimolar CO2/CH4 mixtures with the highest observed CO2 mixture permeance of 84 × 10−7 mol m−2 s−1 Pa−1 and a separation selectivity of 47 at 9 bar feed pressure, atmospheric permeate pressure and 276 K. The separation selectivity was comparable with that reported for other high-flux CHA membranes, nevertheless with much higher CO2 permeance and flux to that reported previously at comparable test conditions.Conflicts of interest
There are no conflicts to declare.Acknowledgements
The Swedish Research Council for Environment, Agricultural Sciences and Spatial Planning Formas, the Swedish Energy Agency and Bio4Energy are gratefully acknowledged for financial support.Notes and references
- R. W. Baker and K. Lokhandwala, Ind. Eng. Chem. Res., 2008, 47, 2109–2121 CrossRef CAS.
- X. Y. Chen, H. Vinh-Thang, A. A. Ramirez, D. Rodrigue and S. Kaliaguine, RSC Adv., 2015, 5, 24399–24448 RSC.
- S. Basu, A. L. Khan, A. Cano-Odena, C. Liu and I. F. J. Vankelecom, Chem. Soc. Rev., 2010, 39, 750–768 RSC.
- N. Kosinov, J. Gascon, F. Kapteijn and E. J. M. Hensen, J. Membr. Sci., 2016, 499, 65–79 CrossRef CAS.
- D. Korelskiy, P. Ye, S. Fouladvand, S. Karimi, E. Sjöberg and J. Hedlund, J. Mater. Chem. A, 2015, 3, 12500–12506 CAS.
- L. Sandström, E. Sjöberg and J. Hedlund, J. Membr. Sci., 2011, 380, 232–240 CrossRef.
- Y. Cui, H. Kita and K.-I. Okamoto, J. Mater. Chem., 2004, 14, 924 RSC.
- J. van der Bergh, W. Zhu, J. Gascon, J. A. Moulijn and F. Kapteijn, J. Membr. Sci., 2008, 316, 35 CrossRef.
- S. Li, J. L. Falconer and R. D. Noble, Microporous Mesoporous Mater., 2008, 110, 310–317 CrossRef CAS.
- M. L. Carreon, S. Li and M. A. Carreon, Chem. Commun., 2012, 48, 2310–2312 RSC.
- N. Hedin, G. J. DeMartin, W. J. Roth, K. G. Strohmaier and S. C. Reyes, Microporous Mesoporous Mater., 2008, 109, 327–334 CrossRef CAS.
- H. Maghsoudi, M. Soltanieh, H. Bozorgzadeh and A. Mohamadalizadeh, Adsorption, 2013, 19, 1045–1053 CrossRef CAS.
- R. Krishna and J. M. van Baten, J. Membr. Sci., 2010, 360, 323–333 CrossRef CAS.
- S. I. Zones, Zeolite SSZ-13 and its method of preparation, US Pat., 4544538, 1985.
- N. Kosinov, C. Auffret, G. J. Borghuis, V. G. P. Sripathi and E. J. M. Hensen, J. Membr. Sci., 2015, 484, 40–145 CrossRef.
- H. Kalipcilar, T. C. Bowen, R. D. Noble and J. L. Falconer, Chem. Mater., 2002, 14, 3458–3464 CrossRef CAS.
- Y. Zheng, N. Hu, H. Wang, N. Bu, F. Zhang and R. Zhou, J. Membr. Sci., 2015, 475, 303–310 CrossRef CAS.
- N. Kosinov, C. Auffret, C. Gücüyener, B. M. Szyja, J. Gascon, F. Kapteijn and E. J. M. Hensen, J. Mater. Chem. A, 2014, 2, 13083 CAS.
- M. J. Díaz-Cabanas, P. A. Barrett and M. A. Camblor, Chem. Commun., 1998, 1881–1882 RSC.
- X. Zhu, N. Kosinov, J. P. Hofmann, B. Mezari, Q. Qian, R. Rohling, B. M. Weckhuysen, J. Ruiz-Martínezb and E. J. M. Hensen, Chem. Commun., 2016, 52, 3227–3230 RSC.
- J. Hedlund, A. Holmgren and L. Yu, Methods for preparing supported zeolite films, GB patent application, GB1714269.6, Sep 2017.
- M. M. J. Treacy and J. B. Higgins, Collection of simulated XRD powder patterns for zeolites, Elsevier, 5th revised edn, 2007 Search PubMed.
- M. Calligaris, G. Nardin and L. Randaccio, Zeolites, 1983, 3, 205–208 CrossRef CAS.
- J. Albo, J. Wang and T. Tsuru, J. Membr. Sci., 2014, 453, 384–393 CrossRef CAS.
- J. Albo, J. Wang and T. Tsuru, J. Membr. Sci., 2014, 449, 109–118 CrossRef CAS.
- J. Albo, H. Hagiwara, H. Yanagishita, K. Ito and T. Tsuru, Ind. Eng. Chem. Res., 2014, 53, 1442–1451 CrossRef CAS.
- E. Kim, W. Cai, H. Baik and J. Choi, Angew. Chem., Int. Ed., 2013, 52, 5280–5284 CrossRef CAS PubMed.
- Y. Tian, L. Fan, Z. Wang, S. Qui and G. Zhu, J. Mater. Chem., 2009, 19, 7698 RSC.
- R. Zhou, E. W. Ping, H. H. Funke, J. L. Falconer and R. D. Noble, J. Membr. Sci., 2013, 444, 384 CrossRef CAS.
- H. Lin and M. Yavari, J. Membr. Sci., 2015, 475, 101–109 CrossRef CAS.
| This journal is © The Royal Society of Chemistry 2018 |

