 Open Access Article
Infiltrated mesoporous oxygen electrodes for high temperature co-electrolysis of H2O and CO2 in solid oxide electrolysis cells
E.
Hernández
 a,
F.
Baiutti
 a,
A.
Morata
 a,
M.
Torrell
 *a and
A.
Tarancón
 *b
*b
aCatalonia Institute for Energy Research (IREC), Department of Advanced Materials for Energy, Jardins de les Dones de Negre, 1, 08930 Sant Adrià de Besòs, Barcelona, Spain. E-mail: mtorrell@irec.cat
bICREA, Passeig Lluís Companys 23, 08010 Barcelona, Spain
First published on 14th May 2018
Abstract
In the last few years, high temperature solid oxide electrolysis cells (SOECs) have emerged as a promising solution for energy conversion and storage. However, state-of-the-art systems suffer from technological limitations, which prevent their widespread use and market penetration. Particularly, the electrode–electrolyte interface represents a critical element due to the high oxygen potential located in this area, which in turn determines interface delamination. In this context, the use of mesoporous materials, whose architecture is characterized by concatenated nanometric-size pores and high specific surface area, represents a powerful strategy toward the achievement of long-term stability of the electrode. Such structures have been recently proposed as ionically conducting electrode scaffolds for solid oxide fuel cells (SOFCs), exhibiting good performances and low degradation rates. In particular, it has been shown that a highly increased triple phase boundary (TPB)-active points distribution along the electrode may be achieved upon infiltration with a catalytically active material. In this study, infiltrated mesoporous cerium was used as a functional oxygen electrode layer in a fuel electrode supported SOEC system. The results indicate that an enhancement in both long-term stability and electrolysis cell performance are achieved. This is attributed to the decrease in high current density paths and areas of high oxygen potential and to the superior thermal stability of such a nanostructured composite, which allows better current distribution. First, the morphological characterization of the as-synthesized mesoporous Ce0.8Gd0.2O1.9 (CGO), which was carried out by TEM microscopy and low-angle X-ray diffraction (LA-XRD), is presented. A structural and functional investigation of the fuel electrode supported cells, in which the oxygen electrode is composed of catalytically active La0.6Sr0.4Co0.2Fe0.8O3 (LSCF) infiltrating a CGO scaffold, was studied by means of XRD, scanning electron microscopy and spectroscopy, and electrochemical measurements. Characterization under co-electrolysis mode (45% H2O, 45% CO2 and 10% H2) shows an injected current density higher than 1.2 A cm−2 at 1.4 V at 750 °C. Electrochemical impedance spectroscopy was carried out at regular time intervals during galvanostatic (0.5 and 0.75 A cm−2) long-term operation for 1400 h, exhibiting a decrease in polarization resistance and only slight increase in serial resistance during operation. Total degradation rates lower than 2% kh−1 at 0.5 A cm−2 and 1% kh−1 at 0.75 A cm−2 were obtained. Finally, a mechanism for cell degradation based on evolution of the fuel electrode is proposed.
Introduction
In the last decade, development of technologies for the conversion of atmospheric CO2 into valuable fuels has attracted increased attention. Also, the transformation of excess power generated by renewable sources into chemical energy through production of synthetic fuels (so-called power-to-gas or power-to-liquid routes)1 has become a need in a society that is increasingly concerned about the consumption of green energy.Among the power-to-fuel systems for the conversion of electricity and heat,1 high temperature electrolysis (HTE) is a promising route, which employs solid oxide electrolysis cells (SOECs) for electrochemical conversion of H2O and H2O/CO2 mixtures.2 Such technology presents a number of advantages, e.g., it enables storage, in the form of H2 or synthetic gas, of excess electrical energy produced by renewable sources during low energy price periods.3,4 Notably, syngas (H2 + CO) produced from co-electrolysis is the first step for generation of chemicals or liquid fuels via Fischer–Tropsch (F–T) synthesis.5 This process needs to be competitive and to exhibit high performance and long-term stability in order to enter the energy market.6 Solid oxide electrolysers operate at high temperature, thus having clear thermodynamic and kinetic advantages. This results in fast charge (e.g., charge transfer or electrical conduction) and mass transport and low internal resistance, thus leading to low electrical demand and high efficiency.6 However, high temperature electrolysis is affected by fast degradation processes,7 mainly caused by delamination or by structural degradation of the electrolyte/oxygen electrode interface.8 The formation of high internal oxygen pressure at the electrolyte near the interface9,10 and the increase in the electromotive potential gradient between the electrodes under operation11 are among the main factors causing such degradation processes. Furthermore, interfaces have been shown to evolve under operation conditions, e.g. as a consequence of cationic segregation and of the formation of contaminants at the interfaces.12 These represent additional sources of cell degradation. Post-mortem microscopy, carried out on cells after long-term tests, have also shown the irreversible damage of the Ni–YSZ microstructure because of the decrease in the contact area, the loss of the Ni percolation path and the migration of Ni from the fuel electrode to the electrolyte.13
The electrode reaction can only take place in highly electrocatalytic active points possessing both high ionic and electronic conductivity. Furthermore, maximization of the active surface area should be carried out not only by choice of appropriate materials, but also by structural engineering. Nanostructure composite materials allow maximizing the triple phase boundary (TPB) distribution, thus reducing the current density at each point. This results in enhanced cell performance and durability.14 Specifically, mesoporous materials can be employed on electrodes to obtain high specific surface area.15 Upon its functionalization, e.g., by a wet infiltration process, a large number of active sites for electrochemical reactions are achieved, which favors the catalytic activity and stability of the electrode. Owing to the large applicability, this technique has been used for fabrication of SOCs electrodes with different functionalities, such as mechanical support and ionic and electronic conductivity.12,14,16
A mesoporous ionic conductor infiltrated by a catalytically active material has been previously employed as an electrode for SOFCs.6,17–19 One of the main problems of the use of nanostructures in energy applications such as SOCs is their durability at high-temperatures. Notably, the long-term stability of mesoporous metal oxides as Ce0.8Gd0.2O1.9 (CGO) and Ce0.8Sm0.2O1.9 (SDC) (in terms of microstructure and catalytic activity) has been proven for temperatures up to 1000 °C, opening up the possibility of using such high-surface area materials for high-temperature applications.6 In particular, it has been shown that no change in grain size occurs after the first 5–10 hours at high temperature. This has been explained by applying the model of self-limited grain growth for two-dimensional structures as described by Rupp et al. and by considering the presence of a biphasic amorphous-crystalline CGO at the grain boundaries before full crystallization. Once crystallization of these two phases takes place, a decrease in microstrain occurs in parallel with the grain growth, leading to an equilibrium situation that prevents grain coarsening.20,21
Prior to this study, Almar et al. reported the use of mesoporous NiO-CGO cermets as SOFC anodes, showing maximum power density of 435 mW cm−2 and low degradation rates.18 Furthermore, symmetrical cells constructed using SDC-SSC (Sm0.5Sr0.5CoO3) mesoporous nanocomposite as an oxygen electrode have been studied and their thermal stability has been confirmed. Notably, an improvement in the performance due to microstructural evolution of the nanocomposite electrode operation has also been highlighted.17 Finally, a study on SOFCs fully based on mesoporous materials has also been published by the same authors; such SOFCs achieved a peak power density of 565 mW cm−2 at 750 °C and demonstrated stability for more than 1000 h at 635 mA cm−2.19 However, the operation of solid oxide cells in electrolyser mode has been demonstrated to be more demanding in terms of stability for both activity and microstructure of the electrode materials. This has been recently shown by Torrell et al., who published results on electrolyte supported NiO-CGO/ScCeSZ ((Sc2O3)0.1(CeO2)0.01(ZrO2)0.89)/SDC-SSC cells operating under SOEC conditions. For these cells, a maximum current density of 330 mA cm−2 and degradation of cell performance as a consequence of delamination of the oxygen electrode has been reported.15 These issues have been overcome in the present study, as detailed further.
For the present study, a route for the improvement of oxygen electrodes for SOECs is described. This relies on the development of electrode micro- and nanostructures, which ensure homogenous distribution of the ionically conducting and catalytic phases. In particular, in order to decrease the SOEC degradation rate, nanocomposites based on infiltrated mesoporous materials are proposed as oxygen electrodes. Gadolinium-doped ceria (Ce0.8Gd0.2O1.9 (CGO)) mesoporous functional layer was synthesized and infiltrated with a catalytically active phase of La0.6Sr0.4Co0.2Fe0.8O3 (LSCF). These electrodes were deposited on top of a YSZ electrolyte in fuel electrode Ni–YSZ supported cells. The structural characterization of the electrode is presented and the as-fabricated SOEC was characterized electrochemically by recording I–V polarization curves and impedance spectra while operating under co-electrolysis atmosphere. A comparative microstructural characterization of the cell before and after long term operation is presented.
Experimental methods
Cells fabrication
Mesoporous CGO was synthesized as a replica of KIT-6 mesoporous template by applying a hard-template nanocasting method. Stoichiometric amounts of Gd(NO3)3·6H2O and Ce(NO3)3·6H2O precursors and KIT-6 were dissolved in ethanol to impregnate the template. The desired CGO phase was obtained after thermal treatment at 600 °C for 5 h in oxidizing atmosphere. A detailed description of the synthesis process can be found elsewhere.6 The cells employed for these experiments were fabricated by HTCeramix for this study. They constitute a Ni–YSZ fuel-cell electrode support of 300 μm and 7 μm thick YSZ electrolyte. In order to prevent YSZ–LSCF reactions, (potentially leading to formation of SrZrO3 as insulating phase at the typical sintering temperatures of LSCF oxygen electrode),22–24 a CGO barrier layer (thickness ≈ 2 μm) was deposited by pulsed laser deposition technique (PLD) on the electrolyte surface. A homogeneous scaffold layer (total thickness ≈ 10–12 μm) of ethanol-based ink of mesoporous CGO (3 wt%) was airbrushed by a spray-coater controlled by a 3D printing frame in x, y and z axes (Print3D Solutions)25 on the oxygen electrode side of the cell located on a heated cell support (≈80 °C) to ensure good reproducibility of the process. The ethanol ink solution was prepared by mixing the as-synthesized CGO mesoporous powder and 1% of a dispersant (polyvinylpyrrolidone (PVP)) in ethanol. After sintering (900 °C for 5 h), a total volume of 30 μL of 0.1 M LSCF perovskite mixed ionic-electronic conductor (MIEC) was infiltrated in the porous CGO, followed by thermal treatment at 800 °C (2 °C min−1) to form a rich TPB nanostructure and functionalize the oxygen electrode. Finally, an ethanol based solution of LSCF commercial powder (Kceracell) was airbrushed on top of the CGO-LSCF oxygen electrode to obtain a 50 μm-layer to function as a current collector. It has been reported12 that LSM infiltration into ceramic backbones improves performance and durability of oxygen electrodes compared with conventional LSM oxygen electrodes. Herein, oxygen electrodes based on the infiltration of LSCF are expected to be promising candidates due to superior ionic conductivity and MIEC behavior of LSCF, leading to increased active catalytic surface area for the oxygen evolution reaction (OER).12Microstructural and electrochemical characterization techniques
Structural characterization of the as-synthesized CGO mesoporous powder was performed using low angle X-ray diffraction (LA-XRD). In order to study the periodic structure of the mesoporous material, Expert-Pro Diffractometer (Cu-Kα1 and Cu-Kα2 radiation) was used. The measurements were performed in a 2θ range between 0.2° and 5°, where the periodicity of the mesoporous structure can be detected due to lattice parameters in the range of tens of nm.Microstructural images of cells were obtained using a Carl ZEISS Auriga scanning electron microscope (SEM) equipped with an energy dispersive X-ray spectroscopy (EDX) detector and a Carl ZEISS Libra 120 was employed for transmission electron microscopy (TEM).
The as-synthetized CGO infiltrated by LSCF phase was analyzed by XRD after calcination at 800 °C. The measurements were recorded on Bruker-D8 Advance equipment using Cu-Kα radiation with a nickel filter and Lynx Eye detector. The measurements were performed at room temperature in 2θ range from 20° to 90°.
Electrochemical tests of the fuel supported cells were carried out in oxidizing (synthetic air) and reducing (H2, H2O and CO2) atmospheres in a commercial ProboStatTM (NorEcs AS) measurement station placed inside a high-temperature tubular furnace. Ceramabond™ (Aremco) paste was used to seal the atmosphere. The cells were electrochemically characterized using a Parstat 2273 from PAR. Electrochemical impedance spectroscopy (EIS) measurements were carried out in a frequency range from 2 MHz to 100 mHz by applying an AC signal of 50 mV of voltage amplitude over OCV and 1.3 V operation voltages. EIS measurements at both voltages were recorded at different operation times. The test station allows for compositional control of water content in the fuel gas inlet mixture. Ultrapure water was controlled by a liquid flow controller (Bronkhorst) and evaporated and mixed with the other gases (H2 and CO2) by a steam generator system.
Results
Characterization of the synthesized mesoporous CGO and infiltrated CGO-LSCF
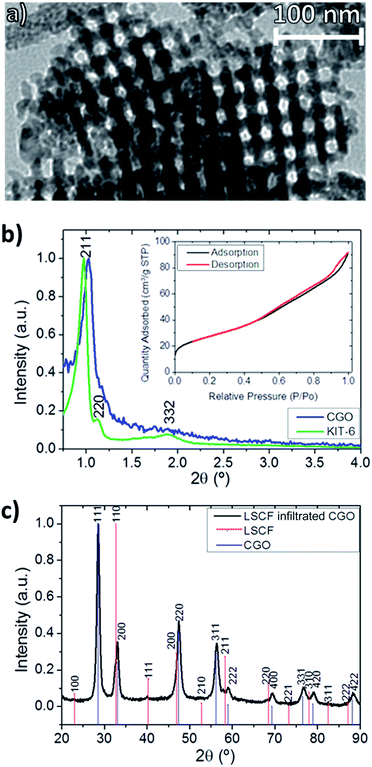
The as-synthesized CGO was microstructurally characterized by TEM. Fig. 1a clearly shows the ordered mesoporosity and periodicity of the as-synthesized powder. Low-angle X-ray diffraction (LA-XRD), included in Fig. 1b, was performed to study the periodicity of the original mesoporous KIT-6 and the CGO replica. As shown in the inset of Fig. 1b, the type IV isotherm, typical of mesoporous materials, can be observed. The low angle range diffraction pattern of the KIT-6 template shows a main sharp diffraction peak at 0.97°, indexed as the (211) plane, and a weak diffraction at 1.12°, indexed as the (220) plane. The CGO replica presents a slightly shifted (211) diffraction peak. The analysis reveals that the ordered mesoporous structure is transferred from the template to the CGO replica, presenting the same group of symmetry (Ia3d).18,26 The calculated value of the repetition-unit lattice parameter, which is the smallest unit of the crystal, is 21 nm (obtained from the position of the (211) diffraction peak). The results of BET (pore size distribution is not shown) indicate the pore size values of 3–4 nm. Both the LA-XRD and BET results are consistent with TEM observations shown in Fig. 1a.The X-ray diffraction (XRD) pattern of the as-synthesized CGO mesoporous powder sintered at 900 °C and later infiltrated by LSCF and sintered up to 800 °C to obtain the CGO-LSCF nanocomposite is presented in Fig. 1c. CGO cubic Fm![[3 with combining macron]](https://www.rsc.org/images/entities/char_0033_0304.gif) m space group and LSCF cubic space group Pm
m space group and LSCF cubic space group Pm![[3 with combining macron]](https://www.rsc.org/images/entities/char_0033_0304.gif) m patterns are indexed to the CGO-LSCF phase. This result confirms the successful synthesis and infiltration of the as-fabricated oxygen nanocomposite electrode.
m patterns are indexed to the CGO-LSCF phase. This result confirms the successful synthesis and infiltration of the as-fabricated oxygen nanocomposite electrode.
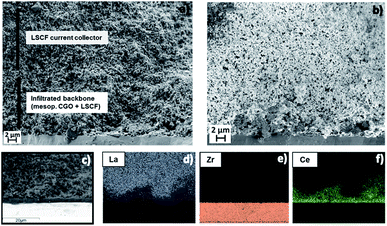
The infiltration process was studied by EDX-SEM in order to confirm proper infiltration of the CGO mesoporous scaffold by LSCF active phase. A cross section micrograph of the oxygen electrode taken by SEM is presented (Fig. 2a). We can notice the configuration of the SOEC oxygen electrode composed of a layer of 10–12 μm of CGO backbone (infiltrated by LSCF) and a standard LSCF layer on top. The SEM micrograph shown in Fig. 2b was obtained employing an InLens detector at low voltage (0.9 keV). With this SEM configuration, it is possible to highlight the electronically conducting regions resulting from LSCF infiltration, exhibiting high brightness.27 We can notice that such areas form active and percolating electronic paths along the electrode functional layer. EDX compositional mapping was also performed. A reference micrograph for the EDX-mapping analysis of the different elements forming each compound is presented in Fig. 2c. The spectra are shown for the most representative elements of each involved phase: La, Zr and Ce signals are displayed in Fig. 2d–f, respectively. It is clearly observed that La (from LSCF) is present within the functional layer of CGO (which can be recognized from the Ce intensity signal). This result confirms the interpenetration between CGO and LSCF compounds and the successful formation of the desired active nanocomposite of CGO-LSCF by a homogeneous and reproducible infiltration process. In addition, it should be noted that the presence of La (and also of Sr, Co and Fe, not shown in the figure) is greater in the top layer, which corresponds to the top electrode layer; conversely, Zr is present only in the electrolyte region. A region with high Ce concentration is also observable at the interface between the electrolyte and oxygen electrode (Fig. 2f), confirming the presence of the CGO barrier layer. Further details on the nanocomposite fabrication procedure through infiltration of mesoporous materials and its characterization by complementary techniques can be found in a previous publication.28
SOEC devices based on infiltrated mesoporous oxygen electrodes were electrochemically characterized by I–V polarization curves and EIS measurements while operating under co-electrolysis conditions at 750 °C. The fuel composition is 45% H2O, 45% CO2, and 10% H2 for the fuel electrode, while synthetic air (97 N mL min−1 cm−2) was employed on the oxygen electrode side. Flow rates of 65 N mL min−1 cm−2 of both H2O and CO2 and 14 N mL min−1 cm−2 of H2 were injected on the fuel electrode; the operation temperature was 750 °C and the cell active area was 1.54 cm2. Fig. 3 shows the injected current density as a function of measured voltage. The open circuit voltage (OCV) of 0.88 V measured at the beginning of the experiment was maintained during co-electrolysis long-term operation. An approximated theoretical OCV for the experimental conditions under consideration can be calculated by application of a model, which encompasses a chemical and electrochemical description and leads to a value of 0.89 V.29 The compositions used for the application of this model were measured by micro gas chromatography. Experimental data reported by Sun et al.30 and Graves et al.31 under the same co-electrolysis gas composition show OCV of 0.89 V at 750 °C and 0.84 V at 850 °C, respectively. These values are in good agreement with our results and with results that can be obtained by applying the Nernst equation,32 thus indicating good sealing of the tested cell. On the galvanostatic polarization curve, current densities higher than 1.2 A cm−2 were injected at 1.4 V. These results are quite remarkable in consideration of other recently published results of a SOEC oxygen electrode based on LSF infiltrating YSZ scaffold, which show injected current densities of 0.56 A cm−2 at a voltage of 1.3 V.32 Similar result of 0.98 A cm−2 were achieved at the same voltage for a cell LSCF infiltrating YSZ scaffold.33
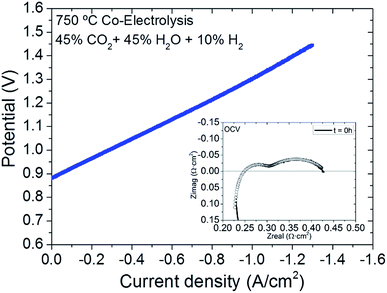 | ||
| Fig. 3 I–V curve and EIS measurement (inset) of a SOEC with mesoporous oxygen electrode tested under co-electrolysis and synthetic air atmospheres at 750 °C, measured at t = 0 h. | ||
The cells were also characterized by electrochemical impedance spectroscopy (EIS) and the initially obtained Nyquist plot at OCV is presented as an inset of Fig. 3. In order to obtain information about the electrochemical processes involved in the electrode polarization resistance, an equivalent circuit applied by Zview software was used for fitting the measured impedance spectra with a viable electrical equivalent circuit LRs(Rp1Q1)(Rp2Q2), consisting of inductance L in series with serial resistance Rs and two contributions to polarization impedance as (RpQ), which correspond to an equivalent circuit composed of resistance and constant phase elements (CPE) in parallel.34Fig. 3 shows the EIS experimental data recorded at OCV at the beginning of the experiment (t = 0 h) and its corresponding fitting by the proposed equivalent circuit. The inductance considers effects of the set-up,35 while the ohmic resistance (Rs) corresponds to the sum of the electrolyte resistance of ionic transfer, electrolyte/electrode contact interface, current collection and contributions from the set-up.33 According to the theoretical YSZ conductivity, operation temperature and thickness of the electrolyte, the theoretical serial resistance value stemming from electrolyte contribution was calculated to be on the order of 0.059 Ω cm2, while that obtained by fitting is 0.220 Ω cm2. This difference between the theoretical and measured Rs can be attributed to other ohmic losses of the sample, such as contact resistance at the interfaces and the resistance contribution of the current collectors and contacts. The Nyquist arcs ascribed to polarization impedances were fitted by considering the contribution of two different (RQ) elements related to two different processes: one at high frequency (HF), Rp1, and the other at low frequency (LF), Rp2. The HF (103 Hz) arc is described as the charge transfer process at the electrodes and interfaces. Arguably, this is dependent on electrocatalytic activity of the composite or electrode/electrolyte interface on the TPB length and on adsorption/desorption processes.13,33,35–37 In this study, it was considered that both electrodes contribute to the charge transfer overpotential characterized. According to literature, Jensen et al. correlated the high frequency range between 1–50 kHz to the contribution of the Ni–YSZ electrode in a Ni–YSZ/YSZ/YSZ–LSM cell measured at 750 °C, similar to the cell tested in the present study.37 However, non-charge transfer processes, occurring in the MIEC oxygen electrode, are also characteristic of frequencies higher than 10−1 Hz, while lower frequencies denote mass transportation electrochemical processes.3–7 Summit frequency values have been reported in Table 1 for Rp1 (charge transfer) and Rp2 (mass transport).
| Time (h) | R s (Ω cm2) | R p1 (Ω cm2) | C p1 (F cm−2) | n 1 | f max (Hz) | R p2 (Ω cm2) | C p2 (F cm−2) | n 2 | f max (Hz) |
|---|---|---|---|---|---|---|---|---|---|
| 0 | 2.20 × 10⁻¹ | 7.62 × 10⁻² | 7.81 × 10⁻⁴ | 7.86 × 10⁻¹ | 2.68 × 10³ | 1.61 × 10⁻¹ | 4.07 × 10⁻¹ | 5.51 × 10⁻¹ | 2.43361 |
| 800 | 2.26 × 10⁻¹ | 1.22 × 10⁻¹ | 4.38 × 10⁻⁴ | 7.97 × 10⁻¹ | 2.98 × 10³ | 1.34 × 10⁻¹ | 1.77 × 10⁻¹ | 6.20 × 10⁻¹ | 6.70424 |
| 900 | 2.30 × 10⁻¹ | 1.18 × 10⁻¹ | 3.95 × 10⁻⁴ | 7.96 × 10⁻¹ | 3.42 × 10³ | 1.39 × 10⁻¹ | 1.76 × 10⁻¹ | 5.91 × 10⁻¹ | 6.50053 |
| 1100 | 2.36 × 10⁻¹ | 9.15 × 10⁻² | 3.93 × 10⁻⁴ | 8.31 × 10⁻¹ | 2.98 × 10³ | 8.36 × 10⁻² | 1.37 × 10⁻¹ | 4.26 × 10⁻¹ | 9.85859 |
| 1300 | 2.83 × 10⁻¹ | 9.52 × 10⁻² | 4.16 × 10⁻⁴ | 7.45 × 10⁻¹ | 4.02 × 10³ | 6.76 × 10⁻² | 1.80 × 10⁻¹ | 5.29 × 10⁻¹ | 13.0832 |
The values obtained from the fitting are 0.076 and 0.160 Ω cm2 for Rp1 and Rp2, respectively. The area specific resistance (ASR) calculated by taking into account all the contributions of the fitted Nyquist results is 0.45 Ω cm2, which is in line with the value of 0.43 Ω cm2 as retrieved by considering the slope of the measured IV polarization curve (cf.Fig. 3).39 The values obtained from the fitting of each parameter of the equivalent circuit, including resistance, capacitances, n values and summit frequencies,38 are presented in Table 1.
Long-term SOEC operation test
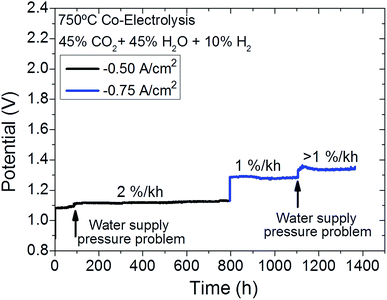
The cell was tested under co-electrolysis atmosphere operating in galvanostatic mode for 1400 h at 750 °C while keeping the same fuel and oxygen electrode gas composition (45% H2O + 45% CO2 + 10% H2/Air) under injected current densities of 0.5 A cm−2 (for the first 800 h) and 0.75 A cm−2 (for the rest of the test) (Fig. 4). The evolution of cell performance can be confirmed by the measured voltage when operated at different current densities (Fig. 4). These changes were also analyzed by Nyquist plots from EIS measurements at OCV (Fig. 5) and 1.3 V recorded at different times during the 1400 h of testing. Finally, Fig. 6 presents the evolution of serial and polarization resistances at 1.3 V at different operation times.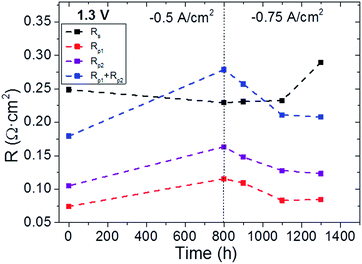 | ||
| Fig. 6 Evolution of serial (Rs) and polarization (Rp1, Rp2, Rp1 + Rp2) resistances with time recorded at 1.3 V. Dashed lines come from interpolation and are only included as guides for the eye. | ||
The degradation test was divided into two parts, characterized by different current densities. During the first 800 h, a current density of 0.5 A cm−2 was applied and the cell showed a degradation rate of ≈2% kh−1, which corresponds to 25 μV h−1 (not considering a water supply issue at t = 90 h). After this first step of 800 h, during which a linear degradation behavior was observed, higher current density of 0.75 A cm−2 was injected, achieving a voltage of 1.3 V that evolved with a degradation rate of ≈1% kh−1 (10 μV h−1). Another water supply issue was the cause of the stepped degeneration of the cell voltage at 1150 h. After this, and while keeping a current density of 0.75 A cm−2, the cell continued showing a degradation rate of ≈0.85% kh−1 (12 μV h−1) until the end of the experiment. Interestingly, higher degradation rates were recorded at injected current density of −0.5 A cm−2 than at −0.75 A cm−2. This can be explained by taking into account the evolution of the microstructure with respect to the initial conditions due to continuous operation under injected current density and co-electrolysis atmosphere. After achieving microstructural stability, the degradation rate decreased although higher current density was injected. These results are comparable with publications of similar state-of-the-art CGO-LSCF cells tested on electrolysis gas atmosphere.40 These remarkably low degradation rates at high current densities confirm the successful application of infiltrated mesoporous materials as functional layers for oxygen electrodes in solid oxide electrolysers. Furthermore, it is also important to note that the main evolution factor for the ASR is ascribed to have been caused by steam supply failures.
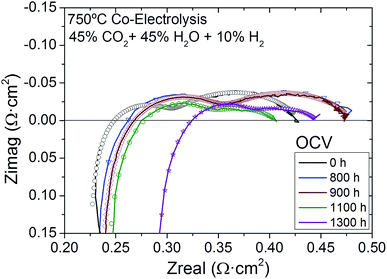
As explained in relation to the initial analysis, the impedance spectra of the fuel supported cell with infiltrated mesoporous CGO-LSCF oxygen electrode were acquired at OCV and 1.3 V at different operating times during 1400 h under co-electrolysis (45% H2O + 45% CO2 + 10% H2) at 750 °C. Fig. 5 shows a Nyquist plot of the impedance spectroscopy data recorded at the beginning of the test (starting point t = 0 h) and at 800 h, 900 h, 1100 h and 1300 h of operation at OCV, together with each corresponding fitting obtained using the same equivalent circuit as explained above. The study of this plot reveals higher increase of the serial resistance with operation time than that observed for electrode polarization resistance. By fitting the experimental impedance data with the LRs(Rp1Q1)(Rp2Q2) equivalent circuit, two different contributions to the total resistance were deconvoluted (see Table 1). The inductance values obtained from fitting all the EIS measured at OCV are in the same order of magnitude, i.e., 10−7 H. Initially, a value of 0.220 Ω cm2 was measured for the serial resistance, which increased to 0.283 Ω cm2 after 1300 h of operation. This change indicates an increase from 37% to 53% of the serial resistance contribution to the total resistance, which is in agreement with the trend observed in Fig. 5. Rp1, which was attributed to the charge transfer process, increased in the first 800 h and slightly decreased afterwards (despite the increased current density). Conversely Rp2, which is dominated by mass transport processes, decreased its contribution to the total resistance from initial 0.16 Ω cm2 to 0.067 Ω cm2, indicating a decrease of its contribution to the total resistance from 42% to 19% during the experiment. Overall, the contribution of the polarization resistance to the total resistance as sum of Rp1 and Rp2 decreased from an initial 62% to a final 47%.
EIS measurements recorded during the experiment at 1.3 V have also been fitted employing the same LRs(Rp1Q1)(Rp2Q2) electrical equivalent circuit. Fig. 6 presents the evolution of serial and polarization resistances during the operating time. It is worth remembering that −0.5 A cm−2 was injected for the first 800 h; then, the current density was increased to −0.75 A cm−2 until the end of the experiment. It is observed that serial resistance only slightly increased from 800 h to 1100 h of operation, while drastic increase was seen from 1100 h to the end of the experiment. Conversely, both contributions to polarization resistance exhibited similar trend during the longterm durability test, i.e., both electrodes showed decreased resistance during operation time, achieving lowest values in the EIS recorded at t = 1300 h right before the end of the experiment. This indicates that the activity of the electrodes should not be considered the main degradation cause of the cell. Rather, the serial resistance is responsible. These results at the operation voltage (1.3 V) are in very good agreement with the results recorded at OCV.
Postmortem microstructural characterization
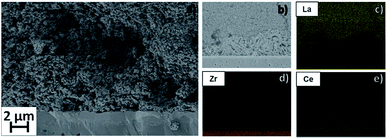
The microstructure of the oxygen electrode attached to the electrolyte after operation for 1400 h was analyzed by SEM imaging. The goal was to determine the causes of the evolution of serial resistance that leads to the decrease in cell performance with operation time, while activity of the electrodes is maintained. A cross-section micrograph is presented in Fig. 7a, where it is possible to observe that the mesoporous structure is perfectly attached to the barrier layer after being exposed to injected current densities higher than 1.2 A cm−2 and after operating at long term (1400 h) between current densities of 0.5 A cm−2 and 0.75 A cm−2. Fig. 7b enables us to recognize the composition of the oxygen electrode. The darker layer at the bottom corresponds to the electrolyte and the bright area on top is the dense CGO barrier layer. Two different microstructures are observable on top: the infiltrated CGO mesoporous structure presents higher porosity than the dense LSCF current collector layer.The stability of the functional oxygen electrode was also studied by SEM coupled to EDX mappings of La, Zr and Ce (Fig. 7c–e) as representative elements of LSCF, YSZ and CGO, respectively. These maps can be compared with those presented in Fig. 2 in order to retrieve information on the stability of the oxygen electrode functional layer. It can be clearly seen that the oxygen electrode remains well attached while maintaining its porous structure and LSCF is still homogenously functionalized on the CGO scaffold even after operation. These results indicate that the as-fabricated oxygen electrode is a recommended architecture for long-time application of SOEC thanks to its high stability.
In light of the high stability of the oxygen electrode/electrolyte interface microstructure, the increase in serial resistance measured at OCV and 1.3 V and the reported degradation rate after 1400 h of operation should not be ascribed to such a cell element. Fig. 8 presents a comparison of an image of the interface of the electrolyte and the fuel electrode using different SEM detectors. Fig. 8a was acquired using a secondary electron detector in order to observe the microstructure and its topography. It confirms that the interface between electrolyte and electrodes has not been damaged. The micrographs shown in Fig. 8b were obtained using an Inlens SEM detector. As has been previously explained, this detection mode allows highlighting of the electronic percolation path of the electrode.27 Taking into account that the percolating Ni path appears in bright color, it is possible to observe that most of the percolation has been lost in the area next to the electrolyte. Moreover, Ni is agglomerated, thus hindering the circulation of electrons for the oxidation of 2H+ to H2. The inset micrograph shows that contact between the fuel electrode and electrolyte has been lost in some points of the interface. Since the YSZ of the composite has remained as the only active species in this area, the functional layer of the porous fuel electrode has become a purely anionic conducting zone, thus increasing the ohmic contribution of the resistance due to an increase in effective electrolyte thickness. These microstructural changes explain the progressive increase in serial resistance that was measured by EIS and can be observed in Fig. 5 and 6. Although the thickness of the active fuel electrode decreased, the rest of the fuel electrode continued working properly in the reduction of H2O and CO2. This explains the stable contribution of the polarization resistance recorded at OCV and 1.3 V, as observed in Fig. 5 and 6.
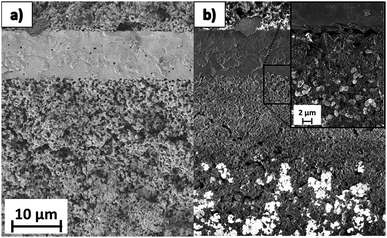 | ||
| Fig. 8 Cross section of the interface between the fuel electrode and the electrolyte of the cell after 1400 h of operation taken using (a) secondary electron (SE2) and (b) Inlens SEM detectors. | ||
Since the Ni–YSZ composite of the fuel electrode plays an important role in SOC performance, different models have been proposed in order to explain the degradation of this electrode in fuel and electrolysis mode.41–45 The loss of Ni percolation close to the Ni–YSZ fuel electrode/electrolyte interface under operation at high injected current densities has been reported.41 As a consequence, both the ionic and electronic conducting phases needed for electrochemical reduction of the H2O and CO2 molecules are moved toward the Ni–YSZ support electrode and a coarsening of Ni particles is reported in this electrochemically active area located far from the electrolyte/fuel electrode interface. This explains the increase of ohmic resistance (Rs) reported on EIS measured at different times along the long-term experiment.
The microstructural characterization presented in Fig. 8, compared to the typical degradation mechanisms of the Ni–YSZ electrode reported in the literature provide an explanation for the degradation rates recorded during the electrochemical characterization. The loss of percolation path and Ni agglomeration (Fig. 8) is a consequence of the SOEC long-term operation under high current densities, and is probably aggravated by the reported steam supply problems. As a consequence, the cell underwent progressive increase in serial resistance (as shown in Fig. 5 and 6) and exhibited the degradation rate reported in Fig. 4, although the rest of the Ni–YSZ electrode was not degraded and continued working properly.
Conclusions
A novel approach for developing high performing and durable oxygen electrodes for solid oxide electrolysis cells in co-electrolysis of H2O and CO2 was presented. A comprehensive analysis of structural characterization of infiltrated LSCF-mesoporous CGO nanocomposites working as an oxygen electrode in fuel-electrode supported electrolysis cells with YSZ electrolyte was carried out by means of different techniques, such as BET, electron microscopy (SEM and TEM) and XRD, demonstrating the successful application of the synthesis and infiltration procedures for fabricating the electrolysis cells. Stability of the infiltrated mesoporous electrode was confirmed by SEM-EDX analysis of the electrode before and after cell operation in high temperature co-electrolysis mode. According to the obtained I–V polarization curve, a remarkably high current density of 1.2 A cm−2 was injected at 1.4 V for a realistic gas composition of 45% H2O, 45% CO2 and 10% H2 at 750 °C. Mid-term operation studies for more than 1400 h were carried out, showing remarkably low degradation rates of 2% kh−1 and <1% kh−1 at current densities of 0.5 A cm−2 and 0.75 A cm−2, respectively.The EIS analysis revealed an increase in total resistance during the mid-term test. According to the deconvolution of the impedance spectra, this increase in total resistance is mainly due to evolution of the ohmic contribution associated with loss of percolation in the fuel electrode, at the highest current density. This degradation mechanism is confirmed by the post-mortem SEM analysis of the interface between the fuel-cell electrode and the electrolyte, where loss of percolation due to deactivation of Ni particles from the Ni–YSZ functional layer is clearly observed. In contrast, a continuous improvement in the performance of the LSCF-CGO infiltrated mesoporous oxygen electrode, which is the object of this study, can be observed during operation at 0.75 A cm−2, similar to that reported in previous studies for mesoporous materials operating in SOFC mode.
These results show the high potential of infiltrated mesoporous ceramic composites as high performing and more importantly, long lasting materials for oxygen electrodes operating in solid oxide electrolysis cells in co-electrolysis mode.
Conflicts of interest
There are no conflicts to declare.Acknowledgements
The research leading to these results has received funding from the European Union’s Horizon 2020 framework program (H2020) for the Fuel Cells and Hydrogen Joint Technology Initiative under grant agreement no. 699892 (ECo project). Authors would like to thank HTceramix/SolidPower for delivering half-cells within the framework of the ECo project. Authors also acknowledge to the 3DMADE project under grant DESPEGA_3DMADE ENE2016-74889-C4-1-R.Notes and references
- M. Samavati, M. Santarelli, A. Martin and V. Nemanova, Energy, 2017, 122, 37–49 CrossRef.
- C. M. Stoots, J. E. O'Brien, J. S. Herring and J. J. Hartvigsen, J. Fuel Cell Sci. Technol., 2009, 6, 11014 CrossRef.
- Z. Zhan, W. Kobsiriphat, J. R. Wilson, M. Pillai, I. Kim and S. a. Barnett, Energy Fuels, 2009, 23, 3089–3096 CrossRef.
- Q. Fu, C. Mabilat, M. Zahid, A. Brisse and L. Gautier, Energy Environ. Sci., 2010, 3, 1382–1397 Search PubMed.
- M. Torrell, S. García-Rodríguez, A. Morata, G. Penelas and A. Tarancón, Faraday Discuss., 2015, 182, 241–255 RSC.
- L. Almar, T. Andreu, A. Morata, M. Torrell, L. Yedra, S. Estradé, F. Peiró and A. Tarancón, J. Mater. Chem. A, 2014, 2, 3134–3141 Search PubMed.
- S. D. Ebbesen, X. Sun and M. B. Mogensen, Faraday Discuss., 2015, 182, 393–422 RSC.
- P. Moçoteguy and A. Brisse, Int. J. Hydrogen Energy, 2013, 38, 15887–15902 CrossRef.
- A. V. Virkar, Int. J. Hydrogen Energy, 2010, 35, 9527–9543 CrossRef.
- T. Jacobsen and M. Mogensen, ECS Trans., 2008, 13, 259–273 Search PubMed.
- R. Knibbe, M. L. Traulsen, A. Hauch, S. D. Ebbesen and M. Mogensen, J. Electrochem. Soc., 2010, 157, B1209–B1217 CrossRef.
- J. T. S. Irvine, D. Neagu, M. C. Verbraeken, C. Chatzichristodoulou, C. Graves and M. B. Mogensen, Nat. Energy, 2016, 1, 1–13 Search PubMed.
- A. Hauch, K. Brodersen, M. Chen and M. B. Mogensen, Solid State Ionics, 2016, 293, 27–36 CrossRef.
- D. Ding, X. Li, S. Y. Lai, K. Gerdes and M. Liu, Energy Environ. Sci., 2014, 7, 552–575 Search PubMed.
- M. Torrell, L. Almar, A. Morata and A. Tarancón, Faraday Discuss., 2015, 182, 423–435 RSC.
- Y. Wang, Z. Yang, M. Han and J. Chang, RSC Adv., 2016, 6, 112253–112259 RSC.
- L. Almar, A. Morata, M. Torrell, M. Gong, T. Andreu, M. Liu and A. Tarancón, Electrochim. Acta, 2017, 235, 646–653 CrossRef.
- L. Almar, B. Colldeforns, L. Yedra, S. Estradé, F. Peiró, A. Morata, T. Andreu and A. Tarancón, J. Mater. Chem. A, 2013, 1, 4531–4538 Search PubMed.
- L. Almar, A. Morata, M. Torrell, M. Gong, M. Liu, T. Andreu and A. Tarancón, J. Mater. Chem. A, 2016, 4, 7650–7657 Search PubMed.
- H. Yang and D. Zhao, J. Mater. Chem., 2005, 15, 1217–1231 Search PubMed.
- J. L. M. Rupp, A. Infortuna and L. J. Gauckler, Acta Mater., 2006, 54, 1721–1730 CrossRef.
- C. Endler, A. Leonide, A. Weber, F. Tietz and E. Ivers-Tiffée, J. Electrochem. Soc., 2010, 157, B292–B298 CrossRef.
- J. Laurencin, M. Hubert, D. F. Sanchez, S. Pylypko, M. Morales, A. Morata, B. Morel, D. Montinaro, F. Lefebvre-Joud and E. Siebert, Electrochim. Acta, 2017, 241, 459–476 CrossRef.
- D. The, S. Grieshammer, M. Schroeder, M. Martin, M. Al Daroukh, F. Tietz, J. Schefold and A. Brisse, J. Power Sources, 2015, 275, 901–911 CrossRef.
- Print3DSolutions, http://print3dsolutions.net/la-empresa/equipos/.
- F. Kleitz, S. Hei Choi and R. Ryoo, Chem. Commun., 2003, 2136–2137 RSC.
- A. Hauch, P. S. Jørgensen, K. Brodersen and M. Mogensen, J. Power Sources, 2011, 196, 8931–8941 CrossRef.
- L. Almar, B. Colldeforns, L. Yedra, S. Estradé, F. Peiró, A. Morata, T. Andreu and A. Tarancón, J. Mater. Chem. A, 2013, 1, 4531–4538 Search PubMed.
- L. Bernadet, J. Laurencin, G. Roux, D. Montinaro, F. Mauvy and M. Reytier, Electrochim. Acta, 2017, 253, 114–127 CrossRef.
- X. Sun, M. Chen, P. Hjalmarsson, S. D. Ebbesen, S. H. Jensen, M. Mogensen and P. V. Hendriksen, J. Electrochem. Soc., 2013, 160, F1074–F1080 CrossRef.
- C. Graves, S. D. Ebbesen and M. Mogensen, Solid State Ionics, 2011, 192, 398–403 CrossRef.
- H. Fan, Y. Zhang and M. Han, J. Alloys Compd., 2017, 723, 620–626 CrossRef.
- H. Fan, M. Keane, N. Li, D. Tang, P. Singh and M. Han, Int. J. Hydrogen Energy, 2014, 39, 14071–14078 CrossRef.
- A. Nechache, M. Cassir and A. Ringuedé, J. Power Sources, 2014, 258, 164–181 CrossRef.
- L. dos Santos.Gómez, J. M. Porras-Vázquez, E. Losilla, F. Martín, J. R. Ramos-Barrado and D. Marrero-López, J. Power Sources, 2017, 347, 178–185 CrossRef.
- R. Barfod, M. Mogensen, T. Klemenso, A. Hagen, Y.-L. Liu and P. Vang Hendriksen, J. Electrochem. Soc., 2007, 154, B371–B378 CrossRef.
- S. H. Jensen, A. Hauch, P. V. Hendriksen, M. Mogensen, N. Bonanos and T. Jacobsen, J. Electrochem. Soc., 2007, 154, B1325–B1330 CrossRef.
- A. Nechache, A. Mansuy, M. Petitjean, J. Mougin, F. Mauvy, B. A. Boukamp, M. Cassir and A. Ringuedé, Electrochim. Acta, 2016, 210, 596–605 CrossRef.
- A. Mahmood, S. Bano, J. H. Yu and K. H. Lee, Energy, 2015, 90, 344–350 CrossRef.
- F. Tietz, D. Sebold, A. Brisse and J. Schefold, J. Power Sources, 2013, 223, 129–135 CrossRef.
- M. B. Mogensen, A. Hauch, X. Sun, M. Chen, Y. Tao, S. D. Ebbesen, K. V. Hansen and P. V. Hendriksen, Fuel Cells, 2017, 17, 434–441 CrossRef.
- M. Torrell, A. Morata, P. Kayser, M. Kendall, K. Kendall and A. Tarancón, J. Power Sources, 2015, 285, 439–448 CrossRef.
- M. Pihlatie, A. Kaiser, P. H. Larsen and M. Mogensen, J. Electrochem. Soc., 2009, 156, B322–B329 CrossRef.
- V. Papaefthimiou, D. K. Niakolas, F. Paloukis, D. Teschner, A. Knop-Gericke, M. Haevecker and S. Zafeiratos, J. Catal., 2017, 352, 305–313 CrossRef.
- Y. Tao, S. D. Ebbesen and M. B. Mogensen, J. Power Sources, 2016, 328, 452–462 CrossRef.
| This journal is © The Royal Society of Chemistry 2018 |

