
 Open Access Article
 This Open Access Article is licensed under a
 Creative Commons Attribution 3.0 Unported Licence
The synergistic effect of cobalt oxide and Gd-CeO2 dual infiltration in LSCF/CGO cathodes†
R. I.
Tomov
 *a,
T. B.
Mitchel-Williams
a,
R.
Maher
c,
G.
Kerherve
c,
L.
Cohen
c,
D. J.
Payne
c,
R. V.
Kumar
a and
B. A.
Glowacki
ab
*a,
T. B.
Mitchel-Williams
a,
R.
Maher
c,
G.
Kerherve
c,
L.
Cohen
c,
D. J.
Payne
c,
R. V.
Kumar
a and
B. A.
Glowacki
ab
aDepartment of Materials Science & Metallurgy, University of Cambridge, Cambridge, UK. E-mail: rit21@cam.ac.uk
bInstitute of Power Engineering, 02-981 Warsaw, Poland
cImperial College, London, UK
First published on 5th March 2018
Abstract
La0.6Sr0.4Co0.2Fe0.8O3−δ/Ce0.9Gd0.1O1.9 composite cathodes were nano-engineered via “dual” inkjet printing infiltration of nitrate salt solutions in a single step procedure. After calcination in air at 700 °C the cathodes were decorated with Ce0.9Gd0.1O1.9 and CoxOy nanoparticles (∼20 nm in size). The effects of the as-created nano-decoration on the electrochemical activity and the performance stability in the intermediate temperature range (500–700 °C) were investigated. The nano-engineered microstructure was found to extend the active three-phase boundary and to promote adsorption–dissociation–surface exchange reactions. Electrochemical impedance tests conducted on symmetric cells showed a reduction in the polarisation resistance of between 1.5 and 7.0 times depending on temperature (500–700 °C). High-resolution X-ray photoelectron spectroscopy and in situ high temperature Raman spectroscopy were used to study aging and thermal cycling effects on the cathodes' surface chemistry. Aging tests of the infiltrated electrodes up to 100 hours in air revealed an enhanced stability of the decorated electrodes ascribed to the suppression of SrO surface segregation. This work demonstrated that the sequence of infiltration of both inks introduces noticeable differences in the oxygen reduction reaction.
1. Introduction
The future of the international accord on mitigating the impact of climate change is dependent on the successful commercialisation and implementation of renewable energy technologies. Solid oxide fuel cells (SOFCs) are considered an important component for managing sustainable energy supplies due to their high theoretical efficiency, fuel flexibility and combined heat and power generation.1–5 However, the anticipated commercialisation of SOFCs is currently hindered by their high production and operating costs and insufficient durability, primarily due to the high operating temperatures. Temperatures above 800 °C restrict the choice of interconnect and sealing materials and reduce the lifetime of the stack due to the accelerated deterioration of its components.6 A reduction of the operating temperature is considered critical for the commercialisation of SOFC technology. It would facilitate the use of less expensive ferritic steels for interconnects and cell supports and the utilisation of conventional sealing techniques, thus substantially reducing the production costs. It will also mitigate stack degradation issues related to inter-diffusion between cell components as well as enabling rapid start-up and repeated thermal cycling.7–9 However, lowering the operating temperature also leads to reduction in SOFC electrochemical performance due to increased Ohmic and polarisation losses associated with the drop in ion conductivity and the sluggish electrode kinetics that becomes critical in the intermediate temperature SOFC (IT-SOFC) cathodes (below 800 °C).10–12 One of the most widely pursued strategies to solve the problem is to use a mixed ion–electron conductor (MIEC) instead of the classical electronic conductor cathode, e.g., La1−xSrxMnO3−δ, in order to extend the active zones for the oxygen reduction reaction (ORR) beyond the three-phase boundary (TPB).13 Promising performances in IT-SOFCs have been achieved for cathodes based on perovskite mixed ionic–electronic conductor (MIEC) materials, such as La1−xSrxCoO3−δ (LSC),14 La1−xSrxFeO3−δ (LSF),15 or La1−xSrxCo1−yFeyO3−δ (LSCF).16 LSCF is currently the SOFC material of choice for temperatures below 800 °C due to the combination of high electronic (∼340 S cm−1 at 550 °C)17 and high oxygen ionic conductivity (∼1 × 10⁻¹ S cm−1 at 800 °C in air). Using isotopic exchange depth-profiling, Esquirol et al.18 reported that LSCF/Ce0.9Gd0.1O2−x (CGO) composite cathodes offer further improvement at temperatures below 650 °C. At these temperatures, as the oxygen diffusivity of LSCF is lower than that of CGO by one to two orders of magnitude, the ionic conductivity is dominated by the fluorite CGO phase while electronic conduction is typically contributed by the perovskite-structured phase (LSCF).19 Adversely La1−xSrxCo1−yFeyO3−δ based cathodes have been found to suffer from substantial long-term degradation,20–23 at their operating temperatures. The effect is frequently associated with Sr enrichment of the surface leading to suppressed oxygen surface exchange kinetics due to the insulating nature of SrO (Sr(OH)2 and SrCO3) species. The Sr species block the ORR active sites or passivate the entire surface of the cathode and the segregation is accompanied by a reduction in transition metal concentration.24,25 The underlying mechanism of the observed instability is not yet clearly understood although a number of possible hypotheses have been proposed, among which are kinetic de-mixing due to the greater mobility of Sr than other cations26 and surface charge effects due to electrostatic contributions.27 In a first principles study, Ding et al.20 identified two basic thermodynamic driving forces for Sr segregation – strain relaxation and smaller surface charge of SrO-terminated surfaces in comparison with LaO-terminated surfaces. The authors suggested two possible approaches for the suppression of Sr surface segregation – applying compressive strain and reducing surface charge via doping of the cathode material lattice and/or depositing additional surface coatings. A number of detailed experimental studies on surface segregation and modification of well-defined thin film cathodes have been published recently.28–30 Rupp et al.28 used real-time impedance monitoring to find that applying only ∼4% of a SrO monolayer on the LSC thin film electrode surface via single laser pulse deposition led to its severe deactivation. The experiment revealed that LSC surfaces could be inhomogeneous with respect to the ORR, with only a few highly active sites, which can be deactivated by the Sr ions diffusing and adhering to those areas. Vice versa, decoration by one pulse of Co-oxide (corresponding to ∼2% of a monolayer) enhanced the oxygen exchange kinetics of the LSC base film by about 13%. The authors have shown that the accessibility of Co at the surface strongly improves the oxygen exchange kinetics but the effect depends on the thickness of the underlying SrO. Conversely, in a similar experiment reported earlier, Mutoro et al.29 and Crumlin et al.26 observed that “Sr”-decoration with nanoparticle coverage in the range from 50% to 80% of the LSC surface enhanced the surface exchange coefficient by an order of magnitude while “La”-decoration and “Co”-decoration led to either no change or reduction in the surface exchange coefficients. In a comprehensive first-principles study on oxygen reduction and migration on LSCF cathodes, Wang et al.31 postulated that SrCoO-terminated surfaces have the smallest oxygen vacancy formation energy. The existence of oxygen vacancies was shown to promote a barrier-less dissociation of peroxide species. They also confirmed that B-site metal atoms (Co or Fe) are more reactive than A-site atoms (La or Sr). Based on these experimental and theoretical studies it is clear that the mechanism of the oxygen reduction reaction on cobaltite-based cathodes is strongly dependent on the surface morphology of the co-existing A-site and B-site metal atoms. Numerous experimental studies have shown that bulk LSCF cathodes prepared by using conventional ceramic technologies are terminated by a SrO layer22 with inhomogeneous surface segregation under aging and formation of thicker islands.32 The formation of other secondary phases such as Sr(OH)2 and SrCO3 as reaction products during aging was also commonly observed. By using ambient-pressure X-ray absorption and photoelectron spectroscopy, Tsvetkov et al.33 studied the effect of surface decoration of perovskite oxides with less reducible cations and found that their dominant role was to suppress the enrichment and phase separation of Sr via a reduction of surface vacancy concentration. Despite findings by Ding et al.20 that localised Co doping can induce tensile strain enhancing the surface Sr segregation, several studies reported the enhancement of cathode performance by infiltration of CoxOy nanoparticles. Li et al.34 found that surface infiltration of LSF electrodes by Co(NO3)2 solution significantly suppressed Sr segregation. An enhancement of the performance in the 600–800 °C range via infiltration of CoxOy particles into a LSM/YSZ scaffold was reported by Imanishi et al.35 Cox-Galhotra et al. reported that LSCF6428 electrodes modified with Co(NO3)2 exhibited no observable changes in surface exchange coefficients and bulk diffusion coefficients when compared to the unmodified ones.36 Choi et al. modified LSC electrodes with CoxOyvia atomic layer deposition.37 They found that after annealing at 600 °C for 4 hours in air, the CoxOy-treated cathodes showed lower power density than those of the bare cells. The apparent disparity in the reported data demonstrated the importance of other factors in the ORR promotion by infiltration – most likely the loading level and the surface morphology of infiltrated nano-decorations.Aggravating the problem is the inherent instability of infiltrated metal nano-promoters, which tend to agglomerate at operating temperatures due to the large surface energy associated with nanoparticles. Using sintering inhibitors (e.g., ZrO2, CeO2, and Ce0.9Gd0.1O1.95) is a common approach to alleviate the stability problem and to prolong the lifetime of infiltrated electrodes. In this approach, the inhibitor nanoparticles are distributed on the scaffold surface separating the catalyst particles and effectively preventing their coalescence. Recently, Burye et al.38 reported a reduction of La0.6Sr0.4Co0.2Fe0.8O3−x cathode's polarisation resistance to 0.1 Ω cm2 at 540 °C and stable performance of the as-prepared cathodes by dual infiltration of CGO and LSCF inks into a porous CGO scaffold. Imanishi et al.35 reported that dual infiltration of Co(NO3)2 and Ce(NO3)3 into a LSM/YSZ cathode effectively suppressed the aggregation of the fine particles of Co3O4. No significant degradation of the catalytic activity of the co-infiltrated LSM-YSZ electrode was observed at 800 °C for 100 hours. Wang et al.39 enhanced the electrochemical performance of LSM/YSZ cathodes with co-infiltration of PdO and ZrO2 observing that uniformly deposited PdO particles are surrounded by ZrO2 nanoparticles. This distinctive microstructure was found to hinder the agglomeration and growth of PdO particles. Chemical interaction between LSCF and CGO has been reported to be negligible with low solubility of Ce and Gd in the perovskite.40 The results on the interaction of diffusion couples of LSCF and CGO presented by Zhang41 confirmed that there was no direct reaction between the two materials. No dissolution of Sr, Fe and Co into CGO was found. The dissolution of La into the fluorite phase was detected only at high temperatures conventionally used for cell manufacturing (>1000 °C).
This work reports on the utilisation of commercial inkjet printing for dual, sequential infiltration of porous LSCF/CGO electrodes with cobalt oxide (CoxOy) and Ce0.9Gd0.1O1.95 (CGO). CoxOy nanoparticles were expected to accelerate the adsorption–dissociation–surface exchange reactions of oxygen. Multiple roles were envisaged for CGO – (i) a sintering inhibitor for CoxOy nanoparticles, (ii) enhancement of the TPB length and ORR site density and (iii) a Sr surface segregation inhibitor through the introduction of localised compressive strain at the interface with LSCF.42 The objective of the current work was to explore the role of the infiltration sequence of the precursors into the LSCF/CGO composite cathodes via inkjet printing. Inkjet printing was chosen for both the fabrication of the electrodes and the infiltration itself. Drop-on-demand (DoD) inkjet printing (IJP) is a simple and cost-effective non-contact “wet” technique applicable for a variety of surfaces including very thin, fragile or non-even porous electrodes. It can reproducibly dispense droplets in the range of pL to nL volumes at high rates (kHz). DoD IJP allows excellent thickness and uniformity control and introduces the possibility of printing 2D and 3D patterns as well as delivering precursors into porous scaffolds with a high level of accuracy. IJP systems offer a wide scale of application, from experimental platforms working with customised inks to mass manufacturing systems that can print rapidly and competitively on an industrial scale. This technology is cost effective and environmentally friendly due to waste minimisation of the ink. The production of anodes and electrolyte coatings with a Domino print head was reported previously by Tomov et al.43 and Wang et al.44 using suspension inks. Wang et al.45 deposited CGO electrolytes on NiO/YSZ cermet anodes using sol–gel based precursor solutions. Tomov et al.42 used inkjet printing infiltration to produce CGO nano-decorated LSCF/CGO cathodes. They found that the infiltrated electrodes showed enhanced stability when aged for 60 hours in air, which was ascribed to the suppression of SrO surface segregation.
2. Methodology
The nano-decoration of porous SOFC electrodes via infiltration is a multistage process involving the formation of porous scaffolds in the first stage. The second stage is the infiltration of the precursor inks. The inks are often tailored with suitable surfactants and gelling agents in order to achieve the desired control over the phase and morphology of the infiltrated nanoscale product – particle size, distribution, coverage, etc. Commonly, the second stage is performed in multiple steps in order to achieve the desired loading levels. Vacuum treatments are often implemented after each ink delivery step. The calcination of the infiltrate is the third stage, which, in some cases, is done after each loading step of the second stage. In a laboratory environment, such an infiltration procedure is usually performed using micro-pipettes or sample immersion. This process is cumbersome and slow, often resulting in non-uniform distribution (both lateral and in-depth) and wastage of expensive inks. Few attempts have been reported on scaling up the procedure in order to achieve compatibility with conventional ceramic SOFC production routes. Lee et al.46 infiltrated anodes with CGO by applying the precursor solution to a foam roller, which was then applied onto a porous anode functional layer. Kiebach et al.47 infiltrated stacks of anode supported SOFCs by “flushing” an aqueous solution containing metal nitrates and surfactants through the manifold compartments. Although providing scalability, both methods have little control over the infiltration process and can lead to substantial non-uniformities and wastage of ink. Mitchell-Williams et al.48 recently demonstrated the feasibility of CGO nano-infiltration into thick, commercial SOFC anodes with a simple, low-cost and industrially scalable inkjet printing procedure. In this study, infiltrated nano-decorations were created by consistently depositing nano-litre droplets with micrometre spatial resolution onto a porous scaffold surface ensuring high reproducibility between different samples. An optimisation of the jetting parameters enabled infiltration uniformity with practically no wastage of ink.3. Experimental
Cathode symmetric cells were produced by IJP of LSCF/CGO composite inks on in-house prepared CGO electrolyte pellets (diameter – 10 mm; thickness – 0.6 mm). The cells were sintered in air at 1000 °C for 2 hours with heating and cooling rates of 5 °C min−1. The final thickness of the cathode was ∼20 μm. CGO and cobalt oxide (CoxOy) precursor solutions were synthesised by dissolving stoichiometric amounts of nitrates salts in ethanol and adding urea as a complexing agent. The loading levels of both LSCF and CGO infiltrates were adjusted to ∼5 wt% with respect to the LSCF/CGO electrode using single step IJP infiltrations without intermediate high temperature treatments or vacuum assistance. Two types of sequential infiltrations were performed: (i) CGO infiltration – calcination – CoxOy infiltration – calcination (denoted further as CGO![[thin space (1/6-em)]](https://www.rsc.org/images/entities/char_2009.gif) :CoxOy); and (ii) CoxOy infiltration – calcination – CGO infiltration – calcination (denoted further as CoxOy:CGO). All calcinations were done at 700 °C for 1 hour in air. For more details on the preparation and IJP procedures of the inks and cells, see the “Experimental” section in the ESI.†
:CoxOy); and (ii) CoxOy infiltration – calcination – CGO infiltration – calcination (denoted further as CoxOy:CGO). All calcinations were done at 700 °C for 1 hour in air. For more details on the preparation and IJP procedures of the inks and cells, see the “Experimental” section in the ESI.†
Two-electrode Electrochemical Impedance Spectroscopy (EIS) was used to study the polarization resistance of the symmetric cells at temperatures of 500, 550, 600, 650 and 700 °C in air within a frequency range of 0.1 Hz to 1 MHz with a 10 mV amplitude AC signal (Autolab PGSTAT302N, Metrohm Autolab B.V.). The samples were tested in their initial as-prepared state and again after a total effective aging time of 100 hours at 650 °C.
The microstructure of the aged cathodes was characterised using high resolution SEM (FEI Nova NanoSEM) with an acceleration voltage of 15 kV. The cells were fractured and the cross section was sputter coated with palladium to prevent charging. The surface chemistry and the electronic structure of the composite cathode after aging were characterized using high-resolution X-ray photoelectron spectroscopy (XPS). The spectra were recorded on a Thermo Scientific K-Alpha+ X-ray photoelectron spectrometer operating at 2 × 10⁻⁹ mbar base pressure. This system incorporates a monochromated microfocused Al Kα X-ray source (hν = 1486.6 eV) and an 180° double focusing hemispherical analyser with a 2D detector. The X-ray source was operated at 6 mA emission current and 12 kV anode bias providing an X-ray spot size of up to 400 μm2. Survey spectra were recorded at 200 eV pass energy and 20 eV pass energy for core level spectra, and 15 eV pass energy for valence band spectra. A flood gun was used to minimize the sample charging that occurs when exposing an insulated sample to an X-ray beam. The quantitative XPS analysis was performed using Avantage software. High temperature (up to 700 °C) in situ Raman spectroscopy was employed for the identification of the structural changes occurring during thermal cycling of the infiltrated cathodes. For this purpose, two additional sets of infiltrated electrodes were prepared – (i) CGO infiltration – calcination – CoxOy infiltration; and (ii) CoxOy infiltration – calcination – CGO infiltration. The second infiltrates were only dried at 200 °C before the Raman spectroscopy characterization. An additional CoxOy reference sample (denoted as CoxOy−REF) was prepared by printing and drying a thick layer of CoxOy on top a CGO dense pellet. The design of the high temperature Raman rig is described elsewhere in detail.49 Current collection was performed by applying a small amount of gold paste between the gold mesh and the electrode on both sides. In situ measurements were performed using a Horiba Jobin Yvon LabRAM 800 HR Raman spectrometer. All spectra were collected using a 514 nm argon ion laser. Incident laser power was maintained at ∼5 mW throughout all measurements to ensure that laser interaction with the surfaces was minimised. Raman spectral peaks were fitted and integrated using Renishaw Wire 2 software with further analysis being performed in OriginLab.
4. Results and discussion
Fig. 1 shows typical SEM cross-sectional images of the LSCF/CGO composite cathode surfaces before and after testing and aging for 100 hours at 650 °C in air. Fig. 1(a) presents a low-resolution cross-sectional image of an infiltrated LSCF/CGO cathode with an approximate thickness of 20 μm. The morphology of the as-calcined dual infiltrated cathode (CGO infiltrated first and CoxOy infiltrated second) is shown in Fig. 1(b). Images of the infiltrated cathodes aged for 100 hours are presented in Fig. 1 (c) to (d) – infiltrated only with CoxOy (Fig. 1(c)), infiltrated only with CGO (Fig. 1(d)), dual infiltrated with CGO first and CoxOy second (Fig. 1(e)) and dual infiltrated with CoxOy first and CGO second (Fig. 1(f)). The procedures of infiltration, testing and aging are described in the ESI.† The porous backbone of the composite cathode was found to be uniform in terms of microstructure and grain size, with well interconnected LSCF and CGO grains ∼250–700 nm in size. The SEM images show good adherence at the electrode/electrolyte interface, assuming negligible polarization resistance associated with the imperfection at the interface. The surface of the scaffolds was covered with uniformly distributed nanoparticles. The average size of the CoxOy nanoparticles in Fig. 1(c) was estimated to be approximately 60 nm, similar to the size observed earlier by Samson et al.50 The size of CGO nanoparticles in Fig. 1(d) was substantially smaller, approximately 20 nm. Fig. 1(e) and (f) show the LSCF/CGO scaffold after dual infiltration with CGO and CoxOy. Remarkably, similar microstructures and particle sizes were observed before (see Fig. 1(b)) and after testing and aging (see Fig. 1(e) and (f)). CGO and CoxOy nanoparticles were indistinguishable in appearance and size (approximately 20 nm) apart from some local ordering of CGO nanoparticles in small nano-chains (see Fig. 1(d)). The average size of the infiltrated nanoparticles in Fig. 1(d), (e) and (f) remained at the level observed in Fig. 1(b) after testing and aging at 650 °C. We ascribe this size stability to the self-limited grain growth of nanoscale CGO below 1100 °C as previously reported by Rupp et al.51 At the same time, one can observe that the average size of CoxOy nanoparticles after testing and aging was approximately 60 nm. Thus, it was clearly observed that the dual infiltration procedure inhibited the aggregation of the CoxOy nanoparticles. A similar size distribution was reported by Imanishi et al.35 The images presented in Fig. 1(b–f) were collected from the fractured cross sections at locations near the electrode/electrolyte interface, confirming that ethanol-based inks wetted and penetrated the porous scaffold well. The observed nanoscale decoration of the cathode was expected to extend the TPB and increase the density of the active sites available for the ORR contributing to a superior electrochemical activity. | ||
| Fig. 1 SEM cross-sectional images comparing dual and mono-infiltrated samples. (a) Low resolution cross-sectional image of the infiltrated LSCF/CGO cathode, (b) cathode infiltrated with CGO followed by CoxOy – as-calcined, (c) only CoxOy, aged 100 h, (d) only CGO, aged 100 h, (e) CGO followed by CoxOy, aged 100 h and (f) CoxOy followed by CGO, aged 100 h (note that the bar size for image (a) is 10 μm and for all other images the bar size is 1 μm). | ||
To quantify the effect, EIS testing was performed before and after aging for 100 hours in air at 650 °C. A summary of the Nyquist and Bode plots for the reference cathode and the cathodes with different infiltration sequences measured at 550 °C is shown in Fig. 2. Nyquist plots at different temperatures for all studied cathodes are shown in Fig. S2.† To simplify the comparison, the high frequency intercept of all cells has been shifted to zero. The Nyquist plots were similar in shape, showing two suppressed overlapping arcs associated with low (LF) and high (HF) frequency polarisation losses. The diameters of the semicircles decreased with temperature (see Fig. S2†), indicating the relaxation of polarisation loss processes. The HF arcs became significantly less dominant after the infiltration. The non-semi-circular shape and the overlapping of the arcs suggested contributions from multiple electrochemical processes (e.g., charge transfer at the electrode/electrolyte interfaces, oxygen adsorption/dissociation/exchange at the electrode surface, bulk and surface diffusion of oxygen species and gas phase diffusion). The total polarisation resistances, Rp, were calculated from the difference between the low and high frequency intercepts with the real axis divided by two, to account for the symmetrical nature of the cells. All Rp values henceforth are given for one electrode. The area specific resistance (ASR) was obtained from the polarisation resistances by multiplying Rp with the cathode geometric area. The ASR values of the reference and the infiltrated cathodes at 550 °C are summarised in Table 1.
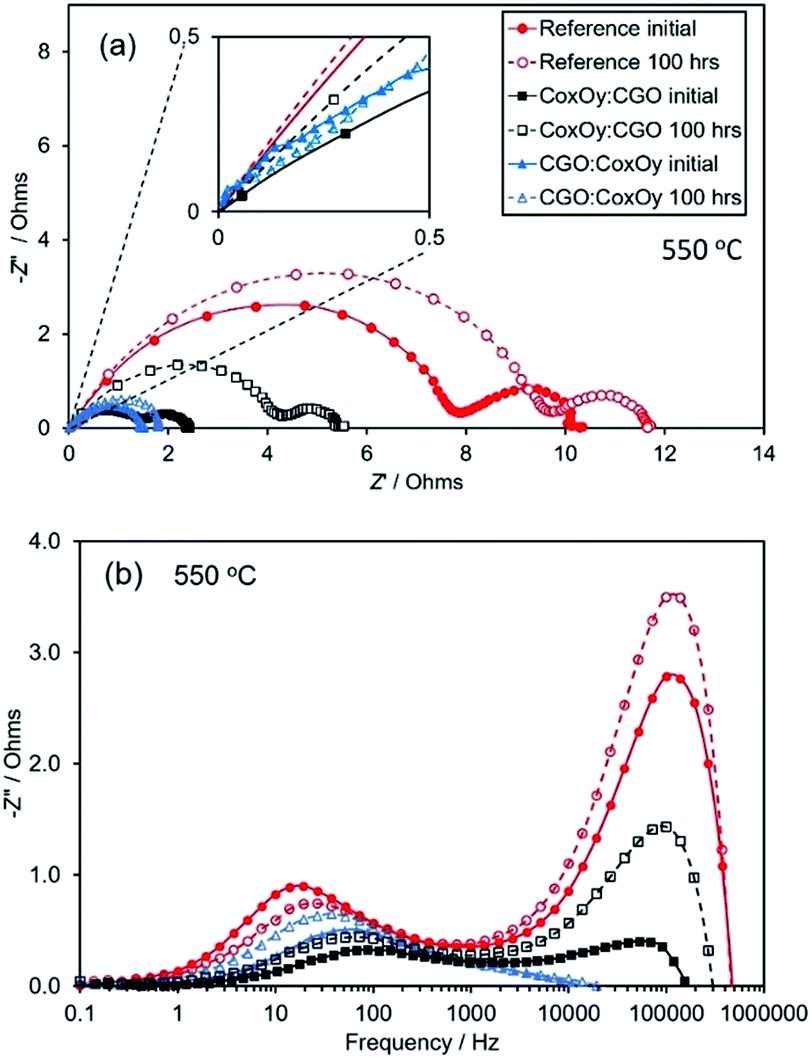 | ||
| Fig. 2 Nyquist (a) and Bode (b) plots of the reference and the dual infiltrated samples at 550 °C (before and after aging) for 100 hours in air. | ||
| 550 °C | 700 °C | |||
|---|---|---|---|---|
| ASR initial Ω cm2 | ASR 100 hours Ω cm2 | ASR initial Ω cm2 | ASR100 hours Ω cm2 | |
| Ref | 4.2 | 4.9 | 0.18 | 0.22 |
| CGO:CoxOy |
0.5 | 0.7 | 0.12 | 0.13 |
| CoxOy:CGO |
0.9 | 2.3 | 0.07 | 0.10 |
The ASR values were used to build an Arrhenius plot and to estimate the activation energies associated with each sample (see Fig. 3). It could be seen that both the reference and CoxOy:CGO samples had similar activation energies indicating the same rate-limiting step dominating the polarisation losses. On the other hand, the activation energy for the CGO:CoxOy infiltrated cathode was substantially lower, indicating that this infiltration sequence altered the dominant loss mechanism. After 100 hours of aging at 650 °C the samples exhibited different deterioration rates as shown in Fig. 2(a, b) and 3. While the reference and CoxOy:CGO samples demonstrated significantly increased Rp values (see Table 1), the CGO:CoxOy revealed significantly more stable performance.
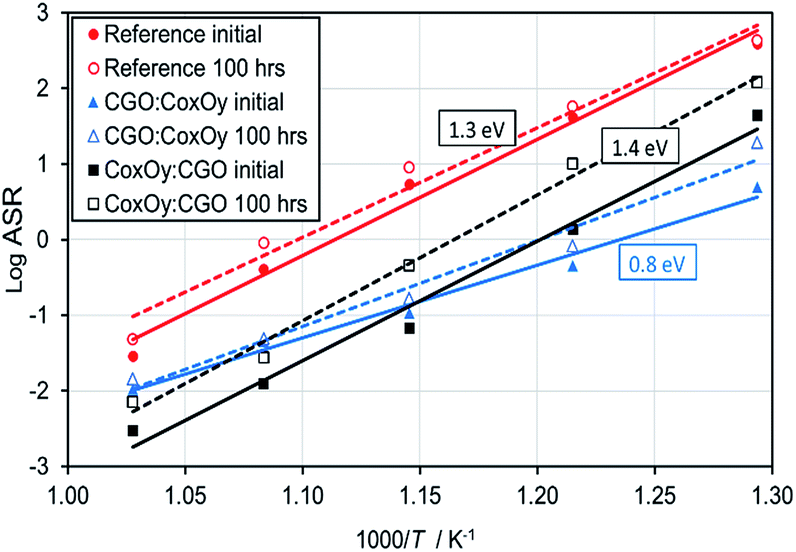 | ||
| Fig. 3 Arrhenius plot for the ASR values of the reference and the infiltrated cathodes before and after aging. | ||
Accurate analysis of the dominant loss mechanisms in the ORR is not possible based only on ASR and activation energy data. In order to evaluate the degree of all possible contributions an accurate testing of impedance characteristics at different oxygen pressures and temperatures is required. Nevertheless, some generalized conclusions can be drawn from the presented electrochemical test data. As reported previously, an estimation of the relative importance of the surface exchange and the bulk diffusion contributions to the LF losses can be based on the comparison between the actual cathode thickness (∼20 μm) and the characteristic thickness of the LSCF (defined as the ratio of the oxygen tracer diffusion coefficient and the corresponding surface exchange rate constant – Lc = DN/kN).52–54 As Lc for the LSCF was reported to be of the order of 100 μm, the oxygen transport was assumed to be limited by the surface exchange in the reference cathode (L < Lc).52–54 Similar assignments were made by different authors working on LSCF/CGO symmetric cathodes.54–57 Simultaneously, the appearance of ∼45° straight line at high frequency end of the Nyquist spectra of the infiltrated cathodes (see inset in Fig. 2(a)) reflects a contribution from a Gerischer type element. This suggests that the impedance is determined by both bulk diffusion and surface exchange of oxygen ions.58,59 An equivalent circuit (L-R1-(R2∥CPE1)-(R3∥(CPE2-G1)) was used for the interpretation of the phenomena in the infiltrated cathodes (see Fig. S3†), where L represents an inductive element associated with the lead wires and R1 represents the ohmic resistance of the electrolyte connected in series with two sub-circuits – R2∥CPE1 and R3∥(CPE2-G1). (R2∥CPE1) was associated with the semicircle at HF and the (R3∥(CPE2-G1)) semicircle was related to the LF losses – surface exchange and the bulk diffusion contributions, where G1 represents the Gerischer element. A CPE (constant phase element) was used instead of a pure capacitance to take into account the depressed shape of the impedance arcs. This was the simplest circuit model that yielded a reasonable fitting (less than 10% error) for both cathodes. The experimental and fitted spectra obtained at 550 °C are shown in Fig. S3.† For both cathodes, the HF arc had a capacitance of ∼10−8 F cm−2 while the LF arc had a capacitance of ∼10−2 F cm−2. Based on these results, we speculate that the performed infiltration caused reduction of the surface exchange losses (and the overall LF losses) leading to a relative increase of the bulk diffusion contribution. The different shift of Z′′(f)max summit frequency to higher values (more expressed for the CoxOy:CGO sample) suggested a different degree of promotion of the adsorption–dissociation/surface exchange reactions due to density variation of the added ORR sites. Previous literature studies on LSCF symmetric infiltrated cathodes and model electrodes have assigned the HF arc with similar capacitances to the charge transfer reaction at the LSCF/GDC interface.38,54–57,60 The decrease of the HF maximum Z′′(f)max (Fig. 2(b)) reflected a substantial reduction of the HF losses with infiltration. Note the different degrees of reduction in HF losses for the CoxOy:CGO and CGO:CoxOy samples. HF losses could also be attributed to a grain boundary process in the electrolyte. However, the size of these arcs varied significantly for the differently processed cells while the GDC electrolyte processing/structure was unchanged. This fact suggested a relationship between the dynamics of the HF losses and the extension of the TPB by the infiltration. Aging in air for 100 hours revealed different behaviours for CoxOy:CGO and CGO:CoxOy infiltration sequences. As demonstrated in Fig. 2, the infiltration of CGO before CoxOy led to a significantly more stable performance improvement over the testing period.
An improvement ratio, defined as ε = ASRblank/ASRinf, was chosen as a figure of merit for the infiltration efficiency, where ASRblank is the ASR value of the reference cathode and ASRinf is the ASR value of infiltrated cathodes. Fig. 4 shows how the value of ε varies with temperature and the infiltration sequence both before and after sample aging. The sample CGO:CoxOy had a higher improvement ratio at lower operating temperatures and was more stable when aged than the CoxOy:CGO sample. All infiltrated samples showed ratios greater than 1.5 for all test temperatures, highlighting the benefit of infiltration for enhancing the performance. The key result in the present work is the reduction in the ASR by a factor of ∼7 at 550 °C achieved with the CGO:CoxOy infiltration sequence. The εag = ASRaged/ASRinitial was defined as an aging coefficient (ASRaged was the ASR value of the aged cathode and ASRinitial was the corresponding ASR value of the same cathode before aging). One should notice that the degradation of the CoxOy:CGO infiltrated cathode was more pronounced (εag(700 °C) = 1.43) than that of the reference cathode (εag(700 °C) = 1.22). At the same time, the aging coefficient for the CGO:CoxOy was found to be substantially lower and close to unity (εag(700 °C) = 1.08). The accelerated aging of the CoxOy:CGO infiltrated cathode was ascribed to two processes – (i) lower degree of Sr segregation suppression compared to CGO:CoxOy infiltration (see XPS data below) and (ii) the role of CoxOy nanoparticles acting as a sintering aid for the LSCF/CGO scaffold during the aging procedure,61 evidence of which could be seen in Fig. S1(c, d).† In contrast, the initial infiltration of CGO (as in CGO:CoxOy infiltrated cathodes) led to coverage of the scaffold's grain boundary with CGO acting as a sintering inhibitor.51
 | ||
| Fig. 4 Plot of the improvement ratio, ε, as a function of temperature for both infiltration sequences. | ||
The characterisation of the scaffold surface resulting from the infiltration and aging was attempted by XPS in order to identify the factors responsible for the observed differences in performance and stability. Fig. 5(a) to (c) show the core level XPS spectra of Sr 3d and Co 2p and the valence band, respectively. The core level spectra were normalized to the Ce 4d peak located between 121.2 and 121.5 eV (Fig. S5†) binding energy (B.E.), enabling a direct comparison of peak heights. Fig. 5(a) shows the detailed view of the Sr 3d5/2 core level normalized to the Ce 4d peak. After infiltration the intensity of the Sr 3d core level is considerably reduced compared to the intensity of the Ce 4d core level (see Fig. S5†). The Sr 3d5/2 core level exhibits two features: one at the energy expected of Sr in LSCF (B.E. of 132.1 eV) and one at a higher B.E. position typical of a SrCO3 environment (B.E. of 133.6 eV).62 A high concentration of strontium in the form of SrCO3 is observed on the surface of the LSCF/CGO sample. After infiltration, the signal of the Sr from the LSCF is greatly reduced and only the SrCO3 signal remains. Peak fitting of the Sr 3d core level has allowed comparison of the level of SrCO3 on each sample and shows that SrCO3 species detected on the surface of the dual infiltrated samples are ∼8% of the SrCO3 species detected on the surface of the LSCF/CGO reference cathode (see Tables S2 and S3†). The Co 2p core level spectra shown in Fig. 5(b) differ between the LSCF/CGO sample and the two dual infiltrated samples. The LSCF/CGO reference exhibits a visible shake-up satellite structure around 786 eV indicative of a mixed Co(II) and Co(III) oxide29,63 The CGO:CoxOy infiltrated sample also exhibits a spectrum of a mixed Co(II) oxide and Co(III) oxide structure with the main Co 2p3/2 peak located at a BE of 779.4 eV but with a less pronounced Co(II) oxide satellite (B.E. of 786.2 eV) than the one of the LSCF/CGO (ref. 29). This indicates that there is less Co(II) oxide at the surface of the CGO:CoxOy infiltrated sample than that on the LSCF/CGO reference sample. The CoxOy:CGO infiltrated sample exhibits an intense shake-up satellite structure (B.E. of 786.2 eV) suggesting mainly Co(II) oxide with the main Co 2p3/2 peak located at a BE of 780.5 eV characteristic of Co(II) oxide.64 The intensity of the Co 2p3/2 structure of the CoxOy:CGO infiltrated sample decreases by a factor of ∼5 compared to that of the CGO:CoxOy infiltrated sample. The difference in the amount of Co(III) species between the samples is also supported by the valence band spectra shown in Fig. 5(c). The spectra, normalised to the onset of the valence band structure located at 3.7 eV, differ in the level of the 3d-related features of Co(III) oxide at a binding energy of 1.1 eV.65 The comparison of the level of the Co(III) 3d band between the three samples gives a good indication of the amount of cobalt(III) oxide at the surface.64,65 The Co(III) 3d band is found to be more pronounced for the CGO:CoxOy infiltrated > LSCF/CGO > CoxOy:CGO infiltrated sample, which is in good agreement with the results found with the Co 2p spectra. Cobalt(II) oxide is less catalytically active than cobalt (III) oxide which is present in the mixed state Cotetr(II)Co2oct(III)O4 with the high catalytic activity being related to the weak Co(III)–O bond.66,67
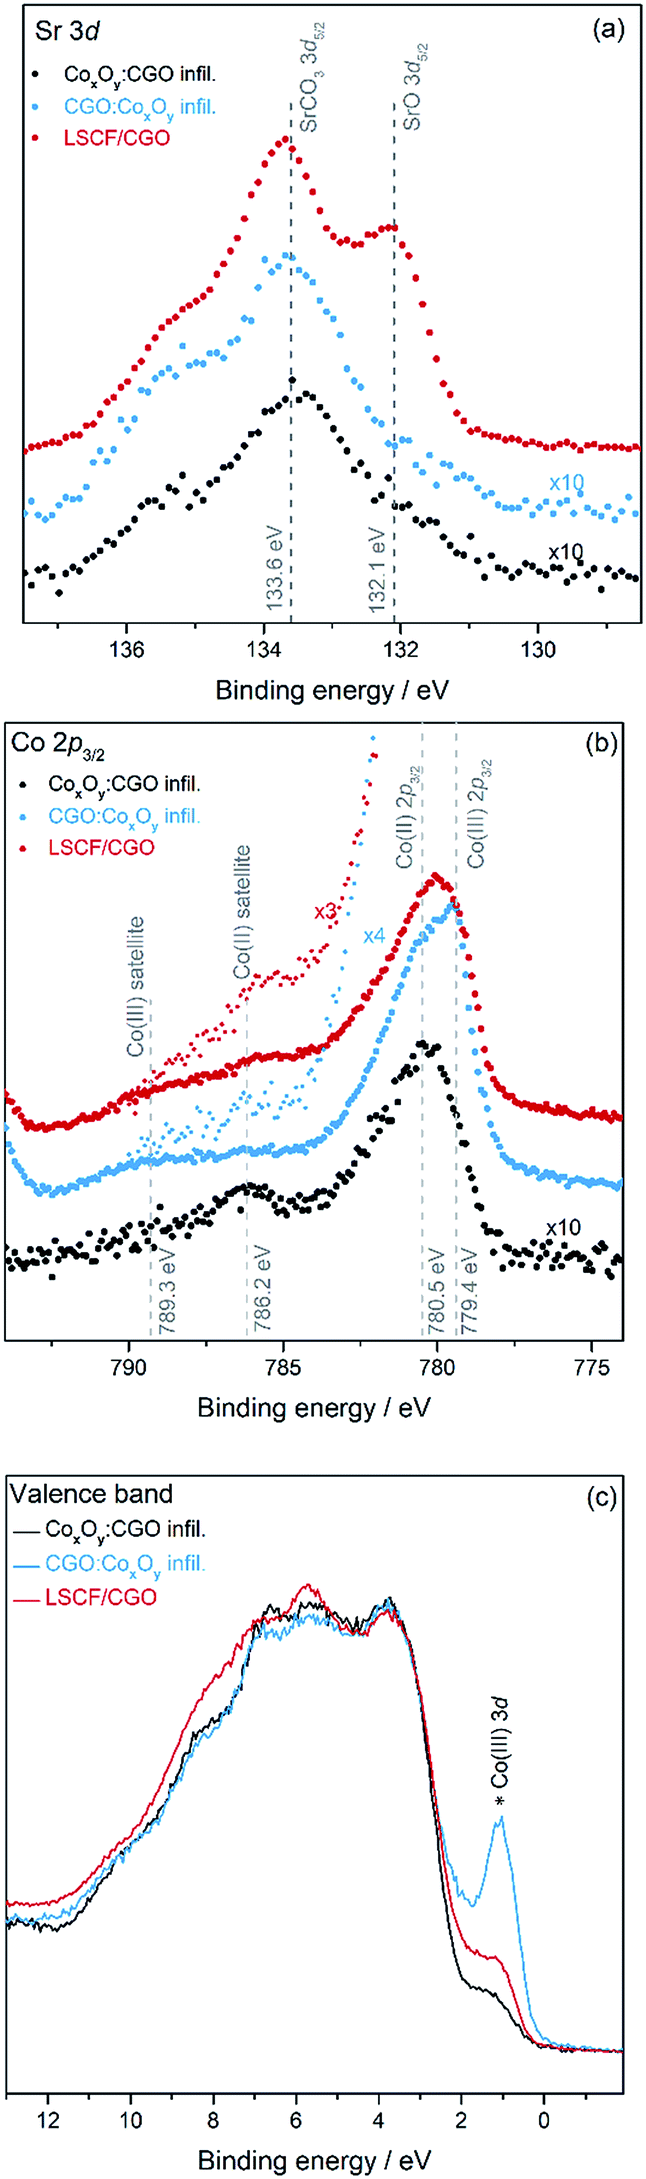 | ||
| Fig. 5 XPS spectra of the (a) Sr 3d core level and (b) Co 2p3/2 core level and (c) valence band spectra of the LSCF/CGO sample (red), dual infiltrated CoxOy:CGO on LSCF/CGO (black) and dual infiltrated CGO:CoxOy on LSCF/CGO (blue). (b) also shows a zoom of the intensity (×3) for the LSCF/CGO and (×4) for the CGO:CoxOy to resolve the small satellite structure at a BE position of 786.2 eV. | ||
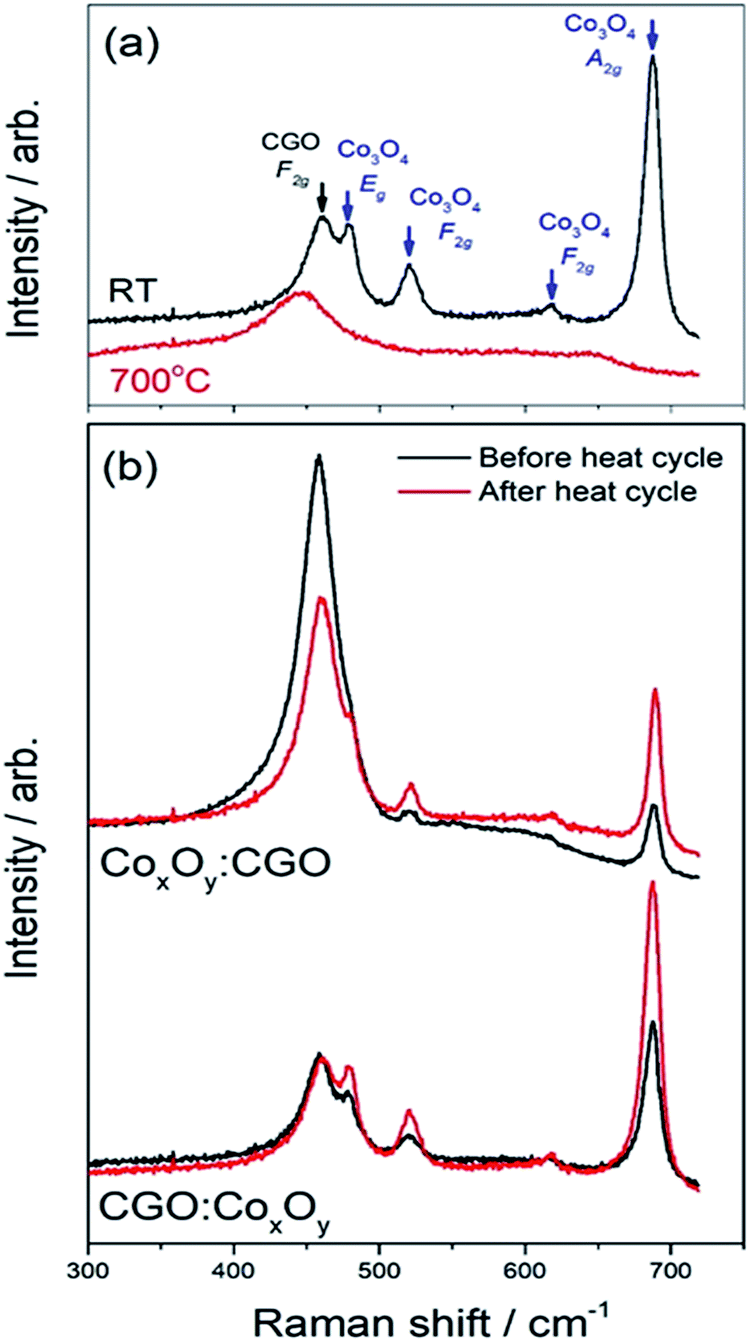
Fig. 6(a) shows in situ Raman spectra of the CGO:CoxOy infiltrated sample acquired at room temperature and at 700 °C. The extended spectra show that all visible peaks are present within 700 cm−1 of the laser. These peaks have been identified as CGO (F2g symmetric breathing mode at 460 cm −1)68 and Co3O4 (Eg – 482 cm−1; F2g – 521 cm−1; F2g – 618 cm−1; A1g-685 cm−1).69,70 Similar heating/cooling Raman spectra acquired during heating and cooling of the reference, and the CGO:CoxOy and the CoxOy:CGO infiltrated samples at a range of temperatures from room temperature to 700 °C are presented in Fig. S8.†
 | ||
| Fig. 6 Analyses of the in situ temperature dependent Raman spectra of the Co peak for dual infiltrated cells: (a) Raman spectra at room temperature (RT) and 700 °C; (b) Raman spectra before and after thermal cycling. | ||
As the temperature is increased, the peaks broaden and shift towards the laser and when the temperature is decreased they sharpen and shift away from it. Note that the CGO peak at 460 cm−1 behaved similarly in all samples. The Co3O4 Raman peaks for both infiltrated samples and CoxOy−REF (see Fig. S9†) disappeared as the temperature was increased and reappeared sharper and more clearly resolved after the sample had been cooled back to room temperature. This phenomenon was most notable in the 685 cm−1 peak. Fig. 7(a) shows the area under the curve for all samples as a function of temperature. It is well established that Co3O4 single crystals undergo a structural transition onset at around 700 °C.71 The observed gradual disappearance and recovery of the 685 cm−1 Raman peak close to 700 °C is likely related to this feature, as all samples including the CoxOy reference sample (CoxOy−REF) show the same behaviour. Nevertheless, there are significant changes in the Raman spectra when the CoxOy is on top of the CGO in infiltration or below it. In particular, the FWHM of the peaks at 685 cm−1 for CGO:CoxOy and CoxOy:CGO infiltrations and the CoxOy−REF is shown as a function of temperature in Fig. 7(c) (see also Table S4†). One can observe that the FWHM is broader for the CGO:CoxOy suggestive of particle size disorder broadening when the oxide is deposited onto the CGO infiltrated surface as the CoxOy:CGO has similar properties to the bulk reference sample. This observation is supported by examining the peak position shifts as a function of temperature as shown in Fig. 7(b). Again the peak position for the CoxOy:CGO is the same as that for the bulk reference sample (within error) but the Raman 685 cm−1 peak of the CGO:CoxOy sample is shifted down indicative of inhomogeneous strain or a change in particle size.
 | ||
| Fig. 7 Peak parameters extracted from the 685 cm−1 mode of CoxOy Raman spectra for all samples investigated under heating and cooling. | ||
In order to investigate the effects of “aging”, the samples were left at 550 °C for 12 hours during the cooling cycle (Fig. 8). The measured peak ratio (I= ICo3O4(685 cm−1)/ICGO(460 cm−1)) can be used as an indicator of the changes in the samples. Table S5† shows that there was very little change in the ratio of CGO:CoxOy and a slight decrease in the ratio of CoxOy:CGO. The changes in the peak ratio before and after the heating cycle were far more pronounced as can be seen in Fig. 8(b) and shown in Table S6.†
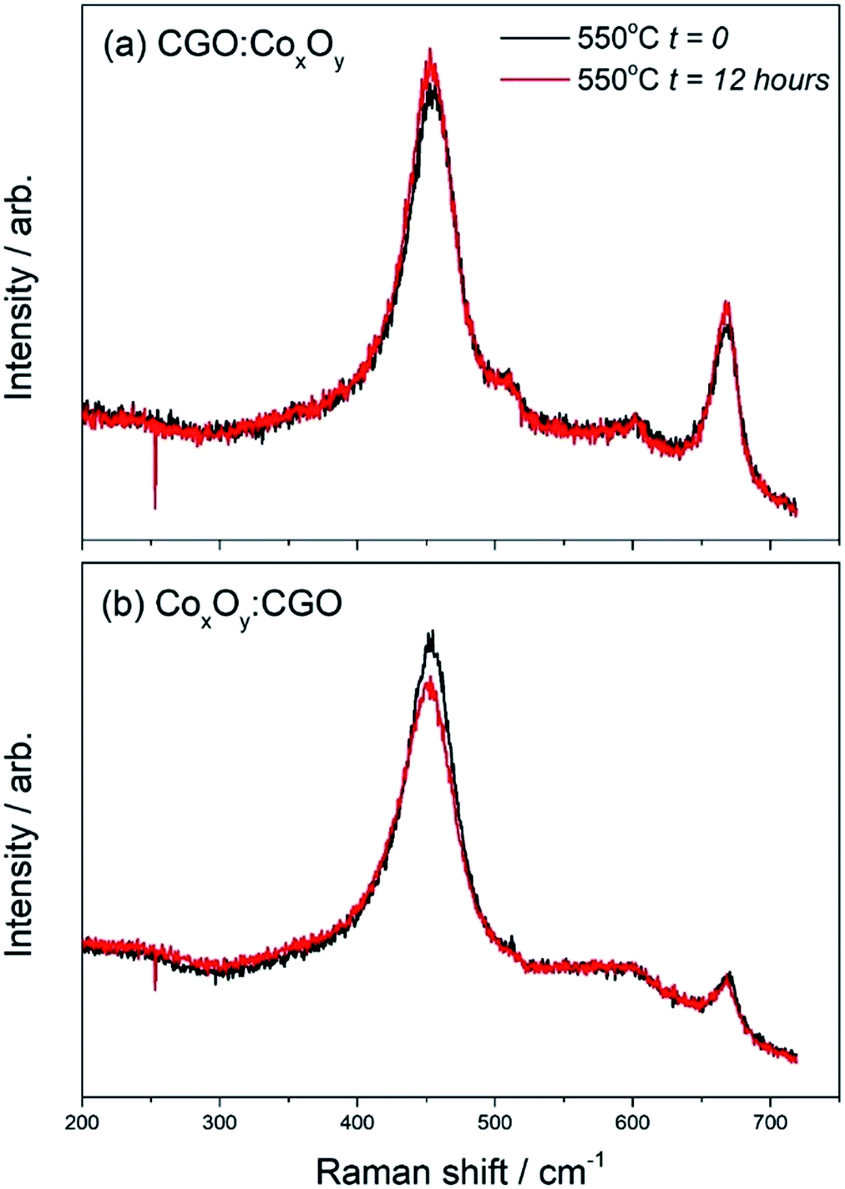 | ||
| Fig. 8
In situ Raman spectra of (a) CGO:CoxOy infiltrated cathode and (b) CoxOy:CGO infiltrated cathode “aged” at 550 °C for 12 hours during the cooling cycle. | ||
In the case of CGO:CoxOy infiltration the peak ratio doubled after the heating cycle. On the other hand the peak ratios for the CoxOy:CGO infiltration showed an even larger change – the Co3O4 peak at 685 cm−1 was much more intense compared to the CGO peak at ∼460 cm−1 and the ratio changed by a factor of 4. These results suggested that the CoxOy was more mobile in the CoxOy:CGO infiltrated cathode surface as a result of the sample undergoing a heating cycle. The data presented in Fig. 8 suggested that in the case where Co3O4 nanoparticles were infiltrated first and had a larger contact area with the LSCF surface, the deterioration of the initial nano-decoration proceeded faster. We speculate that this is evidence of a disorder increase due to Co3O4 interaction with high vacancy concentration on the surface of the LSCF/CGO scaffold.
The EIS, XPS and Raman spectroscopy analyses reveal an enhancement of both the electrochemical performance and the stability of LSCF/CGO cathodes by the infiltration with an advantage of CGO:CoxOy infiltration over the CoxOy:CGO procedure. A quantification of XPS results confirmed that the Sr content on the surface of the infiltrated samples was significantly lower than that on the surface of the reference cathode. The electrochemical and stability effect of the dual infiltration could not be explained by a direct reaction between LSCF, Co3O4 and CGO.40,41 Instead, the observed behaviours were ascribed to the morphological differences created by the two infiltration sequences. The hypothesis is illustrated in Fig. 9. Four different promotion mechanisms are assumed to be introduced into the CGO:CoxOy infiltrated cathode. In a “spillover”-type mechanism, the dissociated oxygen can diffuse across the surface of CoxOy (M1) and CGO/CoxOy (M2) nanoparticles while the incorporation takes place at the TPB. It is impossible to quantify the difference between mechanisms M1 and M2 solely based on the characterization techniques used in the present work. However, XPS analysis showed that the Co(III) 3d band was found to be more pronounced for the CGO:CoxOy infiltrated sample, most likely due to the larger proportion of the Co3O4 situated on the top of CGO nanoparticles. The increase of vacancy concentration near the Co3O4/LSCF interface predicted by Ding et al.20 (more dominant in the CoxOy:CGO scenario) could cause an exchange of vacancy at high temperature leading to a local disorder. In order to compensate for the charge imbalance, the 2+/3+ cobalt oxidation state could transition towards 2+ effectively decreasing the catalytic activity of Co3O4/LSCF nano-decoration.
 | ||
| Fig. 9 Possible promotion mechanisms introduced into the CGO:CoxOy dual infiltrated cathode. | ||
Considering the fact that bulk Co3O4 is an amphoteric semiconductor with low electronic conductivity (∼2 S cm−1 at 600 °C), it is difficult to determine the extent to which the other two possible dissociative adsorption/surface exchange mechanisms as illustrated in Fig. 9 (M3 and M4) could contribute to the ORR. In scenarios M3 and M4, the surface transfer and O2− diffusion proceed via the volume of the Co3O4 particles. A reasonable performance was previously reported by Samson et al.50 for cathodes prepared by infiltration of only Co3O4 into porous CGO scaffolds (0.27 Ω cm2 at 600 °C). The authors speculated that due to the small particle sizes even a very low ionic conductivity of the Co3O4 infiltrate would ensure that they work as a MIEC. In addition, electronic conductivities of ∼40 S cm−1 at room temperature were previously reported for Co3O4 thin films.72 The study by Druce et al.73 provides evidence in support of scenario M4, where a substantial enhancement of the surface exchange properties of CGO was found when it was coated with nitrates of the constituent cations of LSCF. Treatment with Co nitrate provided an enhancement factor of 13.6 at 700 °C for the surface exchange coefficient (k* = 1.5 × 10⁻⁷). The latter was still an order of magnitude lower than the surface exchange coefficient of LSCF at 700 °C (k* = 1.0 × 10⁻⁶). A detailed study of oxygen exchange and transport in LSCF/CGO composite electrodes using complementary time of flight SIMS (ToF-SIMS) and low energy ion scattering spectroscopy (LEIS) was published separately by the same group – Druce et al.19 At a lower temperature of 500 °C, the measured value of the surface exchange coefficient (k*) for CGO was 6.8 × 10⁻⁸ cm s−1 (∼30 times higher than the value of 2 × 10⁻⁹ cm s−1 for pure CGO). At the same time, k*(500 °C) = 9.5 × 10⁻⁹ cm s−1 was measured for the LSCF which was approximately a third of the value of 3 × 10⁻⁸ cm s−1 determined for pure LSCF. These variations of the effective surface exchange coefficients with temperature could explain why the enhancement of the cathode electrochemical activity by the dual infiltration was significantly more efficient at lower temperatures. It is also expected that in the CoxOy:CGO infiltrated cathode the CoxOy nanoparticles partially obstruct the extension of the TPB by the CGO infiltrate and contribution from mechanism M4 to the overall ORR is lacking.
5. Conclusions
Dual infiltration of CGO and CoxOy into porous LSCF/CGO cathode scaffolds produced uniform nano-decoration of CGO and CoxOy nanoparticles. The nano-decoration led to substantially enhanced electrochemical performance and stability (0.7 Ω cm2 at 550 °C after 100 hours of aging for CGO:CoxOy infiltration). As the LSCF/CGO composite cathodes had already percolating ionic and electronic networks, a low level loading of nanoparticles was sufficient to lead to an efficient short-range extension of the TPB and the density of ORR sites. The sequence of infiltration was shown to influence the efficiency of the ORR promotion. CoxOy:CGO infiltration expanded the available surface area and promoted the catalytic activity towards the ORR introducing mechanisms M1 and M2. The superior effect of CGO:CoxOy infiltration was assigned to the introduction of additional promotion mechanisms (M3 and M4) resulting in better electrochemical performance at lower temperatures (<650 °C). Both infiltrations suppressed the Sr surface segregation but only CGO:CoxOy infiltrated cathodes showed substantially improved stability after 100 hours of aging.
Single step inkjet printing infiltration was shown to be a viable commercial technique for controllable nano-engineering of SOFC cathodes via infiltration.
Conflicts of interest
There are no conflicts to declare.Acknowledgements
The authors wish to acknowledge the Engineering and Physical Sciences Research Council (EP/M014304/1) for the financial support. D. J. P. wishes to thank the Royal Society for a Royal Society University Research Fellowship (UF100105 and UF150693).References
- A. Atkinson, S. Barnett, R. J. Gorte, J. T. S. Irvine, A. J. McEvoy, M. Mogensen, S. C. Singhal and J. Vohs, Nat. Mater., 2004, 3, 17–27 CrossRef CAS PubMed.
- R. O'Hayre, S. W. Cha, W. Colella and F. B. Prinz, Fuel Cell Fundamentals, Wiley, 2009 Search PubMed.
- K. Huang and J. B. Goodenough, Solid Oxide Fuel Cell Technology: Principles, Performance and Operations, Elsevier Science, 2009 Search PubMed.
- J. T. S. Irvine, D. Neagu, M. C. Verbraeken, C. Chatzichristodoulou, C. Graves and M. B. Mogensen, Nat. Energy, 2016, 1, 1 Search PubMed.
- E. D. Wachsman and K. T. Lee, Science, 2011, 334, 935 CrossRef CAS PubMed.
- N. Behling, Fuel Cells Current Technology Challenges and Future Research Needs, Elsevier, 1st edn, 2012 Search PubMed.
- S. C. Singhal, Solid State Ionics, 2002, 152, 405 CrossRef.
- L. Yang, S. Z. Wang, K. Blinn, M. F. Liu, Z. Liu, Z. Cheng and M. L. Liu, Science, 2009, 326, 126 CrossRef CAS PubMed.
- L. Yang, Y. Choi, W. Qin, H. Chen, K. Blinn, M. Liu, P. Liu, J. Bai, T. A. Tyson and M. Liu, Nat. Commun., 2011, 2, 357 CrossRef PubMed.
- B. C. H. Steele, J. Mater. Sci., 2001, 36, 1053 CrossRef CAS.
- S. B. Adler, Chem. Rev., 2004, 104, 4791 CrossRef CAS PubMed.
- C. W. Sun, R. Hui and J. Roller, J. Solid State Electrochem., 2010, 14, 1125 CrossRef CAS.
- J. Fleig, J. Power Sources, 2002, 105(2), 228 CrossRef CAS.
- A. Mineshige, M. Kobune, S. Fujii, Z. Ogumi, M. Inaba, T. Yao and K. Kikuchi, J. Solid State Chem., 1999, 142, 374 CrossRef CAS.
- S. P. Simner, J. F. Bonnett, N. L. Canfield, K. D. Meinhardt, V. L. Sprenkle and J. W. Stevenson, Electrochem. Solid-State Lett., 2002, 5, A173 CrossRef CAS.
- A. Esquirol, N. P. Brandon, J. A. Kilner and M. Mogensen, J. Electrochem. Soc., 2004, 151, A1847 CrossRef CAS.
- L.-W. Tai, M. M. Nasrallah, H. U. Anderson, D. M. Sparlin and S. R. Sehlin, Solid State Ionics, 1995, 76, 273 CrossRef CAS.
- A. Esquirol, J. Kilner and N. Brandon, Solid State Ionics, 2004, 175, 63 CrossRef CAS.
- J. Druce, H. Tellez, T. Ishihara and J. A. Kilner, Faraday Discuss., 2015, 182, 271 RSC.
- H. Ding, A. V. Virkar, M. Liu and F. Liu, Phys. Chem. Chem. Phys., 2013, 15, 489 RSC.
- E. Bucher and W. Sitte, Solid State Ionics, 2011, 192, 480 CrossRef CAS.
- H. Wang, K. J. Yakal-Kremski, T. Yeh, G. M. Rupp, A. Limbeck, J. Fleig and S. A. Barnett, J. Electrochem. Soc., 2016, 163, F581 CrossRef CAS.
- D. Oh, D. Gostovic and E. D. Wachsman, J. Mater. Res., 2012, 27, 1992 CrossRef CAS.
- P. A. W. V. Heide, Surf. Interface Anal., 2002, 33, 414 CrossRef.
- J. E. Elshof, H. J. M. Bouwmeester and H. Verweij, Appl. Catal., A, 1995, 130, 195 CrossRef.
- E. J. Crumlin, E. Mutoro, Z. Liu, M. E. Grass, M. D. Biegalski, Y. L. Lee, D. Morgan, H. M. Christen, H. Bluhm and Y. Shao-Horn, Energy Environ. Sci., 2012, 5, 6081 CAS.
- W. A. Harrison, Phys. Rev. B: Condens. Matter Mater. Phys., 2011, 83, 155437 CrossRef.
- G. M. Rupp, A. K. Opitz, A. Nenning, A. Limbeck and J. Fleig, Nat. Mater., 2017, 16, 640 CrossRef CAS PubMed.
- E. Mutoro, E. J. Crumlin, M. D. Biegalski, H. M. Christen and Y. Shao-Horn, Energy Environ. Sci., 2011, 4, 3689 CAS.
- W. C. Jung and H. L. Tuller, Energy Environ. Sci., 2012, 5, 5370 CAS.
- Z. Wang, R. Peng, W. Zhang, X. Wu, C. Xia and Y. Lua, J. Mater. Chem. A, 2013, 1, 12932 CAS.
- K. Kubicek, A. Limbeck, T. Fromling, H. Hutter and J. Fleig, J. Electrochem. Soc., 2011, 158, B727 CrossRef.
- N. Tsvetkov, Q. Lu, L. Sun, E. J. Crumlin and B. Yildiz, Nat. Mater., 2016, 15, 1010 CrossRef CAS PubMed.
- M. Li, M. Zheng, B. Hu, Y. Zhang and C. Xia, Electrochim. Acta, 2017, 230, 196 CrossRef CAS.
- N. Imanishi, R. Ohno, K. Murata, A. Hirano, Y. Takeda, O. Yamamoto and K. Yamahara, Fuel Cells, 2009, 9, 215 CrossRef CAS.
- R. A. Cox-Galhotra and S. McIntosh, Solid State Ionics, 2010, 181, 1429 CrossRef CAS.
- H. J. Choi, K. Bae, D. Y. Jang, J. W. Kim and J. H. Shim, J. Electrochem. Soc., 2015, 162, F622 CrossRef CAS.
- T. E. Burye and J. D. Nicholas, J. Power Sources, 2015, 300, 402 CrossRef CAS.
- A. Wang, L. Jia, J. Pu, B. Chi and J. Li, Int. J. Hydrogen Energy, 2017, 42, 15385 CrossRef CAS.
- V. V. Kharton, A. A. Yaremchenko and E. N. Naumovich, J. Solid State Electrochem., 1999, 3, 303 CrossRef CAS.
- W. Zhang, PhD, Technical University of Denmark., 2012.
- R. I. Tomov, T. Mitchell-Williams, C. Gao, R. V. Kumar and B. A. Glowacki, J. Appl. Electrochem., 2017, 47(5), 641 CrossRef CAS.
- R. I. Tomov, M. Krauz, J. Jewulski, S. C. Hopkins, J. R. Kluczowski, D. M. Glowacka and B. A. Glowacki, J. Power Sources, 2010, 195, 7160 CrossRef CAS.
- C. Wang, S. C. Hopkins, R. I. Tomov, R. V. Kumar and B. A. Glowacki, J. Eur. Ceram. Soc., 2012, 32, 2317 CrossRef CAS.
- C. Wang, R. I. Tomov, R. V. Kumar and B. A. Glowacki, J. Mater. Sci., 2011, 46, 6889 CrossRef CAS.
- K. T. Lee, H. S. Yoon, J. S. Ahn and E. D. Wachsman, J. Mater. Chem., 2012, 22, 17113 RSC.
- R. Kiebach, P. Zielke, J. V. T. Høgh, K. Thyden, H.-J. Wang, R. Barford and P. V. Hendriksen, Fuel cells, 2016, 16, 80 CrossRef CAS.
- T. B. Mitchel-Williams, R. I. Tomov, S. A. Saadabadi, M. Krauz, P. V. Aravind, B. A. Glowacki and R. V. Kumar, Materials for Renewable and Sustainable Energy, 2017, 6, 12 CrossRef.
- E. Brightman, R. Maher, G. J. Offer, V. Duboviks, C. Heck, L. F. Cohen and N. P. Brandon, Rev. Sci. Instrum., 2012, 83, 053707 CrossRef CAS PubMed.
- A. J. Samson, M. Søgaard and N. Bonanos, Electrochem. Solid-State Lett., 2012, 15(4), B54 CrossRef CAS.
- J. L. M. Rupp, A. Infortuna and L. J. Gauckler, Acta Mater., 2006, 54, 1721 CrossRef CAS.
- B. C. H. Steele, Solid State Ionics, 1995, 75, 157 CrossRef CAS.
- B. C. H. Steele, Solid State Ionics, 1998, 106, 255 CrossRef CAS.
- F. S. Baumann, J. Fleig, H.-U. Habermeier and J. Maier, Solid State Ionics, 2006, 177, 1071 CrossRef CAS.
- E. P. Murray, M. J. Sever and S. A. Barnett, Solid State Ionics, 2002, 148, 27 CrossRef.
- M. Shah and S. A. Barnett, Solid State Ionics, 2008, 179, 2059 CrossRef CAS.
- V. Dusastre and J. A. Kilner, Solid State Ionics, 1999, 126, 163 CrossRef CAS.
- J. Deseure, Y. Bultel, L. Dessemond and E. Siebert, Solid State Ionics, 2005, 176, 235 CrossRef CAS.
- S. B. Adler, J. A. Lane and B. C. H. Steele, J. Electrochem. Soc., 1996, 143, 3554 CrossRef CAS.
- A. P. Jamale, C. H. Bhosale and L. D. Jadhav, J. Mater. Sci.: Mater. Electron., 2016, 27, 795 CrossRef CAS.
- G. S. Lewis, A. Atkinson, B. C. H. Steele and J. Drennan, Solid State Ionics, 2002, 152–153, 567 CrossRef CAS.
- M. I. Sosulnikov and Y. A. Teterin, J. Electron Spectrosc. Relat. Phenom., 1992, 59(2), 111 CrossRef CAS.
- P. A. W. Van Der Heide, Surf. Interface Anal., 2002, 33(5), 414 CrossRef CAS.
- Z. X. Shen, et al. , Phys. Rev. B, 1990, 42(3), 1817 CrossRef CAS.
- M. A. Langell, M. D. Anderson, G. A. Carson, L. Peng and S. Smith, Phys. Rev. B, 1999, 59(7), 4791 CrossRef CAS.
- H. H. B. P. Jacobs, A. Maltha, J. G. H. Reintjes, J. Drimal and V. Ponec, J. Catal., 1994, 147(1), 294 CrossRef.
- H. C. Yao and M. Shelef, J. Phys. Chem., 1974, 78(24), 2490 CrossRef CAS.
- R. C. Maher, P. R. Shearing, E. Brightman, D. J. L. Brett, N. P. Brandon and L. F. Cohen, Adv. Sci., 2016, 3, 1500146 CrossRef PubMed.
- V. G. Hadjiev, M. N. Iliev and I. V. Vergilov, J. Phys. C: Solid State Phys., 1988, 21, L199 CrossRef.
- T. Jakubek, W. Kaspera, P. Legutko, P. Stelmachowski and A. Kotarba, Catal. Commun., 2015, 71, 37 CrossRef CAS.
- X. Liu and C. T. Prewitt, Phys. Chem. Miner., 1990, 17, 168 CrossRef CAS.
- A. J. Varkey and A. F. Fort, Sol. Energy Mater. Sol. Cells, 1993, 31, 277 CrossRef CAS.
- J. Druce and J. A. Kilner, J. Electrochem. Soc., 2014, 161(1), F99 CrossRef CAS.
Footnote |
| † Electronic supplementary information (ESI) available. See DOI: 10.1039/c7ta10990c |
| This journal is © The Royal Society of Chemistry 2018 |