 Open Access Article
Creative Commons Attribution 3.0 Unported Licence
Highly packed graphene–CNT films as electrodes for aqueous supercapacitors with high volumetric performance†
Noel
Díez
 *a,
Cristina
Botas
 a,
Roman
Mysyk
a,
Eider
Goikolea
a,
Teófilo
Rojo
a,
Roman
Mysyk
a,
Eider
Goikolea
a,
Teófilo
Rojo
 ab and
Daniel
Carriazo
 *ac
*ac
aCIC EnergiGUNE, Parque Tecnológico de Álava, Albert Einstein 48, 01510 Miñano, Álava, Spain. E-mail: ndiez@cicenergigune.com; dcarriazo@cicenergigune.com
bDepartamento de Química Inorgánica, Universidad Del País Vasco UPV/EHU, 48080 Bilbao, Spain
cIKERBASQUE, Basque Foundation for Science, 48013 Bilbao, Spain
First published on 24th January 2018
Abstract
The increasing complexity of portable electronics demands the development of energy storage devices with higher volumetric energy and power densities. In this work we report a simple strategy for the preparation of partially reduced graphene oxide/carbon nanotube composites (prGO–CNT) as highly packed self-standing binder-free films suitable as electrodes for supercapacitors. These carbon-based films are easily obtained by the hydrothermal treatment of an aqueous suspension of graphene oxide and CNTs at 210 °C and then compacted under pressure. The prGO–CNT films, which had an apparent density as high as 1.5 g cm−3, were investigated as binder-free electrodes for aqueous supercapacitors using 6 M KOH solution as the electrolyte. The results show that the presence of merely 2 wt% of CNTs produces a significant enhancement of the capacitance retention at high current densities compared to the CNT-free samples, and this improvement is especially relevant in systems formed using electrodes with high mass loadings. Volumetric capacitance values of 250 F cm−3 at 1 A g−1 with outstanding capacitance retention (200 F cm−3 at 10 A g−1) were achieved using the prGO–CNT electrodes with an areal mass loading above 12 mg cm−2.
Introduction
Electrochemical capacitors (ECs), generally known as supercapacitors, are energy storage devices that exhibit higher energy than conventional capacitors and larger power than batteries.1,2 ECs can store energy by two different mechanisms: (i) in a purely electrostatic way through the formation of an electrical double layer (EDL) between the ions from the electrolyte and the surface of the electrodes or (ii) through fast and reversible faradaic reactions undergone by redox species present at the surface of the electrodes.3,4 None of these mechanisms involve the insertion of ions into the electrode lattice, enabling a fast charge–discharge and ensuring a very long cycle life. Porous carbons, particularly activated carbons, are the most used materials for the fabrication of EC electrodes due to their large specific surface area, high electrical conductivity, inertness and moderate cost. Unfortunately, these carbons have a very low density (generally below 0.7 g cm−3) due to the presence of porosity that is needed for sizeable non-faradaic charge storage. The wide pores are flooded with the electrolyte, which contributes to a dispensable weight excess of the device but not to the energy stored. This limits the volumetric energy and power density of ECs, hindering their use in portable electronics.5Graphene, an allotrope of carbon consisting of a monolayer of carbon atoms with outstanding electronic, thermal and mechanical properties, has been recently put forward as a promising candidate to replace porous carbons in ECs.6 The open surface of graphene allows fast ion adsorption/desorption,7 which translates into devices with higher power densities. Moreover, the use of graphene in the electrode formulation also enables its processing as a flexible self-standing and binder-free film with enhanced mechanical properties that are suitable for flexible energy storage systems.8 Electrodes processed in this way could be directly assembled into the cell with neither adding any conductive additive or binder, nor using any support. This is not a trivial issue since binders generally represent up to 10 wt% of the whole electrode mass and do not contribute to capacitance; in contrast, they can have a negative influence on the conductivity of the electrode or the capacitance, by partially blocking the active sites where ions are adsorbed to form the EDL.9
Over the last few years, most efforts have been devoted to increasing the gravimetric energy density of ECs without addressing other important features such as volumetric energy and power densities, which, in the particular case of portable electronics, are more realistic parameters.10 Within this context and with the aim of achieving high volumetric energy densities, several research groups have recently reported the synthesis of high density graphene-based materials for their use as electrodes in ECs. Yang et al. reported the assembly of chemically hydrazine-reduced graphene oxide into self-standing films with densities of 1.49 g cm−3; a symmetric EC made out of these films and using an electrode mass loading of 1 mg cm−2 showed a capacitance of ca. 195 F cm−3 at 10 A g−1 when 1 M H2SO4 was used as the electrolyte.11 Tao et al. also reported the preparation of high density (1.58 g cm−3) reduced graphene oxide monoliths by the hydrothermal reduction of graphene oxide (GO) and subsequent vacuum drying, which reached a volumetric capacitance of ca. 280 F cm−3 at 10 A g−1 using a 6 M KOH aqueous solution as the electrolyte.12 Sevilla et al. detailed the synthesis of solvated graphene films with high areal mass and a density of 1.1 g cm−3, which exhibited a cell capacitance of 47 F cm−3 at 0.1 A g−1 as well as a good capacitance retention.13 Fan and co-workers reported the preparation of densely packed graphene nanomesh-carbon nanotube (CNT) films of ca. 0.5 mg cm−2 that exhibited a volumetric capacitance of 331 F cm−3 in a 3-electrode configuration at a scan rate of 5 mV s−1 using 6 M KOH as the electrolyte.14 Also, Fan and co-workers reported volumetric capacitance values as high as 400 F cm−3 on ozone-treated GO electrodes with a mass of ca. 2 mg cm−2 tested in 1 M Na2SO4 aqueous electrolyte.15 On the other hand, Gogotsi and co-workers reported the preparation of very high density (3.1 g cm−3) self-standing binder-free electrodes of MXene/graphene composites showing a high volumetric capacitance (1040 F cm−3) using 3 M H2SO4 solution as the aqueous electrolyte.16 Composites formed using carbon nanotubes and graphene have shown their suitability as electrodes for supercapacitors.17,18 However, as in many of the above cited studies, these data are based on experiments using electrodes with a too low mass loading, which can lead to the overestimation of their electrochemical performance.17–19 Also, these synthetic methods should tend towards more simplistic approaches combined with an easy processability of materials with a view to their upscaling.
In this work we present a novel and simplistic method for the preparation of partially reduced graphene oxide–carbon nanotube (prGO–CNT) self-standing binder-free films. The composites are prepared by the hydrothermal treatment of a mixture of GO and carbon nanotubes (CNTs), yielding a hydrated self-assembled composite that is finally compressed to obtain high density thin films with tuned areal carbon loading. These prGO–CNT self-standing films were directly assembled as binder-free electrodes in symmetric cells showing a very high volumetric capacitance of 250 F cm−3 at 1 A g−1. The homogenous insertion of CNTs into the continuous 3D graphene network provided outstanding capacitance retention at high current densities even in electrodes with mass loadings above 12 mg cm−2 (ca. 200 F cm−3 at 10 A g−1).
Experimental section
Synthesis of high density prGO–CNT composite films
Highly packed prGO–CNT films were obtained by the hydrothermal treatment of 85 mL of a 2 mg mL−1 aqueous GO suspension (Graphenea) containing multi-walled carbon nanotubes (MWCNTs, Aldrich) at a concentration of 0.04 mg mL−1. This proportion was defined assuming, on the dry basis, a contribution of 98 wt% of GO and 2 wt% of MWCNTs. The mixture was sonicated for 30 min, sealed in a Teflon-lined autoclave and heated at 210 °C for 24 h. After cooling down to room temperature, the self-standing carbon monoliths were removed from the autoclave and washed with abundant distilled water. In order to obtain self-standing electrodes of different masses, the monoliths were sliced at different thicknesses and then pressed in the solvated state at 8 tons between two stainless-steel plates. This simplistic procedure was previously adopted by Sevilla and co-workers for the processing of graphene hydrogels containing hematite nanoparticles into films.13 The films were finally dried overnight at 80 °C between the two stainless-steel plates to keep a flat shape of the films. For comparison purposes, prGO films were obtained in the same way but without adding the CNTs to the initial GO suspension.Characterization
X-ray diffraction (XRD) patterns were obtained for the powdered samples using a Bruker D8 X-ray diffractometer; data were collected at 40 kV and 30 mA using CuKα radiation over 2θ within the range from 5 to 90° at steps of 0.02° and a residence time of 5 s. Raman spectra were recorded with a Renishaw spectrometer (Nanonics Multiview 2000) operating at an excitation wavelength of 532 nm. Spectra were acquired with a 10 s exposure time of the sample to the laser beam. Scanning electron microscope (SEM) images were acquired using a field emission Quanta 200 FEG microscope from FEI. Nitrogen adsorption–desorption isotherms were obtained using an ASAP2020 instrument from Micromeritics. The samples were outgassed at 80 °C for 48 h prior to the analysis. Specific surface area values were determined using the BET equation within the 0.05–0.2 relative pressure range. Carbon and oxygen contents were determined using a Flash 2000 organic elemental analyzer from Thermo Scientific.X-ray photoelectron spectroscopy (XPS) measurements were carried out using a UHV spectrometer chamber with base pressure below 10−10 mbar. The chamber features a hemispherical analyser PHOIBOS 150 with a 2D-DLD detector (SPECS) and a monochromated X-ray source FOCUS 500 (SPECS) with two anodes: Al Kα (hν = 1486.74 eV) and Ag Lα (hν = 2984.3 eV).
Electrode assembly and electrochemical measurements
To perform the electrochemical measurements, two electrodes with a diameter of 11 mm and similar mass loadings (ranging from 5 to 14 mg cm−2) were punched from the dense films and directly assembled in a Swagelok™-type cell placing a porous glass fiber (Whatman GFB) membrane in-between as the separator. The electrodes and the separator were wetted with a couple of drops of 6 M KOH, and two stainless steel rods were used as current collectors. Cyclic voltammetry (CV) and galvanostatic charge–discharge cycling (GC) measurements were conducted using a multichannel VMP3 generator from Biologic. The specific capacitance expressed in farads per electrode volume (F cm−3) was obtained from the discharge curve of the galvanostatic plots recorded at different current densities according to the equation C = 2(Itd/mV)ρe, where I is the electrical current (A), V is the usable voltage range once the ohmic drop is subtracted (V), td is the discharge time (s), m is the mass of one electrode (g) and ρe corresponds to the apparent density of the electrodes (g cm−3). Equivalent series resistance (ESR, in Ohm cm2) was calculated from the voltage drop Vd according to the equation Vd = 2I(ESR/0.95). The specific energy expressed as W h dm−3 was obtained according to the equation:where ED is the discharge energy (W h dm−3), ρe is the density of the electrode (g cm−3), I is the current (A), t(Umin) and t(Umax) are the time corresponding to the maximum and minimum voltages in the discharge portion of a galvanostatic cycle (s), U(t) is the instant voltage (V) and me is the mass of one electrode in a symmetric cell (g). The power density (P, in W dm−3) was calculated according to:
Results and discussion
As shown in Scheme 1, the highly packed carbon films were obtained by a clean and simple procedure using GO (prGO film) or GO and MWCNTs (prGO–CNT film) as precursors and water as the reaction medium. During the hydrothermal treatment, superheated water promoted the removal of oxygen functional groups from GO as well as the cross-linking of moieties present on neighboring sheets, giving rise to self-assembled solvated hydrogels of prGO. When a small amount of MWCNTs (2 wt% on the dry basis) was added to the GO suspension and subjected to hydrothermal conditions, a clear supernatant together with the carbon monolith was obtained. This observation indicates that all of the CNTs were successfully incorporated into the partially reduced graphene oxide monolith.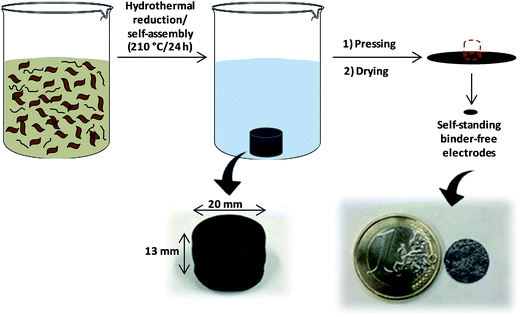 | ||
| Scheme 1 Schematic of the procedure followed for the preparation of high density prGO and prGO–CNT films. | ||
The as-obtained monoliths presented internal voids created by the evolution of CO2 during the hydrothermal reduction of GO.20 As shown in Fig. S1,† the size of the internal voids increased with the temperature of hydrothermal treatment and, in contrast, the size of the monoliths decreased. These two facts reveal that monoliths obtained at the highest temperature (210 °C) have a more compact bulk microstructure. It must be remarked that, due to a certain degree of plasticity that the solvated monoliths have, all the voids generated during the hydrothermal treatment collapsed upon the subsequent mechanical pressing at 8 tons. The prGO hydrogels obtained at 210 °C and pressed at 8 tons had an apparent density as high as ca. 1.5 g cm−3. The addition of 2 wt% of MWCNTs to the GO suspension did not exert a significant influence on the density of the prGO–CNT films obtained at the same temperature, which was also of ca. 1.5 g cm−3. prGO hydrogels obtained at 180 and 150 °C and pressed had lower densities of ca. 1.4 g cm−3 and 1.0 g cm−3, respectively.
The oxygen content of the initial GO (41–50 wt%, according to the manufacturer's specifications) decreased to 24.7 wt% and 20.1 wt% in the prGO and prGO–CNT hydrogels, respectively, as a consequence of their hydrothermal reduction in the presence of superheated water. The lower oxygen content in the prGO–CNT film agrees with the presence of 2 wt% of CNTs in the GO suspension, and this proportion becomes higher (3–4 wt%) in the partially reduced monolith after the hydrothermal treatment. The chemical composition of GO and prGO was further investigated by X-ray photoelectron spectroscopy (XPS) measurements. Integration of the peaks in the general spectra revealed oxygen contents of 43 and 21 wt% for GO and prGO, respectively, which are in agreement with the values obtained from elemental analysis. The high resolution XPS O1s and C1s spectra are shown in Fig. S2.† The intensity of the O1s peak is noticeably lower in the case of prGO, which evidences the partial removal of oxygen functionalities during the hydrothermal treatment. Deconvolution of the C1s peak confirmed that oxygen single-bonded to carbon (hydroxyl and epoxy groups) was preferentially removed under hydrothermal conditions.21 The contribution of the C–O deconvolution peak to the total C1s signal was 54 and 19% for GO and prGO, respectively, whilst the proportion of oxygen double-bonded to carbon did not change significantly (8 and 7% for GO and prGO, respectively).
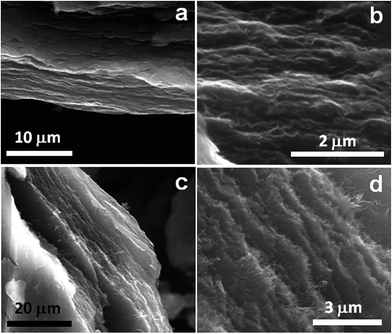
In order to get insight into the microstructure of the prGO and the prGO–CNT films, these samples were observed by scanning electron microscopy (SEM). Fig. 1 displays some representative SEM images obtained for both self-standing films at different magnifications. The low magnification image acquired for the prGO film in Fig. 1a shows that these films are formed by graphene layers with a preferential orientation in parallel stacking due to the pressing. Large magnification images (Fig. 1b) disclose that all of the graphene planes are very well interconnected forming a highly compact 3D structure without large macropores. As shown in Fig. 1c and d, the addition of 2 wt% of MWCNTs did not modify the morphology of the graphene-based film, in which the CNTs appear homogeneously distributed.
XRD patterns of prGO and prGO–CNT films are shown in Fig. 2. Both XRD spectra exhibited a broad and low intensity (002) diffraction peak at 2θ ∼ 24° – which corresponds to an interlayer spacing of 3.6 Å, suggesting that the graphene sheets were partially restacked after hydrothermal reduction and pressing. The intensity of this peak was lower for the prGO–CNT film, suggesting that the homogenous intercalation of CNTs within the graphene-based film prevents the partial restacking of the partially reduced graphene oxide films. These highly packed films were further analyzed by Raman spectroscopy (Fig. 2b). The Raman spectra showed two characteristic bands at 1593 cm−1 (G band, originating from the first-order scattering of E2g phonons by the graphitic planes) and 1352 cm−1 (D band, arising from a breathing mode of k-point phonons of Ag1 symmetry). These two bands – attributable to the presence of ordered graphitic domains and structural defects in the graphene nanosheets respectively – overlap in both spectra, which is consistent with the very small amount of CNTs (only 2 wt%) used in the synthesis of the prGO–CNT films.
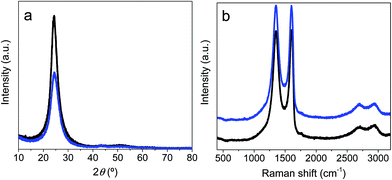 | ||
| Fig. 2 XRD patterns (a) and Raman spectra (b) obtained for the prGO (black) and prGO–CNT (blue) films. | ||
The textural properties of the high-density films were evaluated by nitrogen adsorption–desorption measurements at −196 °C. The isotherms of both samples, shown in Fig. 3, are a combination of type I and IV profiles defined by the IUPAC classification.22 These isotherms are characteristic of materials containing both micro- and mesopores, in these cases given by the presence of small cavities between two graphene layers, between the CNTs and the graphene layers, or due to the presence of defects or holes within the graphene sheets. The main difference between the isotherms obtained for these two samples corresponds to the amount of adsorbed nitrogen, which is higher in the case of prGO–CNT compared to the CNT-free film. The BET specific surface area of prGO and prGO–CNT films was 160 and 240 m2 g−1, respectively. This increase in the amount of adsorbed gas can be ascribed to the homogeneous intercalation of CNTs in between graphene layers that prevented the restacking of graphene sheets, thus making the inner film surface more accessible.
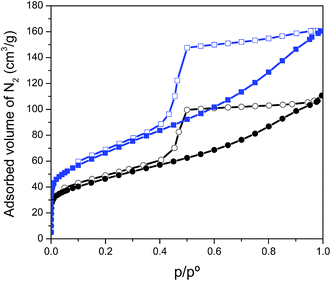 | ||
| Fig. 3 Nitrogen adsorption (filled symbols) and desorption (empty symbols) isotherms obtained at −196 °C for the prGO (black) and prGO–CNT (blue) films. | ||
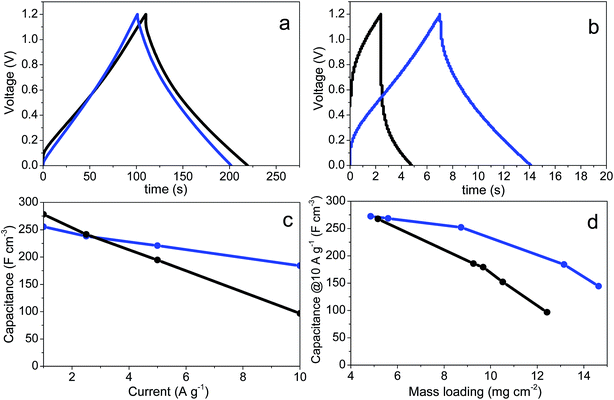
Self-standing binder-free disc-shaped electrodes were cut out of the prGO and prGO–CNT films and directly assembled into symmetric ECs for their electrochemical testing using 6 M KOH aqueous solution as the electrolyte. In order to obtain electrodes within a broad range of areal masses, the solvated monoliths were sliced to different thicknesses before pressing. Representative GC charge–discharge curves of ECs using electrodes of ca. 13 mg cm−2 are depicted in Fig. 4a and b. At a current density of 1 A g−1, both samples exhibit a quasi-linear voltage increase/decrease at the charge and discharge (Fig. 4a), characteristic of the non-faradaic (EDL) and faradaic (pseudocapacitance) capacitive charge storage mechanisms taking place. The volumetric capacitance values of prGO and prGO–CNT films at 1 A g−1 were as high as 278 and 255 F cm−3, respectively. The capacitance of prGO–CNT was slightly lower presumably due to the low contribution of the CNTs to the capacitance. These high capacitance values are the result of a combination of high gravimetric capacitance, given by a strong contribution of pseudocapacitance and their accessible surface area, and a very compact carbonaceous microstructure free of large empty voids. At higher current densities, the prGO–CNT film showed much better capacitance retention (Fig. 4c). At 2.5 A g−1 both samples had the same capacitance (238 F cm−3) and, at a high current rate of 10 A g−1, the capacitance of the prGO–CNT film was twice as high as that of CNT-free electrodes (184 F cm−3 and 97 F cm−3, respectively). The charge–discharge curves obtained at a higher current rate of 10 A g−1 (Fig. 4b) show, in the case of the prGO film, a high voltage drop at the beginning of the discharge, and this is much smaller in the case of the composite. The ESR of the device built with prGO electrodes, calculated from the voltage drop in the discharge profile, was 2.01 Ohm cm2. The ESR calculated for the SC made of CNT-containing films was as low as 0.68 Ohm cm2. According to these results, the presence of CNTs clearly improved the conductivity of the self-standing electrodes even at such a low concentration. This, together with a better electrolyte accessibility to the carbon surface due to the CNT intercalation in between graphene layers, allowed the fast charge and discharge of the electrochemical device keeping a high capacitance retention at high current densities.
As shown in Fig. 4d, the improvement provided by the insertion of CNTs into the graphene-based self-standing films is especially noticeable in electrodes with a high mass loading. This is of remarkable relevance, as these results can be directly extrapolated to commercial devices using electrodes with similar active mass loadings. In contrast, the electrodes with mass loadings of ca. 5 mg cm−2 have a similar electrochemical performance (Fig. 4d and S3†). This behavior was confirmed by CV. Fig. 5a and b show the cyclic voltammograms obtained for prGO and prGO–CNT films with lower (5 mg) and higher (13 mg) mass loadings at a scan rate of 100 mV s−1. The CV curves of the films with a mass loading of ca. 5 mg cm−2 present a quasi-rectangular profile and they almost overlap. When using electrodes with larger masses, the behavior of the samples differs. The prGO–CNT film still maintains a rectangular-shaped profile at a sweep rate of 100 mV s−1, in agreement with its good capacitance retention at high current densities. In contrast, the prGO film showed a very highly distorted profile typical of a more resistive material.
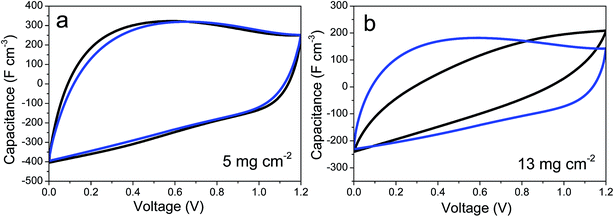 | ||
| Fig. 5 Cyclic voltammetry curves of prGO (black) and prGO–CNT (blue) films recorded at 100 mV s−1 in symmetric ECs with electrodes of low (a) and high (b) mass loadings. | ||
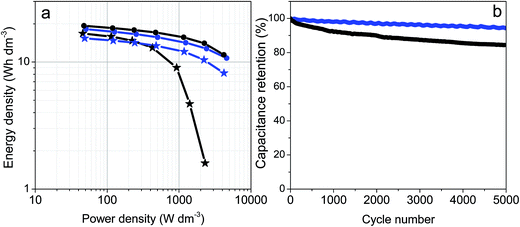
Fig. 6a includes the Ragone plots comparing the volumetric energy and power densities for the prGO and prGO–CNT films with high and low electrode mass loadings. Volumetric energy densities above 15 W h dm−3 @ 50 W dm−3 were obtained for both materials irrespective of the electrode mass. The electrodes with low mass loading as well as the prGO–CNT electrodes with high mass loading kept high energy densities at power densities above 4 kW dm−3. It should be highlighted that the prGO–CNT film with a mass loading of 13 mg cm−2 had a high energy density of 8.2 W h dm−3 @ 4.2 kW dm−3, while its CNT-free counterpart failed at power densities above 2 kW dm−3.
Fresh cells were assembled using prGO and prGO–CNT films with mass loadings of ca. 13 mg cm−2 and then they were cycled at 10 A g−1 for 5000 cycles. The prGO–CNT film exhibited an excellent capacitance retention, maintaining 97% of its initial capacitance after 5000 cycles. The cycling performance of prGO–CNT was better than that shown by the CNT-free electrodes, which suffered from a decay of 15% after a similar number of cycles.
The improved capacitance retention observed for the prGO–CNT sample can be tentatively ascribed to the activation of some internal functional groups that become progressively accessible upon cycling due to the CNT pillaring effect.
Conclusions
Herein we have presented a simplistic procedure for the preparation of high-density (ca. 1.5 mg cm−3), highly packed, partially reduced graphene oxide–CNT (prGO–CNT) composites. These flexible films can be easily assembled into supercapacitor cells and used as self-standing binder-free electrodes. The incorporation of a minute amount of carbon nanotubes (only 2 wt%) brings about a significant improvement in both capacitance retention at high current densities as well as the cycling stability compared to the CNT-free counterpart. This enhancement is especially relevant in the cells built with high mass loading electrodes. The high volumetric capacitance and outstanding capacitance retention obtained for prGO–CNT electrodes with masses above 12 mg cm−2 (250 and 200 F cm−3 at 1 and 10 A g−1, respectively) make these films promising electrode materials for their implementation in portable energy storage systems.Conflicts of interest
The authors declare no conflict of interest in this article.Acknowledgements
This work was financially supported by the European Union (Graphene Flagship, Core 1) and the Spanish Ministry of Economy and Competitiveness (MINECO/FEDER) (MAT2015-64617-C2-2-R). The authors also thank GRAPHENEA Company for supplying the graphene oxide used in this study. We also thank Dr Oleksandr Bondarchuk for his fruitful help on the XPS data acquisition.References
- B. E. Conway, Electrochemical Capacitors. Scientific Fundamentals and Technological Applications, Kluwer Academic, New York, 1999 Search PubMed.
- P. Simon and Y. Gogotsi, Nat. Mater., 2008, 7, 845 CrossRef CAS PubMed.
- R. Kötz and M. Carlen, Electrochim. Acta, 2000, 45, 2483 CrossRef.
- E. Frackowiak and F. Beguin, Carbon, 2001, 39, 937 CrossRef CAS.
- L. L. Zhang and X. S. Zhao, Chem. Soc. Rev., 2009, 38, 2520 RSC.
- Y. Wang, Z. Shi, Y. Huang, Y. Ma, C. Wang, M. Chen and Y. Chen, J. Phys. Chem. C, 2009, 113, 13103 CAS.
- L. L. Zhang, X. Zhao, M. D. Stoller, Y. Zhu, H. Ji, S. Murali, Y. Wu, S. Perales, B. Clevenger and S. Ruoff, Nano Lett., 2012, 12, 1806 CrossRef CAS PubMed.
- C. Botas, D. Carriazo, W. Zhang, T. Rojo and G. Singh, ACS Appl. Mater. Interfaces, 2016, 8, 28800 CAS.
- N. Diez, C. Botas, E. Goikolea and D. Carriazo, J. Mater. Sci., 2017, 52, 11191 CrossRef CAS.
- Q. Wang, J. Yan and Z. Fan, Energy Environ. Sci., 2016, 9, 729 CAS.
- X. Yang, C. Cheng, Y. Wang, L. Qiu and D. Li, Science, 2013, 341, 534 CrossRef CAS PubMed.
- Y. Tao, X. Xie, W. Lv, D. M. Tang, D. Kong, Z. Huang, H. Nishihara, T. Ishii, B. Li, D. Golberg, F. Kang, T. Kyotani and Q. H. Yang, Sci. Rep., 2013, 3, 2975 CrossRef PubMed.
- M. Sevilla, G. A. Ferrero, T. T. Vu and A. B. Fuertes, ChemNanoMat, 2016, 2, 33 CrossRef CAS.
- L. Jiang, L. Sheng, C. Long and Z. Fan, Nano Energy, 2015, 11, 471 CrossRef CAS.
- L. Jiang, L. Sheng, C. Long, T. Wei and Z. Fan, Adv. Energy Mater., 2015, 5, 1500771 CrossRef.
- J. Yan, C. E. Ren, K. Maleski, C. B. Hatter, B. Anasori, P. Urbankowski, A. Sarycheva and Y. Gogotsi, Adv. Funct. Mater., 2017, 27, 1701264 CrossRef.
- Q. Cheng, J. Tang, J. Ma, H. Zhang, N. Shinya and L. C. Qin, Phys. Chem. Chem. Phys., 2011, 13, 17615 RSC.
- Z. Fan, J. Yan, L. Zhi, Q. Zhang, T. Wei, J. Feng, M. Zhang, W. Qian and F. Wei, Adv. Mater., 2010, 22, 3723 CrossRef CAS PubMed.
- M. D. Stoller and R. S. Ruoff, Energy Environ. Sci., 2010, 3, 1294 CAS.
- K. Hu, X. Xie, T. Szkopek and M. Cerruti, Chem. Mater., 2016, 28, 1756 CrossRef CAS.
- N. Diez, A. Sliwak, S. Gryglewicz, B. Grzyb and G. Gryglewicz, RSC Adv., 2015, 5, 81831 RSC.
- K. S. W. Sing, Pure Appl. Chem., 1985, 57, 603 CrossRef CAS.
Footnote |
| † Electronic supplementary information (ESI) available. See DOI: 10.1039/c7ta10210k |
| This journal is © The Royal Society of Chemistry 2018 |


