 Open Access Article
Creative Commons Attribution 3.0 Unported Licence
A ferronematic slab in external magnetic fields
Grigorii
Zarubin
 *ab,
Markus
Bier
 abc and
S.
Dietrich
ab
aMax-Planck-Institut für Intelligente Systeme, Heisenbergstr. 3, 70569 Stuttgart, Germany. E-mail: zarubin@is.mpg.de; bier@is.mpg.de; dietrich@is.mpg.de
bInstitut für Theoretische Physik IV, Universität Stuttgart, Pfaffenwaldring 57, 70569 Stuttgart, Germany
cFakultät Angewandte Natur- und Geisteswissenschaften, Hochschule für angewandte Wissenschaften Würzburg-Schweinfurt, Ignaz-Schön-Str. 11, 97421 Schweinfurt, Germany
First published on 28th November 2018
Abstract
The behavior of a uniformly magnetized ferronematic slab is investigated numerically in a situation in which an external magnetic field is applied parallel and antiparallel, respectively, to its initial magnetization direction. The employed numerical method allows one to determine hysteresis curves from which a critical magnetic field strength (i.e., the one at which the ferronematic sample becomes distorted) as a function of the system parameters can be inferred. Two possible mechanisms of switching the magnetization by applying a magnetic field in the antiparallel direction are observed and characterized in terms of the coupling constant between the magnetization and the nematic director and in terms of the coupling strength of the nematic liquid crystal and the walls of the slab. Suitably prepared walls allow one to combine both switching mechanisms in one setup, such that one can construct a cell, the magnetization of which can be reversibly switched off.
I. Introduction
Ferronematics, i.e., suspensions of anisotropic ferromagnetic particles dispersed in a nematic liquid crystal (NLC), attract both theoretical1–8 and experimental9–14 interest due to their ability to exhibit fluidity due to the solvent, and macroscopic magnetization, due to colloidal inclusions. The anisotropic nature of the solvent implies broken rotational symmetry as compared to a simple isotropic liquid. The interaction of the anisotropic ferromagnetic colloids with the solvent depends on the orientation of the former with respect to the nematic director of the latter. As a result, the individual magnetic moments of the colloids become effectively trapped around the two possible orientations of the nematic order. Therefore, suitably prepared samples can exhibit a macroscopically ferromagnetic phase. The phase behavior of this complex system follows from its free energy density. The authors of ref. 10 proposed a phenomenological expression thereof which is formulated in terms of the magnetization M and the nematic director n. A similar expression was derived analytically starting from a microscopic description of the system:15 | (1) |
One of the interesting results of the experiments reported in ref. 10 was the observation of a complex response of the ferronematic slab to a uniform external magnetic field, which depends on the initial state of the sample. If, on the one hand, the sample was prepared by quenching the NLC solvent from the isotropic into the nematic phase in the absence of an external magnetic field, the colloids formed various magnetic domains within which M‖n. If, on the other hand, the NLC solvent was quenched in the presence of a uniform magnetic field, a single domain was formed with the entire sample being magnetized in one direction with M‖n. Thereafter, applying a uniform external magnetic field opposite to the direction of the magnetization of the single-domain sample yielded a complex, optically observable response of a nonuniform director field.
Here we focus on the case of single-domain samples. So far, such samples have been thoroughly investigated theoretically in the situation in which the external magnetic field is applied perpendicular to the initial direction of magnetization of the sample.1,2,5 Also the dynamics of such a configuration was investigated experimentally.16–18 A thresholdless distortion of the nematic was observed. Moreover, the authors of ref. 1, 2 and 5 considered infinitely strong anchoring at the walls and external magnetic fields up to magnitudes strong enough to directly interact with the magnetically anisotropic NLC molecules.
Our aim is to investigate in detail the behavior of a monodomain sample exposed to a uniform external magnetic field which is applied in the direction antiparallel to the initial magnetization. Moreover, we consider only magnetic fields of small amplitudes (≤25 mT), such that the influence of the direct magnetic field on the NLC can be neglected. It was observed experimentally10,11 that, similar to common ferromagnets, ferronematics exhibit hysteresis in the magnetic properties as a function of the external field. Moreover, the critical field, i.e., the magnetic field strength at which the ferronematic becomes distorted (for a more precise definition, see Section III A below), is another feature of the ferronematic sample. We obtain the hysteresis curves numerically by using a conjugate-gradient technique in order to minimize an appropriate free energy functional of the ferronematic in slab geometry. From the hysteresis curves, one can infer the value of the critical magnetic field as a function of the parameters of the model and compare them with the expressions derived in ref. 10. In our previous study15 we derived the dependence of the coupling parameter γ on the microscopic coupling c, which in turn depends on the particle size. Obtaining the critical field as a function of γ allows us to relate it to the size of the colloids and therefore one can potentially tune the value of the critical field by tuning the mean of the size distribution of the particles used.
It turns out that the switching process of the considered ferronematic slab from one phase to the other takes place according to one of the two possible scenarios, which we shall discuss. In the first scenario, regions nucleate near the system walls in which the magnetization is flipped, whereas the nematic director is kept in place by the walls. In the second scenario, the nematic director follows the magnetization, i.e., it makes a full rotation by 180°, everywhere throughout the sample.
Finally, we propose a novel technique which can be used, e.g., in data storage devices. It is based on magnetic fields which control the magneto-optical properties of ferronematic cells, and thus allows one to switch between magnetized and demagnetized states by applying a uniform magnetic field of suitable orientation.
The paper is organized as follows. In Section II we introduce the free energy functional in order to describe the system and the numerical method to minimize it. Section III A describes the first of the two switching mechanisms and presents the results concerning the critical magnetic field and its dependence on the parameters of the model. In Section III B we present the second switching mechanism and provide a map which relates the parameters of the model to the character of the switching. In Section III C we report that a combination of the two mechanisms leads to a sample the magnetization of which can be reversibly switched off by using the external magnetic field. The role of the phenomenon of segregation is discussed in Section IV. In Section V we conclude by discussing the main results.
II. Numerical model
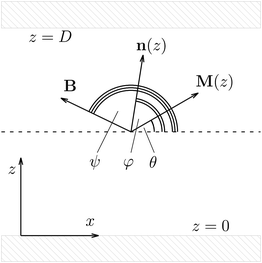
We consider the experimental setup described in ref. 10. It consists of a ferronematic slab confined between two parallel and planar walls at a distance D with ex as the so-called easy axis at both surfaces, which imposes a parallel orientation of the nematic director there (see Fig. 1). We assume that the sample was prepared in the presence of a homogeneous external magnetic field B = Bex in the direction parallel to the easy axis ex of the walls (i.e., B > 0), thus producing a single domain of the ferromagnetic phase. In the following, the effect of applying an external magnetic field in the direction opposite to the one used during this preparation (i.e., B < 0) is investigated numerically. The system is described by two spatially varying fields: the nematic director field n(r) and the magnetization field M(r). We assume that the absolute value of the magnetization is spatially constant, |M(r)| = const = mρiso, where m is the absolute value of the magnetic moment of a single colloid, here taken to be 3 × 10⁻¹⁸ A m2,10 and ρiso is the number density of the colloids dispersed in the isotropic phase of the liquid crystal during the preparation of the sample (see ref. 10 and 15), i.e., segregation effects are assumed to be small.19 (For a discussion on the possible influence of segregation, see Section IV). Due to the translational invariance in the lateral x–y-plane, all physical quantities depend only on the normal coordinate z. We consider that both n(z) and M(z)/(mρiso) are parallel to the x–z-plane20 so that they can be described by the angles φ(z) and θ(z), respectively (see Fig. 1). The initial configuration is given by the uniform profiles φ(z) = 0 and θ(z) = 0, which corresponds to an unstable state when a uniform magnetic field B is applied in the direction ψ = π (see Fig. 1). In terms of the profiles φ and θ, the free energy functional of the system is given by: | (2) |
 | (3) |
 | (4) |
 | (5) |
The equilibrium profiles φ(z) and θ(z) correspond to the minimum of the free energy in eqn (2), which has been determined numerically using the Fletcher–Reeves–Polak–Ribiere general function minimization algorithm.21 The absolute value |M| of the magnetization is assumed to have a constant value mρiso and is taken to be independent of the external field B throughout Section III. For the discussion of the problem in the case of a spatially varying |M|, see Section IV.
We have used the following parameter values: K = 3.5 × 10⁻¹² N, ρiso = 1.5 × 10¹⁹ m−3, m = 3 × 10⁻¹⁸ A m2, and T = 300 K. These values are consistent with the experimental data reported in ref. 10 and 11. The thickness D of the slab is taken to be 20 μm throughout Section III. Thicker slabs are considered in Section IV.22,23
III. Results
A. Switching mechanism I and the critical field
The experiments in ref. 10 and 11 demonstrate that upon applying a uniform external magnetic field to the setup described in Section II (see also Fig. 1), there is a nonvanishing critical magnetic field strength Bcr = Bcrex such that for B < Bcr < 0 (B > Bcr > 0) in the case of an initial magnetization pointing along the positive (negative) x-direction, elastic distortions of the liquid crystal matrix occur. The occurrence of such a critical magnetic field strength Bcr can be explained qualitatively in terms of a diverging relaxation time of the fluctuations of the nematic director field n (or φ) (see ref. 10). Here we aim at exploring the dependence of Bcr on the coupling constant γ and the wall anchoring strength Wwall.24 Moreover, we are also interested in the intermediate metastable states preceding the switching of the magnetization field M to the ground state parallel to the external field B.
Fig. 2 shows the hysteresis curve of the spatially averaged projection of the magnetization  onto the x-axis
 | (6) |
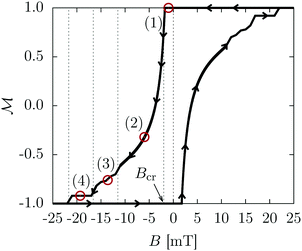 | ||
Fig. 2 Hysteresis of the spatially averaged magnetization  along the x-direction (see eqn (6)) of the ferronematic slab as a function of the x-component B of the external magnetic field B. Negative values of along the x-direction (see eqn (6)) of the ferronematic slab as a function of the x-component B of the external magnetic field B. Negative values of  or B correspond to orientations in the negative x-direction (see Fig. 1). For initially saturated samples with or B correspond to orientations in the negative x-direction (see Fig. 1). For initially saturated samples with  (i.e., magnetized in the positive x-direction), there is a nonvanishing critical magnetic field Bcr < 0 (indicated in the plot) such that for B ∈ [Bcr,0], the magnetization (i.e., magnetized in the positive x-direction), there is a nonvanishing critical magnetic field Bcr < 0 (indicated in the plot) such that for B ∈ [Bcr,0], the magnetization  does not respond to the external field. Upon increasing the field in the negative x-direction (i.e., for B < Bcr, left branch of the loop), the system evolves through a series of qualitatively distinct metastable states (red circles) corresponding to the profiles displayed in Fig. 3 and eventually reaches saturation along the negative x-direction (i.e., does not respond to the external field. Upon increasing the field in the negative x-direction (i.e., for B < Bcr, left branch of the loop), the system evolves through a series of qualitatively distinct metastable states (red circles) corresponding to the profiles displayed in Fig. 3 and eventually reaches saturation along the negative x-direction (i.e.,  ). Gradually lowering the magnitude |B| of the magnetic field does not influence the magnetization of the sample (i.e., for B < 0, see the part of the loop along ). Gradually lowering the magnitude |B| of the magnetic field does not influence the magnetization of the sample (i.e., for B < 0, see the part of the loop along  ). After B = 0 is crossed, the situation is identical to the one described above up to a change of sign of B and ). After B = 0 is crossed, the situation is identical to the one described above up to a change of sign of B and  (right branch of the loop). Dotted vertical lines separate regions of qualitatively different metastable states. Note that state (1) corresponds to Bcr < B < 0. Wwall = 3.1 × 10⁻⁵ J m−2, γ = 240, K = 3.5 × 10⁻¹² N, ρiso = 1.5 × 10¹⁹ m−3, m = 3 × 10⁻¹⁸ A m2, and T = 300 K. (right branch of the loop). Dotted vertical lines separate regions of qualitatively different metastable states. Note that state (1) corresponds to Bcr < B < 0. Wwall = 3.1 × 10⁻⁵ J m−2, γ = 240, K = 3.5 × 10⁻¹² N, ρiso = 1.5 × 10¹⁹ m−3, m = 3 × 10⁻¹⁸ A m2, and T = 300 K. | ||
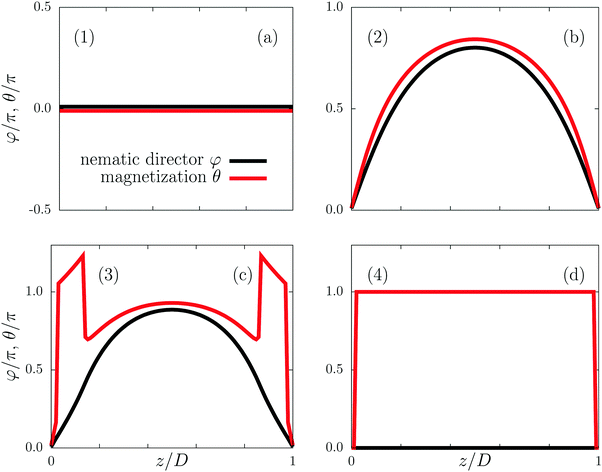 | ||
Fig. 3 Qualitatively distinct metastable states of the ferronematic along the hysteresis curve in Fig. 2 in terms of the profiles φ(z) of the nematic director field (black lines) and θ(z) of the local magnetization (red lines). State (1) (see the numbered states in Fig. 2): for magnetic fields B along the x-direction with components B > Bcr, the saturated profiles  are unperturbed by B. State (2): for magnetic field components B < Bcr, both profiles deviate significantly from the saturated ones. Note that the profiles in panel (1) correspond to a saddle point of the free energy so that spontaneous symmetry breaking can occur from state (1) to state (2) (i.e., the magnetization and the nematic director start to rotate in either clockwise or counterclockwise direction, see Fig. 1). The equally probable profiles which correspond to the same projection are unperturbed by B. State (2): for magnetic field components B < Bcr, both profiles deviate significantly from the saturated ones. Note that the profiles in panel (1) correspond to a saddle point of the free energy so that spontaneous symmetry breaking can occur from state (1) to state (2) (i.e., the magnetization and the nematic director start to rotate in either clockwise or counterclockwise direction, see Fig. 1). The equally probable profiles which correspond to the same projection  and thus correspond to the same points (1)–(4) on the hysteresis loop (see Fig. 2) are obtained by the map and thus correspond to the same points (1)–(4) on the hysteresis loop (see Fig. 2) are obtained by the map  for the profiles (a)–(d). State (3): upon further increasing the magnetic field strength in the negative x-direction, layers form near the walls where the magnetization interpolates between the direction along (θ large) and opposite (θ small) to the magnetic field. The coupling of the magnetization and the nematic director causes θ > π within the layers. State (4): for even stronger magnetic fields, the entire slab (besides the thin layers near the walls which require yet higher fields to switch) is magnetized along the direction of the magnetic field, i.e., θ = π. The values of the system parameters are the same as in Fig. 2. for the profiles (a)–(d). State (3): upon further increasing the magnetic field strength in the negative x-direction, layers form near the walls where the magnetization interpolates between the direction along (θ large) and opposite (θ small) to the magnetic field. The coupling of the magnetization and the nematic director causes θ > π within the layers. State (4): for even stronger magnetic fields, the entire slab (besides the thin layers near the walls which require yet higher fields to switch) is magnetized along the direction of the magnetic field, i.e., θ = π. The values of the system parameters are the same as in Fig. 2. | ||
For initially saturated samples with  , the magnetization does not change significantly in the presence of x-components of the magnetic field B > Bcr, whereas for B < Bcr, there is a noticable deviation of the x-component of the spatially averaged magnetization
  from the initial saturation value (see Fig. 2). This defines a critical magnetic field strength Bcr < 0. For B > Bcr, both the magnetization and the nematic director field profiles, i.e., θ(z) and φ(z), de facto do not deviate from the saturated ones (see Fig. 3(a)). Although the magnetization tends to align with the external magnetic field, due to the interaction described by the coupling constant γ, it drags the nematic director field along. At B = Bcr, the metastable state corresponding to the unperturbed nematic director becomes unfavorable compared to the metastable state corresponding to the perturbation induced in the interior of the slab (see Fig. 3(b)). We note that the saturated sample with
  in a magnetic field in the negative x-direction with B = Bcr corresponds to a saddle point of the free energy so that spontaneous symmetry breaking induced by fluctuations leads to perturbations of the magnetization orientation profile θ(z) with either θ(z) > 0 or θ(z) < 0. In the following we focus only on the first case, while the second, the conjugated one, follows from changing signs. It is the perturbed nematic director field that manifests as the brightening of the sample when viewed with crossed polarizers, as in the experiment reported in ref. 10, and it occurs only due to the coupling of the magnetization field M with the nematic director field n. The external magnetic field imposes a torque on the magnetization field which in turn leads to a torque on the nematic director field. The latter opposes the torque generated by the walls of the cell, which is transmitted due to the elasticity of the NLC (eqn (4)). Upon increasing the external magnetic field, the variations inside the slab become more and more pronounced for both the magnetization and the nematic director fields. However, in the case of soft anchoring25 (distinct from the case of infinitely strong anchoring, see ref. 26) at the surface of the colloid, the angle between the magnetization and the nematic director is nonzero for B < Bcr (see Fig. 1 and 3), i.e., θ ≠ φ.
Before reaching the magnetic phase with the sample being magnetized along the field in the negative x-direction, the system passes through the metastable state (3), as shown in Fig. 2, in which the magnetization profile θ(z) has a peculiar form (see Fig. 3(c) and 4). In this metastable state, the magnetization in the interior of the sample is aligned along the magnetic field. Within certain transition regions close to the walls, the orientation of the magnetization interpolates between the direction along the magnetic field and the opposite direction. These transition regions occur because the magnetization is coupled with the nematic director field, which is aligned along the easy axis (φ = 0) at the walls. The width of these transition regions grows upon increasing the external magnetic field strength so that eventually the minimum of the free energy given by eqn (2) corresponds to the magnetization being oriented parallel to the external magnetic field in the entire slab (θ = π). With regard to the transition regions, the following observations can be made. (i) Due to the soft coupling between the colloids and the nematic director field of the NLC, the ground state, in which the entire sample is magnetized along the external field, is attained by means of “switching” the magnetization locally, i.e., by inverting the direction of the magnetization (and thus of the orientation of the magnetic colloids) without the simultaneous rotation of the local nematic director field.27 (ii) Layers of the incipient ferronematic phase are nucleated in the regions close to the walls due to the interplay between the elastic and magnetic torques and because the coupling energy is invariant with respect to an inversion of the magnetization.
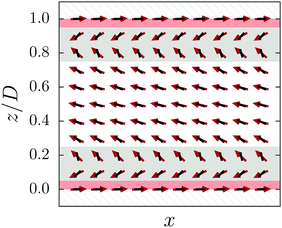 | ||
| Fig. 4 Explicit magnetization field (red arrows) and nematic director field (black rods) of the pretransitional metastable state (3) (see Fig. 2 and 3(c)) of the ferronematic slab in between two glass walls (hatched regions). While in the interior of the slab (white region) the magnetization field (red arrows) is, to a large extent, aligned with the external magnetic field in the negative x-direction, close to the walls (grey regions), its orientation interpolates between the configurations, being parallel and antiparallel to the magnetic field. This is due to the coupling with the nematic director field (black rods) which is aligned along the easy direction at the walls. Upon further increasing the strength of the external magnetic field in the negative x-direction (B < Bcr < 0), the grey regions widen and eventually produce an almost uniformly magnetized sample (see Fig. 3(d)). The pale red regions denote thin layers very close to the walls which undergo switching last. | ||
Naturally, the question concerning the dependence of the critical magnetic field strength Bcr on the coupling constant γ and on the wall anchoring Wwall arises. Here we define Bcr as the magnetic field strength at which the spatially averaged magnetization  equals 0.97; note that
  in the saturated state. This definition differs from the one used in ref. 10 and 11, where Bcr is defined as the magnetic field strength at which the relaxation time of thermal fluctuations of the direction of n diverges. Here we do not consider dynamic processes, instead we propose the above alternative definition of Bcr. Obviously, the choice of 0.97 as the threshold value has some degree of arbitrariness. However, as can be inferred from the steep slope of the hysteresis loop close to state (1) in Fig. 2, no significant changes are expected to occur by choosing different threshold values that are not too less than unity. Fig. 5 shows the dependence of Bcr on the coupling constant γ and the wall anchoring strength Wwall. One can infer from Fig. 5 that for fixed Wwall, the critical field Bcr increases upon increasing γ. Indeed, for a given value of Wwall, the magnetization field is aligned with the nematic director field, the rotation of which is opposed by the torque imposed by the walls. The system sustains the alignment even with increasing external magnetic field strengths, which in turn are caused by an increase in the strength of the coupling γ between the magnetization and the nematic director fields. One can also infer from Fig. 5 that the critical field Bcr depends rather weakly on the wall anchoring strength Wwall: within the considered range of anchoring strengths, Wwall ∈ [0.5 × 10⁻⁵, 10 × 10−5] J m−2; for fixed γ, the critical field strength Bcr varies by ≈0.1 mT. For large values of Wwall, the critical field reaches a plateau (see Fig. 6(a)) and it becomes independent of the wall anchoring Wwall.
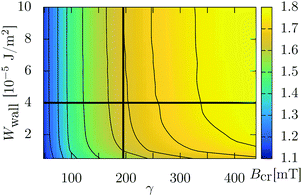 | ||
| Fig. 5 The dependence of the critical magnetic field strength Bcr on the coupling constant γ and on the anchoring strength Wwall at the walls. The color code denotes values of Bcr measured in units of mT. The thin black curves are contour lines; from left to right, Bcr = 1.2, 1.3, 1.4, 1.5, 1.6, 1.65, 1.7, 1.75 mT. The thick black lines correspond to γ ≈ 195 (see Fig. 6(a)) and Wwall = 4 × 10⁻⁵ J m−2 (see Fig. 6(b)). The values of the remaining parameters are the same as in Fig. 2. | ||
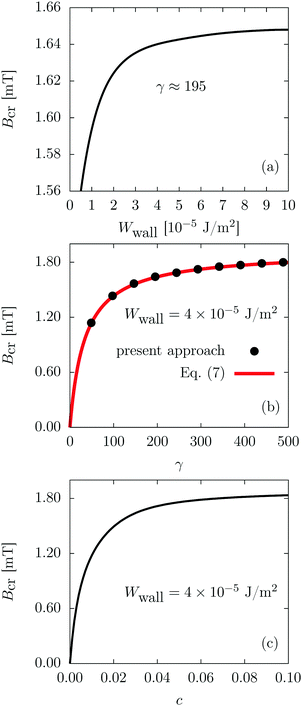 | ||
| Fig. 6 Dependence of the critical magnetic field strength Bcr on: (a) the wall anchoring strength Wwall (along the thick vertical black line in Fig. 5, i.e., for γ ≈ 195), (b) the coupling constant γ (present approach and eqn (7) along the thick horizontal black line in Fig. 5, i.e., for Wwall = 4 × 10⁻⁵ J m−2), and (c) the microscopic coupling constant c (see eqn (1), Wwall = 4 × 10⁻⁵ J m−2). The values of the remaining parameters are the same as in Fig. 2. | ||
Fig. 6 illustrates the trends of the critical magnetic field strength Bcr for fixed γ ≈ 195 (see Fig. 6(a) and vertical thick black line in Fig. 5) and for fixed Wwall = 4 × 10⁻⁵ J m−2 (see Fig. 6(b) and horizontal thick black line in Fig. 5). Moreover, Fig. 6(c) displays the dependence of Bcr on the microscopic coupling constant c (see below eqn (1)). Finally, Fig. 6(b) compares the values of the critical magnetic field Bcr as defined in the present approach (circles) with the corresponding expression given in ref. 10,
 | (7) |
B. Switching mechanism II
In Section III A we reveal a mechanism of switching the sample magnetization in the case of large values of the wall anchoring strength Wwall. Here we show another possible mechanism which corresponds, however, to small values of Wwall. For suitable combinations of γ and Wwall, the magnetization field is able to drag the nematic director field along, thereby inducing a large change in the angle φ compared with the initial configuration. For small values of Wwall, the anchoring at the wall is so weak that the nematic director field at the surface of the walls is able to deviate from the direction of the easy axis and rotate with the magnetic field due to the coupling between the magnetization and the nematic director.We have performed calculations analogous to those described in Section III A but for small values of the anchoring strength Wwall at the sample walls. It turns out that for Wwall < 0.5 × 10⁻⁵ J m−2 there are corresponding values of the coupling constant γ which produce a switching mechanism that is qualitatively different from the one described in the previous section. In this mechanism the early stages of the switching are similar to those described in the previous section (see Fig. 3(1) and (2)). However, the subsequent stage, as displayed in Fig. 7(3), is qualitatively different in the sense that the system does not separate into distinct spatial regions with different orientations of the magnetization (compare with Fig. 3(3)). Obviously, the change in the character of the switching mechanism is directly related to the anchoring at the walls being too weak to prevent the liquid crystal from rotating along with the magnetization field. This weakness is also revealed by the nonzero angles φ and θ at the walls.
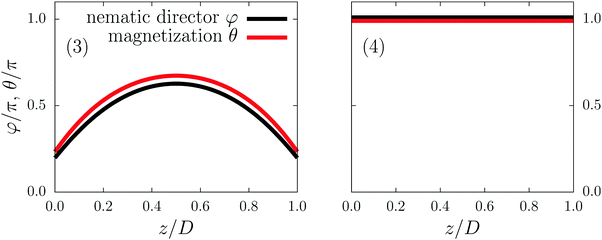 | ||
| Fig. 7 The final two stages of the switching mechanism II for the magnetization in an initially oppositely oriented external magnetic field for γ = 240 and Wwall = 0.1 × 10⁻⁵ J m−2 (the values of the remaining parameters are the same as in Fig. 2). It is characterized by a nematic director field with significant elastic distortions throughout the sample. Even at the surface, rotations of the nematic director with respect to the easy axis occur due to the weak anchoring at the walls (note φ ≠ 0 and θ ≠ 0 in the left panel). For sufficiently strong magnetic fields, both the magnetization field and the nematic director rotate by an angle π (see right panel). The panels are denoted by “(3)” and “(4)” in order to make the comparison easier with the corresponding panels in Fig. 3 describing switching mechanism I. Note that θ ≠ φ even directly at the walls. | ||
At such low anchoring strengths, the torque imposed on the liquid crystal director by the walls cannot compete with the drag imposed by the rotating magnetization field and it is energetically more favorable for the nematic director at the walls to flip its orientation. The regions of dominance for the two switching mechanisms are depicted in Fig. 8, where a map spanned by the coordinates (γ, Wwall = W(1)wall = W(2)wall) marks region “I” (corresponding to switching mechanism I, for which the nematic director field returns back to its initial configuration upon increasing the external magnetic field, reaching the saturation of the magnetization in the direction of the field) and region “II” (corresponding to switching mechanism II, for which the nematic director field follows the magnetization). Within our numerical approach, switching mechanism II is observed only for values of the wall anchoring Wwall which are significantly smaller than the one estimated from the experiment,11i.e., Wexpwall ≈ (3.40 ± 0.11) × 10−5 J m−2. Therefore, we expect switching mechanism I to be the one that is realized experimentally.
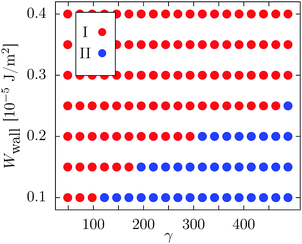 | ||
| Fig. 8 Regions of dominance for the two switching mechanisms between two ferromagnetic phases in terms of the coupling constant γ and the wall anchoring strength Wwall, which is the same for both walls. (The values of the remaining parameters are the same as in Fig. 2.) The region denoted as “I” (full red circles) corresponds to switching mechanism I in which the magnetization leaves the nematic director field behind (see Section III A). The region denoted as “II” (full blue circles) corresponds to switching mechanism II in which the nematic director field is weakly coupled to the sample walls and therefore is able to follow the magnetization direction. | ||
The segregation of colloids might play an important role. Segregation amounts to a redistribution of the colloids dispersed in the liquid crystal. This effect is caused by the opportunity to lower the free energy of the magnetic colloids in an external magnetic field by the colloids migrating away from regions in which the liquid crystal prevents their alignment along the external field. Thereby energy is gained by accomplishing alignment at the expense of the entropic contribution due to the denser packing which is proportional to ρ![[thin space (1/6-em)]](https://www.rsc.org/images/entities/char_2009.gif) log
log![[thin space (1/6-em)]](https://www.rsc.org/images/entities/char_2009.gif) ρ, where ρ is the local number density of the colloids (see ref. 15). Segregation is neglected in Section III; nonetheless, we do not expect segregation to influence our results qualitatively (see Section IV). On the other hand, quantitative changes are conceivable, i.e., the map in Fig. 8 might be affected.
ρ, where ρ is the local number density of the colloids (see ref. 15). Segregation is neglected in Section III; nonetheless, we do not expect segregation to influence our results qualitatively (see Section IV). On the other hand, quantitative changes are conceivable, i.e., the map in Fig. 8 might be affected.
C. Confining walls with different anchoring strengths
In this section we study a combination of switching mechanisms I and II described in Sections III A and III B, respectively, by considering a strong anchoring strength at one wall and a weak one at the other, sharing the same easy axis. Thus the system is described by three parameters (assuming a, T, K, D, m, and ρiso to be fixed): (i) coupling constant γ, (ii) the anchoring strength at one of the walls, and (iii) the ratio of the anchoring strengths at the two walls. Note that introducing different but uniform and parallel anchorings at the walls still renders the system effectively one-dimensional along the z-direction and hence from a numerical point of view, its complexity does not change.Adding a third parameter (i.e., the ratio of the anchoring strengths at the two walls ω := W(1)wall/W(2)wall) introduces a third dimension to the map considered in Fig. 8. The cut of this three-dimensional map along ω = 1 produces the two-dimensional map shown in Fig. 8. While the two-dimensional map in Fig. 8 exhibits only two switching regions (I and II), in the three-dimensional parameter space, the situation can be more involved. It is reasonable to expect that if both W(1)wall and W(2)wall become infinitely strong, the magnetization of the sample switches according to mechanism I. If, on the other hand, W(1)wall, W(2)wall → 0, one can expect that the magnetization of the sample switches according to mechanism II. However, pairs (W(1)wall, W(2)wall) can exist such that the magnetization in the vicinity of one wall would switch according to mechanism I and the magnetization in the vicinity of the other wall would switch according to mechanism II. Thus, the three-dimensional parameter space consists of three regions: dominance of mechanisms I and II, and their combination.
The line separating the two regions in Fig. 8 becomes a two-dimensional manifold in the three-dimensional parameter space (W(1)wall,ω,γ). In the vicinity of the plane ω = 1, this manifold, which separates regions “I” and “II”, is considered to be perpendicular to the plane ω = 1 and only the two regions “I” and “II” are seen. Therefore, if one would like to find a point (W(1)wall,ω,γ) that belongs to the region, which corresponds to the combination of the two switching mechanisms, it is necessary to pick a value of ω significantly different from 1. To this end, for fixed γ, it seems to be natural to take as an estimate the anchoring at one of the walls from region “I” in Fig. 8 and the anchoring at the other wall from region “II” in Fig. 8. It turned out that for D = 20 μm (for a discussion concerning larger values of D, see Section IV), the combination W(1)wall = 10−5 J m−2 and W(2)wall = 0.1 × 10⁻⁵ J m−2 (i.e., ω = 10) yields profiles φ(z) (nematic director) and θ(z) (magnetization) which consist of one part due to switching mechanism I and another part due to switching mechanism II. Fig. 9 shows the actual profiles (i.e., for magnetic field strengths B ≤ −12 mT and for the initial magnetization pointing into the positive x-direction) of the magnetization and of the nematic director field for γ = 240, W(1)wall = 10−5 J m−2, and W(2)wall = 0.1 × 10⁻⁵ J m−2, where superscript (1) denotes the wall at z = 0 and superscript (2) denotes the wall at z = D. Both the orientation field φ(z) of the nematic director and the orientational field θ(z) of the magnetization have a non-trivial form. The nematic director field profile exhibits a smooth rotation by an angle of π from one wall to the other. As shown in Fig. 9, the wall with strong anchoring at z/D = 0 is able to align the nematic director along the easy axis there (φ = 0), while the magnetization field switches to the negative x-direction, parallel to the external field (compare Section III A). On the other side, the weak anchoring at z/D = 1 in Fig. 9 allows the nematic director there to follow the magnetization (θ = π implies φ = π; compare Section III B). This provides a situation in which φ = 0 at one wall and φ = π at the other. The elastic contribution in eqn (4) ensures that no singularities occur in the interior of the slab so that there is a smooth crossover between the two boundary values.
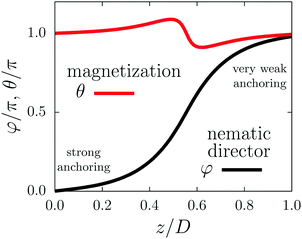 | ||
| Fig. 9 Orientation profiles φ(z) (nematic director, black line) and θ(z) (magnetization, red line) for B ≤ −12 mT (with the sample initially magnetized along the positive x-direction). There is a gradual variation of the nematic director from one wall to the other. The parameters are chosen as γ = 240, W(1)wall = 10−5 J m−2 (see z = 0), and W(2)wall = 0.1 × 10⁻⁵ J m−2 (see z = D), K = 9 × 10⁻¹² N;28 the values of the remaining parameters are the same as in Fig. 2. | ||
In the middle (z ≈ 0.55D) of the sample, the magnetization field exhibits an interface between two halves of the slab (see Fig. 10). The orientation of the magnetization within the two halves differs only in how the magnetization approaches the value θ = π in the vicinity of the center of the slab. This behavior of the magnetization field profile is caused by the necessity to be compatible with the nematic director profile in the center. This means that the rotation of the nematic director in the interior of the slab forces the magnetization direction to reach its value θ = π at z ≈ D/2 either from θ > π at z ≲ D/2 or from θ < π at z ≳ D/2 (see the red curve in Fig. 9). In the situation shown in Fig. 9, upon switching off the external magnetic field, we found that the system relaxes into a state with a uniform nematic director field and two domains with the magnetization pointing in opposite directions (see Fig. 11(c)).28 The position of the interface between these two domains depends on the position of the interface plane formed while the magnetic field was still on.29 Application of the external magnetic field to the two-domain configuration opens up two possibilities: (i) if the external magnetic field is applied in the same direction as the field used to create the two-domain sample, the resulting state is identical to the one in Fig. 9 and (ii) if, on the other hand, the magnetic field is applied opposite to the direction of the magnetic field used to create the two-domain sample, one of the domains (i.e., the one whose magnetization is opposite to the external field) switches. This yields a uniform sample both in terms of the nematic director and the magnetization field, thus allowing the system to return to its initial state. These steps are summarized in Fig. 11. Note that the states shown in Fig. 11(a) and (d) are identical. Also note that the state depicted in Fig. 11(a) exhibits saturated magnetization  (eqn (6)) whereas the state depicted in Fig. 11(c) exhibits
  . Since one can restore the initial state (see Fig. 11(a)) from the two-domain state (see Fig. 11(c)) by applying an external magnetic field B > 0, one is able to cycle through the three states (see Fig. 11(a)–(c)). Accordingly, this ferronematic cell with two walls of different anchoring strengths can be put in either of the two states (i.e., magnetized or demagnetized) by using an external magnetic field of suitable direction. This opens up the possibility, e.g., to use an array of such cells for storage of binary information, with a “bit” being represented by the state of the cell (magnetized/demagnetized), or as a spatially resolving magnetic field detector with memory function.
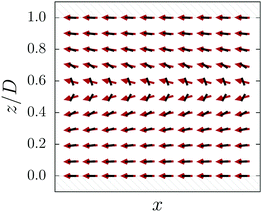 | ||
| Fig. 10 Vector fields corresponding to Fig. 9. The notation is the same as in Fig. 4. Note the distortion of the nematic director field (black rods) in the interior and the interface between two magnetization (red arrows) domains at z ≈ 0.55D due to the combination of the switching mechanisms I and II. Basically, throughout the whole sample, the magnetization has reached the switched state in the negative x-direction. γ = 240, W(1)wall = 10−5 J m−2 (see z = 0), and W(2)wall = 0.1 × 10⁻⁵ J m−2 (see z = D), K = 9 × 10⁻¹² N28 (the values of the remaining parameters are the same as in Fig. 2). | ||
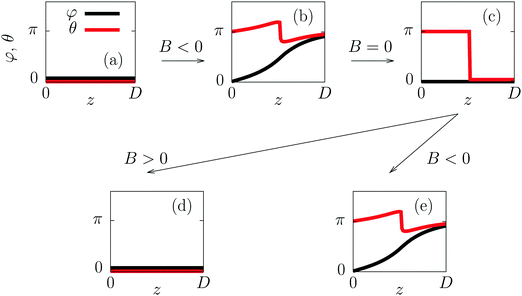 | ||
Fig. 11 Orientational profiles φ(z) (nematic director, black line) and θ(z) (magnetization, red line) in a ferronematic cell with walls of different anchoring strengths, as discussed in Section III C. The initial state (a) is a uniformly magnetized ferronematic slab, i.e., the nematic director field (φ = 0, black line) and the magnetization field (θ = 0, red line) are uniform. Application of an external magnetic field B = Bex in the direction opposite to the initial magnetization direction (i.e., B < 0) transfers the sample into the disturbed state (b) (compare Fig. 9). After suddenly switching off the external field (i.e., for B = 0), the system relaxes into the state (c) in which the nematic director is uniform; that part of the sample which is close to the wall with strong anchoring retains its magnetization direction θ ≈ π whereas the magnetization near the wall with weak anchoring follows the relaxation of the nematic director and reaches θ = 0. Thus having two halves of the sample being magnetized in opposite directions yields zero overall sample magnetization, i.e.,  . This configuration offers two options: (i) the application of an external magnetic field in the direction of the initial magnetization (i.e., B > 0) returns the sample to the initial, uniform state (d) = (a) with magnetization . This configuration offers two options: (i) the application of an external magnetic field in the direction of the initial magnetization (i.e., B > 0) returns the sample to the initial, uniform state (d) = (a) with magnetization  and (ii) the application of an external magnetic field in the direction opposite to the initial magnetization (i.e., B < 0) produces the disturbed state (e) = (b). The fact that the states (d) and (a) are identical allows one to cycle through the states (a), (b), and (c) by applying the external magnetic field B in suitable directions. The width of the interface between the two domains in (c) is not larger than the numerical grid discretization, i.e., less than D/100. The values of the parameters are the same as in Fig. 9. and (ii) the application of an external magnetic field in the direction opposite to the initial magnetization (i.e., B < 0) produces the disturbed state (e) = (b). The fact that the states (d) and (a) are identical allows one to cycle through the states (a), (b), and (c) by applying the external magnetic field B in suitable directions. The width of the interface between the two domains in (c) is not larger than the numerical grid discretization, i.e., less than D/100. The values of the parameters are the same as in Fig. 9. | ||
IV. Segregation effects
It was pointed out by Brochard and de Gennes26 that anisotropic magnetic colloids tend to move away from regions of the NLC where distortions of the nematic director field prevent them from minimizing their free energy in the external magnetic field. The segregation parameter defined as (see ref. 26)| s := βmB | (8) |
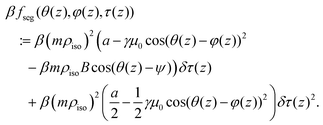
The present theoretical approach (see eqn (1) and (2)) includes the possibility of segregation occurring through the dependence of the magnetization field M on the spatial coordinate z. In particular, we are interested in the spatial inhomogeneities of the absolute value |M(z)| of the magnetization vector. It is convenient to introduce the dimensionless quantity τ(z) := |M(z)|/(mρiso). So far all our results have been obtained within the limit τ(z) = const = 1. If τ(z) ≠ 1, that part of the free energy density which depends on it (see eqn (1) and Fig. 1) is given by
 | (9) |
 | (10) |
| τ(z) = 1 + δτ(z), | (11) |
| βf(θ(z), φ(z), τ(z)) = βf(θ(z), φ(z), τ(z) = 1) + βfseg(θ(z), φ(z), τ(z)), | (12) |
 | (13) |
 | (14) |
 | (15) |
It turned out that for slab thicknesses D < 60 μm, the equilibrium profile τ(z) obtained from eqn (9) takes negative values, i.e., δτ(z) < −1, which contradicts its physical meaning τ(z) ∼ |M(z)| ≥ 0. This behavior is related to the absence of contributions in τ(z) beyond quadratic order. However, for slab thicknesses D ≥ 60 μm, the algorithm does provide the profiles θ(z) and φ(z), together with a physically reasonable segregation profile δτ(z). Fig. 12 shows the calculated profiles for D = 120 μm, equal walls with strong anchoring Wwall = 3.4 × 10⁻⁵ J m−2, coupling constant γ = 240, and external magnetic field B = 4 mT. It is evident that switching mechanism I is observed even in the presence of segregation effects. The density of magnetic colloids is largely reduced (with δτ(z) close to −1) in the regions of nonzero gradient of the nematic director profile. An important difference compared with the case of infinitely strong coupling of the colloids to the liquid crystal (see ref. 26) is the depletion layer being shifted away from the walls towards the interior of the sample. The functional form of the profiles φ(z) and θ(z) obtained for asymmetric pairs of walls with strong and weak anchoring (see Fig. 9 in Section III C) is found at both walls for sufficiently thick slabs. We have performed a series of calculations for different slab thicknesses D in order to determine the thickness at which the pure switching mechanism I turns into a combination of mechanisms I and II (see Fig. 12); we have found D = 95 ± 5 μm. This observation opens the possibility to manipulate the sample magnetization in a manner similar to that described in Section III C but without the need to use a second, weakly anchored wall. However, the state of nonzero net magnetization is not necessarily saturated, but it might exhibit  . Nonetheless, in order to have a state with the magnetization
  , one would need to adjust the system parameters (e.g., wall anchoring, elastic constant of the NLC etc.) such that each region of switched magnetization in the vicinity of the walls (see Fig. 12) takes up ≈25% of the slab thickness.
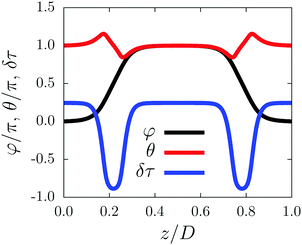 | ||
| Fig. 12 Results of the numerical minimization of the functional in eqn (2) with segregation effects included (see eqn (12) and (13)). The sample thickness is D = 120 μm, the wall anchoring is Wwall = 3.4 × 10⁻⁵ J m−2 for both the walls, the coupling constant is γ = 240, the external magnetic field is B = 4 mT, and a ≈ 3.1 × 10⁻⁴ N A−2. (The values of the remaining parameters are the same as in Fig. 2). Due to the large thickness D of the cell, switching mechanism I is now combined with switching mechanism II even in the case where both walls provide strong anchoring. The particles are expelled (see the blue solid line) from the regions with strong gradients of the nematic director field φ (black solid line). The depletion layers (i.e., the minima of the blue solid line) are separated from the walls due to the soft anchoring between the magnetization and the nematic director fields. This differs from the situation described in ref. 26 in which the depletion layer is located in close vicinity of the wall. | ||
We have also performed a calculation for the case of two walls with equally weak anchoring. We found that segregation did not have a qualitative impact in that case either. Therefore we expect that the results of Sections III A and III B are not affected qualitatively by segregation.
V. Summary and conclusions
In this analysis we have studied theoretically a ferronematic confined between two planar, parallel walls which imposes an easy axis on the NLC director field. Inspired by the experimental studies reported in ref. 10 and 11, the system is subjected to an external magnetic field. The ferronematic is an anisotropic polar fluid and thus the system is characterized by the relative directions of the NLC director, the easy axes due to the walls, the magnetization, and the external magnetic field. We have considered the situation in which the ferronematic is initially prepared with a uniform magnetization along the easy axis of the NLC. Subsequently an external magnetic field is applied in the direction opposite to the magnetization. This choice of the geometry reduces the theoretical description to an effectively one-dimensional one. The experiments reported in ref. 10 and 11 showed that for such a setup, there exists a critical external magnetic field Bcr > 0, such that for magnetic field strengths |B| < Bcr, the sample remains unperturbed. The authors of ref. 10 also provided the expression in eqn (7) for the critical magnetic field strength in terms of the coupling γ between the magnetization and the nematic director field. This critical magnetic field strength, which increases upon increasing γ, has been determined as that magnetic field strength for which the relaxation rate of long-wavelength fluctuations of the nematic director field vanishes.Here we study the system by numerical minimization of the corresponding free energy functional in eqn (2). The numerical minimization is performed by using the Fletcher–Reeves–Polak–Ribiere general function minimization algorithm. It is obvious that the global minimum of the free energy functional in eqn (2) before the external magnetic field has been applied is the initial state of the ferronematic being uniformly magnetized along the easy axis. Once the magnetic field is applied in the direction opposite to the initial magnetization, this state becomes only a local (metastable) minimum. The new global minimum is the ferronematic magnetized in the direction of the field. By means of a conjugate gradient algorithm, one is able to search for the local minimum of the free energy and therefore to identify metastable states of the system. This is particularly useful in the present context because this way one can investigate possible intermediate orientation profiles between the initial, now metastable, state with a uniform magnetization in the positive x-direction, i.e., opposite to the magnetic field B = Bex pointing in the negative x-direction, i.e., B < 0, and the final stable state with the magnetization in the direction along the magnetic field, i.e., in the negative x-direction (B < 0).
Fig. 2 shows the dependence of the dimensionless magnetization  (eqn (6)) of the metastable state described above on the strength of the external magnetic field for particular values of the coupling constant γ and of the anchoring strength Wwall at a wall. One observes hysteresis of the magnetization for which a critical magnetic field strength Bcr can be identified as the one for which significant deviations from the saturation magnetization
  occur. One can distinguish several, qualitatively different, intermediate states (red circles in Fig. 2). First, for a magnetic field B = Bex, with component B in the direction of the initial magnetization (B > 0), the sample remains practically unperturbed for B > Bcr (Bcr < 0), i.e., for the magnetic field either along the initial magnetization (B > 0) or sufficiently weak in the direction opposite to the initial magnetization (B < 0) (see Fig. 3(1)). Upon further decreasing the component B of the magnetic field B = Bex (i.e., making it less positive or more negative), the torque imposed on the NLC by the walls is no longer able to keep the ferronematic in the initial unperturbed state and thus the profiles become perturbed (see Fig. 3(2)). These states correspond to the brightening of the sample when viewed via crossed polarizers.10 If one decreases the magnetic field component B even further (i.e., making B even more negative), one encounters the interesting metastable state shown in Fig. 3(3). In this state, near each wall, a layer is formed within which the nematic director is close to the easy axis and the magnetization has inverted its direction, pointing along the external magnetic field (i.e., in negative x-direction). This flipping of the magnetization is energetically favorable for a sufficiently large strength |B| = |B| of the magnetic field pointing in the direction opposite to the initial magnetization (i.e., pointing into the negative x-direction) because the contribution to the free energy (eqn (1)) of the coupling between the magnetization and the nematic director is invariant upon inversion of the magnetization,
  , but the contribution of the coupling between the magnetization and the external magnetic field is not. When the external magnetic field becomes even stronger (i.e., B becomes even more negative and |B| even larger), the regions of flipped magnetization expand into the interior of the system, eventually resulting in the whole sample (except for thin layers in the very vicinity of the walls) being magnetized along the magnetic field. The qualitatively different scenario, which we refer to as switching mechanism II, occurs if the wall anchoring Wwall is too weak to prevent the nematic director field from following the rotating magnetization. In accordance to Fig. 3(3) and (4), in this scenario, the final stages of the switching are not realized. Fig. 7 illustrates how the final stages (3) and (4) of switching mechanism II are realized, according to which the magnetization and the nematic director field rotate in parallel.
Fig. 8 shows whether certain combinations of wall anchoring strengths W(1)wall = W(2)wall = Wwall as well as of the coupling constant γ lead to switching mechanism I or II. According to the map in Fig. 8, switching mechanism I is the dominant one in the experiments described in ref. 10 and 11 (Wexpwall ≈ 3.4 × 10⁻⁵ J m−2). It has to be noted that actual wall surfaces are not ideal and therefore the anchoring strength may vary across the surface. Hence, it is possible that the anchoring can be weak (or strong) in the vicinity of isolated imperfections while far away from them, the anchoring is strong (or weak). Moreover, one can consider the situation where two neighboring regions of the wall surface, one which exhibits strong anchoring and the other which exhibits weak anchoring, can cause the nucleation of surface defects of the liquid crystal if an external magnetic field is applied. Indeed, upon switching on an external magnetic field, the nematic director close to regions with strong anchoring does not switch its direction whereas the nematic director close to regions with weak anchoring rotates in order to follow the direction of the magnetization. Thus, a mismatch of the nematic director orientation will occur at the boundary separating the two regions of the wall surface. Such a surface defect was observed in the experiment (see ref. 10) which might indicate the role of imperfections of the wall (such as inhomogeneities of the coating, the use of spacers, etc.). The numerical method used here can, in principle, be utililized to investigate such a situation. However, this would require the consideration of a fully three-dimensional setup, thereby significantly increasing the numerical complexity.
The dependences of the critical magnetic field strength Bcr on the coupling constant γ and on the (equal) wall anchoring strength Wwall are presented in Fig. 5 and 6. On the one hand, Bcr increases as a function of Wwall and, on the other hand, it also increases as a function of γ, which is consistent with the results of ref. 10. In Fig. 6(b) a comparison of the critical magnetic field strength Bcr as defined here with that introduced in ref. 10 (see eqn (7)) shows good agreement, although the two expressions involve different properties of the ferronematic.
Within a recently developed theory of ferronematics15 one can relate the coupling coefficient γ to the microscopic coupling c (see below eqn (1)) which depends on the size of the colloids in the suspension. Fig. 6(c) shows the dependence of Bcr on the microscopic coupling c for a particular value of the wall anchoring strength Wwall. This allows one to vary the critical magnetic field by tuning the mean value of the size distribution of the colloids participating in the ferronematic.
Combining two walls with different anchoring strengths allows one to design a sample such that its switching mechanism is a superposition of type I and type II. The resulting nematic director and magnetization field profiles (see Fig. 9 and 10) are obtained by applying an external magnetic field. In turn, switching off this field divides the sample into two domains with opposite magnetizations (see Fig. 11(c)), rendering a sample with zero net magnetization. The initial state (i.e., the magnetized slab) can be restored by applying an external magnetic field of suitable direction to the two-domain sample. This cycle can be repeated arbitrarily, thus facilitating the switching between two states (magnetized/demagnetized slab) by using only a uniform magnetic field. This opens application perspectives such as storage of information and magnetic field detection.
Similar controllable magnetic slabs can be constructed by using two walls with equally strong anchoring for samples of larger thickness (D ≥ 95 μm for γ = 240, K = 3.5 × 10⁻¹² N, and Wwall = 3.4 × 10⁻⁵ J m−2). We have found segregation to be quantitatively different from the case of walls with infinitely strong anchoring and of infinitely strong coupling of the colloids to the NLC (see ref. 26). However, segregation effects do not affect the switching mechanisms qualitatively.
Conflicts of interest
There are no conflicts to declare.Appendix A: constraint of the field τ(z)
In this Appendix we derive eqn (10).The spatially varying magnetization field M(z) was defined in ref. 15 as
 | (A1) |
| ρ(z,ω) = g(z)δ(ω − ω0(z)), | (A2) |
 | (A3) |
| |M(z)| = mg(z) | (A4) |
 | (A5) |
 | (A6) |
Acknowledgements
Open Access funding provided by the Max Planck Society.References
- V. I. Zadorozhnii, A. N. Vasilev, V. Yu. Reshetnyak, K. S. Thomas and T. J. Sluckin, EPL, 2006, 73, 408 CrossRef CAS.
- V. I. Zadorozhnii, V. Yu. Reshetnyak, A. V. Kleshchonok, T. J. Sluckin and K. S. Thomas, Mol. Cryst. Liq. Cryst., 2007, 475, 221 CrossRef CAS.
- H. R. Brand and H. Pleiner, Eur. Phys. J. E: Soft Matter Biol. Phys., 2014, 37, 122 CrossRef PubMed.
- A. N. Zakhlevnykh and D. A. Petrov, J. Mol. Liq., 2014, 198, 223 CrossRef CAS.
- A. N. Zakhlevnykh and D. A. Petrov, J. Magn. Magn. Mater., 2015, 393, 517 CrossRef CAS.
- A. N. Boychuk, D. V. Makarov and A. N. Zaklevnykh, Eur. Phys. J. E: Soft Matter Biol. Phys., 2016, 39, 101 CrossRef PubMed.
- A. N. Zakhlevnykh and D. A. Petrov, Phys. Solid State, 2016, 58, 1906 CrossRef CAS.
- A. N. Zakhlevnykh, M. S. Lubnin and D. A. Petrov, J. Magn. Magn. Mater., 2017, 431, 62 CrossRef CAS.
- N. Podoliak, O. Buchnev, O. Buluy, G. D'Alessandro, M. Kaczmarek, Y. Reznikov and T. J. Sluckin, Soft Matter, 2011, 7, 4742 RSC.
- A. Mertelj, D. Lisjak, M. Drofenik and M. Copic, Nature, 2013, 504, 237 CrossRef CAS PubMed.
- A. Mertelj, N. Osterman, D. Lisjak and M. Copic, Soft Matter, 2014, 10, 9065 RSC.
- A. J. Hess, Q. Liu and I. Smalyukh, Appl. Phys. Lett., 2015, 107, 071906 CrossRef.
- A. Mertelj and D. Lisjak, Liq. Cryst. Rev., 2017, 5, 1 CrossRef CAS.
- D. Manaila Maximean, J. Magn. Magn. Mater., 2018, 452, 343 CrossRef CAS.
- G. Zarubin, M. Bier and S. Dietrich, J. Chem. Phys., 2018, 149, 054505 CrossRef PubMed.
- T. Potisk, D. Svensek, H. R. Brand, H. Pleiner, D. Lisjak, N. Osterman and A. Mertelj, Phys. Rev. Lett., 2017, 119, 097802 CrossRef PubMed.
- T. Potisk, A. Mertelj, N. Sebastian, N. Osterman, D. Lisjak, H. R. Brand, H. Pleiner and D. Svensek, Phys. Rev. E, 2018, 97, 012701 CrossRef PubMed.
- N. Sebastian, N. Osterman, D. Lisjak, M. Copic and A. Mertelj, Soft Matter, 2018, 14, 7180 RSC.
- Segregation effects can be neglected if the segregation parameter κ := D/l is much larger than unity,4 where
 is the segregation length;26 for K, see eqn (4). In the present study one has κ ≈ 7.
 - The NLC in the experiment analyzed in ref. 10 exhibits twist deformations in the x–y-plane because the twist elastic constant is the smallest Frank modulus of that system. Here we consider the one-elastic-constant approximation so that the system can undergo another type of deformation (i.e., bending) instead. Except for exchanging “twist” by “bend” deformations, the results are equivalent because the underlying mathematical model is identical.
- W. H. Press, S. A. Teukolski, W. T. Vetterling and B. P. Flannery, Numerical recipes in C++, Cambridge University Press, 2002 Search PubMed.
- The results of our study are valid only if the collective response mode26 of the ferronematic is realized. The minimum number density of magnetic colloids which facilitates collective behavior is (see ref. 23)
which gives ≈1018 m−3 for c = 0.03 (i.e., roughly the microscopic coupling constant in the experiment10,11), D = 20 μm, and R = 100 nm. Due to ρiso = 1.5 × 10¹⁹ m−3 > ρcoll and because D = 20 μm is the minimum thickness used here, the assumption of occurrence of collective behavior is valid. - S. V. Burylov and Y. L. Raikher, Mol. Cryst. Liq. Cryst., 1995, 258, 107 CrossRef CAS.
- The positive constant a in eqn (1) is unimportant as long as |M| = mρiso = const. It becomes relevant otherwise, i.e., if segregation is taken into account (see Section IV).
- In the case of soft anchoring, the interaction of the NLC with the wall surface is described by the free energy potential
where W > 0 is the anchoring strength at the wall surface and ν(s) is the easy axis direction at the surface point s. In the case of a planar wall surface with constant easy axis, the above expression reduces to the form used in eqn (5). The soft anchoring at the surface of the colloids is taken into account implicitly within the derivation of the free energy density given in eqn (1)15.
 - F. Brochard and P. G. de Gennes, J. Phys., 1970, 31, 691 CrossRef CAS.
- According to the numerical investigation of the one-particle elastic potential carried out in ref. 15, one finds that as long as the weak anchoring regime (c < 0.1) is valid, the rotation of a single colloid is accompanied by the breaking of the surface anchoring at the surface of the colloid. For example, if the angle between the normal of the surface of the disc and the far-field director is π/2, the director at the surface is parallel to the surface while anchoring favors the perpendicular orientation. An alternative mechanism is represented by the formation of a defect in the NLC in the vicinity of the particle. The latter scenario corresponds to the case in which the nematic director is strongly anchored at the particle surface (i.e., c ≫ 1) and thus is not relevant in the context of the experiments considered in ref. 10 and 11.
- The two-domain state required us to tune the elastic constant K because for certain values of K, the minimization algorithm produced throughout the sample a perturbed director profile for B = 0 as a favorable state. In order to make the corresponding elastic distortions more costly, we increased the value of K to 9 × 10⁻¹² N compared to K = 3.5 × 10⁻¹² N used in Sections III A, III B, and IV.
- The position of the interface depends on the external field strength which should be chosen such that the interface is located approximately in the middle of the slab. We used the values B = 12 mT together with γ ≈ 240, W(1)wall = 1 × 10⁻⁵ J m−2, W(2)wall = 0.1 × 10⁻⁵ J m−2, and K = 9 × 10⁻¹² N.
| This journal is © The Royal Society of Chemistry 2018 |

