DOI:
10.1039/C8SM01541D
(Paper)
Soft Matter, 2018,
14, 9232-9242
Near wall dynamics of a spherical particle in crowded suspensions of colloidal rods – dynamic information from TIRM revisited
Received
29th July 2018
, Accepted 30th September 2018
First published on 12th November 2018
Abstract
We performed total internal reflection microscopy (TIRM) experiments to determine the depletion potentials between probe spheres and a flat glass wall which are induced by long and thin, rod-shaped colloids (fd-virus), and probe the spatially resolved dynamics of the probe spheres. The dynamic information from the same raw TIRM intensity time traces is extracted in three different ways: by determining the spatially averaged diffusion constant of the probe sphere normal to the wall, by measuring the position dependence of the diffusion coefficient, and by measuring the particle's local drift velocity. Up to a concentration of about 6 times the overlap concentration of the rod-like colloids, the spatially averaged diffusion coefficient and the amplitude of the depletion potential are in surprisingly good agreement with theoretical predictions in which mutual interactions between the rods are neglected, that is, where the concentration is less than the overlap concentration. On increasing the depletant content even further, however, both the static and the averaged dynamic quantities begin to deviate from such theoretical predictions. In particular we find large deviations from the prediction by Mao, Cates, and Lekkerkerker [J. Chem. Phys., 1997, 106, 3721] based on the third order virial expansion for the rod concentration. It is shown that there are significant inaccuracies in TIRM measurements of diffusion coefficients due to the limited time range in which the mean squared displacements vary linearly in time, whereas mean displacements give much more accurate information concerning the probe sphere dynamics.
1 Introduction
Whenever a particle suspension consists of more than one colloidal component, the static properties of the suspension cannot be described anymore on the basis of DLVO-type pair interaction potentials alone. Rather an additional entropic contribution has to be considered, which is usually referred to as the depletion interaction in the community of soft matter scientists and which is the driving force of many effects which are summarized under the term crowding1 in the field of biophysics. In their ground-breaking work, Asakura and Oosawa provided the classical theoretical description for depletion potentials between colloidal bodies induced by second components of various shapes,2,3 where they applied two fundamental assumptions. Firstly they treat the second component as an ideal gas, i.e. the depletant is described as phantom bodies, which do not have any mutual interaction. Secondly they calculate the forces between two flat surfaces from which the interaction energy between curved surfaces is derived by using Derjaguin's approximation, which requires that the curvature radius is large as compared to the separation distance and the depletant size. Despite a plethora of experimental and theoretical publications on the depletion interaction (for an overview the interested reader is referred to the book by Tuinier ad Lekkerkerker4 and the references cited therein), there have been only relatively few studies in which these basic assumptions were challenged or violated.5–16
Total internal reflection microscopy (TIRM)17 has proven to be an ideal method for the measurement of depletion interactions between a probe sphere and a flat glass wall.6,7,18–24 In our previous contribution16 we used TIRM to show that depletion potentials induced by the rod-like fd-virus follow the classical Asakura–Oosawa (AO) predictions at depletant concentrations and size ratios at which this theory is expected to fail. Further, at high concentrations, we observed deviations from the ideal gas behavior, which are much more pronounced than theoretically predicted by Mao et al.8 In the present study we discuss experiments on the statics, providing additional experimental data, as well as the dynamics of probe spheres of various sizes relative to the depletant size, and extend earlier approaches to resolve the dynamics as a function of the starting position of the probe sphere.
On the other hand, this approach brings us back to the question of whether reliable information on the sphere dynamics can be extracted from TIRM data at all. In earlier contributions, measurements of the near wall diffusion coefficients were mainly reported as an independent method to determine the particle separation distance from the wall. This method is based on the fact that the particle mobility close to a wall becomes anisotropic and position dependent due to the hydrodynamic interaction with the wall.25,26 The feasibility of this approach has been debated,27–31 mainly because of the fact that the Brownian motion of the probe spheres is overlaid with a drift term which is caused by the forces on the probe particle due its direct interaction with the wall as well as gravity.
In this paper we are tackling this problem again, and we will show that measurements of the particle's local drift velocity are significantly more reliable than the measurement of the local diffusion constant. This suggests a new approach to the analysis of dynamic information, inherent to TIRM data.
2 Theoretical considerations
2.1 Determination of the interaction potential
The measurement of the position dependent interaction potential between a probe sphere of radius R and a flat glass surface, Φ(h), using TIRM, is based on the assumption that the intensity, IS(h), which is scattered by the sphere residing in an evanescent illumination field, is an exponentially decaying function of its surface-to-surface separation distance, h from the interface. As Prieve has demonstrated in his seminal contribution17 and as was reported frequently since, the interaction potential can be obtained from the histogram of scattered intensities as| |  | (1) |
where IS(h)m is the intensity occurring with the highest frequency N(IS(h)m).
Especially in the case of large penetration depths, reflections of the scattered light from the glass wall and the formation of standing waves will lead to significant deviations from the simple exponential relation of scattered intensity and separation distance. In these cases, which we may safely disregard in this contribution, much more demanding approaches are required.32–34
Since all quantities on the rhs of approximation 1 can be determined experimentally, the profile of potential differences can be readily determined on a relative scale, where the minimum is located at ΔΦ(h) = 0 and Δh = 0. To obtain potential profiles on absolute scales of separation distances and interaction energy, an appropriate calibration scheme has to be applied, which was discussed in our earlier contribution16 for the systems under consideration.
2.2 Extracting dynamic information from TIRM-data
In a typical TIRM experiment the probe particle is restricted to quasi one-dimensional Brownian motion normal to the glass surface, by the application of a weak laser trap, inhibiting particle diffusion parallel to the wall almost completely. In this case the particle's dynamics can be described by a one dimensional version of the Smoluchowski equation of motion| |  | (2) |
Here z is the shortest distance of the particle center of mass to the wall, i.e. z = h + R with R the particle radius, P(z,z0|t) is the conditional probability density function (PDF) of finding the sphere at some elevation z at time t, given that it was located at elevation z0 at time zero, and Dn(z) is the particle's diffusion coefficient normal to the wall, which is position dependent due to the hydrodynamic interaction with the wall.35,36 For convenience of notation we will denote the PDF simply by P in the following.
Prieve and co-workers27,28 suggested to use the concept of the scattered intensity time auto-correlation function (ITACF), g(t), to extract dynamic information from TIRM data. Their general formulation of the ITACF is
| |  | (3) |
where
p(
z0) is the Boltzmann probability density corresponding to the potential at
z0. Exploiting the initial condition that the PDF is a delta-function at time zero,
P(
z,
z0|
t = 0) = δ(
z −
z0), the correlation function at
t = 0 is
| |  | (4) |
Further, in their second paper Bevan and Prieve
28 showed that the initial slope of the ITACF is
| |  | (5) |
Finally, the combination of
eqn (4) and (5) allows for relating the averaged diffusion coefficient normal to the interface to the ratio of its derivative over the correlation function at time zero
| |  | (6) |
Both the latter quantities can be extracted from experimental TIRM data. Note that
eqn (6) represents an expression for a diffusion constant which is averaged over the evanescent illumination profile.
In order to obtain spatially resolved information on the particle's dynamics, we will now discuss an approach to extract spatially resolved dynamic information from TIRM data, which is based on the measurement of the first two moments of the displacement distribution, i.e. the time dependence of the mean displacement (MD) of a particle starting from z0 at t = 0
| |  | (7) |
and the mean squared displacement (MSD)
| |  | (8) |
Since the only time dependent term in the definitions of the MD and MSD is P, their time derivatives, according to eqn (2), can be written as
| |  | (9) |
while
| |  | (10) |
The integral in
eqn (9) can be simplified by a twofold integration by parts leading to the following expression for the mean drift velocity
| |  | (11) |
where the boundary terms vanish because
P is zero at infinite distances, as the particle is subject to significant sedimentation, and in the limiting case of
z →
R the particle's mobility is zero for hydrodynamic non-slip boundary conditions. From
eqn (11) we can identify the local drift velocity as
| |  | (12) |
The first term, which is often referred to as spurious drift, is caused by the fact that the Brownian motion of the particle is position dependent due to hydrodynamic interaction with the wall. The second term is the drift velocity which is related to the external force by Stoke's law, which can be positive or negative, because the potential is a non-monotonic function of
z (see the sketch of the potential in
Fig. 1) with a single minimum. Therefore, d
Φ/d
z can change sign, while the diffusion coefficient is a monotonically increasing function of
z, as can be seen from the solid line in
Fig. 6.
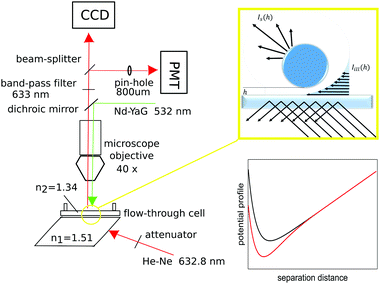 |
| | Fig. 1 Sketch of the home-built TIRM setup (left), illustration of evanescent illumination (top right) and typical potential profiles (bottom right), consisting of a superposition of electrostatic repulsion with a gravitational contribution (black) and additional depletion interaction (red). | |
Similarly we can evaluate the integral of eqn (10) to obtain
| |  | (13) |
This implies that the slope of an MSD
vs. time curve consists of two contributions, where one of the contributions results from a finite drift velocity. The MSD is solely related to the local diffusion coefficient only for very short times, for which
z ≈
z0, or for positions where the drift is vanishing,
i.e. where d
Dn(
z)/d
z =
βDn(
z)d
Φ(
z)/d
z.
In the following, we will discuss a method to determine spatially resolved drift velocities and diffusion coefficients based on their small displacement Taylor expansion. Introducing these expansions up to order (z − z0)2 into eqn (9) and (10) and solving the integrals leads to
| |  | (14) |
and
| |  | (15) |
Using the generic short time expansion of the MD and MSD
| | | m(t,z0) = a11t + a12t2 | (16) |
| | | W(t,z0) = a21t + a22t2, | (17) |
differentiating with respect to time and comparing coefficients with
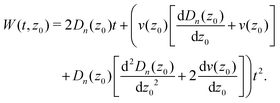
eqn (14) and (15) results in the short time evolution of the MD and the MSD
| |  | (18) |
and
| |  | (19) |
Thus, drift velocities and diffusion coefficients normal to the interface at given separation distances can be determined from the initial slopes of the MD and MSD
versus time curves, if sufficiently small times are accessible.
3 Experimental section
3.1 Instrumentation
Total internal reflection experiments were performed using an instrument which was home-built from Olympus microscopy components. The set-up is sketched in Fig. 1. The illumination source for the scattering experiment is a 15 mW HeNe p-polarized laser with λ0 = 632.8 nm. To allow for total internal reflection, a BK7-glass prism (Edmund Optics) is attached to a flow-through cell (Hellma QS137), of 540 μL volume, and optically matched to it via refractive index matching oil. The flow-through cell is connected to a sample reservoir with a valve via highly chemically resistive tubing (Saint Gobain Tygon 2075) for easy loading and exchanging of samples. Scattered light is collected with an infinity corrected 40× Olympus SLCPlanFI objective, with a focal length f = 6.5–8.3 mm and numerical aperture NA = 0.55. The objective additionally serves to couple in a 532 nm tweezers laser (Coherent Verdi V2 solid state Nd:Yag laser) from the back focal plane, which is used to inhibit the observed particle's lateral motion, keeping it in the field of view. The tweezers' nominal power setting was varied from Pn = 30 mW to 100 mW, where the initial beam was attenuated by approximately a factor of 20. The actual power at the sample position, Ps, can be roughly estimated from the calibration relation Ps = −0.19 + 4.8 × 10⁻²Pn, which was established by measuring the power at the sample position with a Coherent (Labmax) power meter.
In order to ensure that only p-polarized scattered light is collected, polarizers are mounted in front of both the detectors. A dichroic mirror is used to block the detectors from the green tweezers light while allowing the scattered red light to pass. The detectors are illuminated simultaneously by use of a 50/50 beam splitter. Additionally a 633 nm band-pass filter is placed in front of the beam splitter to further purify the transmitted signal from unwanted green light. To image the probe particles, a high EM-gain CCD camera (Photometrics Cascade 1 K by Roper Scientific) is used. To record intensity traces we apply a Hamamatsu H7421-40 photo-multiplier tube (PMT) operated in single photon-counting mode. The PMT's TTL output is recorded by a digital counter card (National Instruments NI-6602) and then processed by LabView acquisition software which had been written in-house. In front of the PMT the parallel light rays from the infinity corrected objective are focused by a tube lens onto a pin-hole of 1 mm. This spatial filter reduces the probability of collecting scattered intensity from surface corrugations and from other particles in the surroundings of the trapped one, thereby increasing the signal to noise ratio to about 103.
3.2 Samples
TIRM experiments were performed using charge stabilized polystyrene latex particles purchased from ThermoSCIENTIFIC as probe spheres. Three kinds of spheres with radii of R = 1,![[thin space (1/6-em)]](https://www.rsc.org/images/entities/char_2009.gif) 1.5
1.5![[thin space (1/6-em)]](https://www.rsc.org/images/entities/char_2009.gif) and
and![[thin space (1/6-em)]](https://www.rsc.org/images/entities/char_2009.gif) 2 μm and a width of the size distribution smaller than one percent were employed. These were suspended in solutions of wild type fd-virus covering a range of mass concentrations of 0 ≤ cfd ≤ 1 mg mL−1 corresponding to 0 ≤ cfd ≲ 14c* where c* is the virus overlap concentration which is defined as the concentration of rods where the volume fraction of fictitious spheres with a diameter equal to the length of the rods with the same number concentration as the rods is unity, that is 1 = ρπL3/6, with ρ the number of rods per unit volume.37 This is the concentration above which the rotational dynamics of the rods is affected by rod–rod interactions. From the molecular weight of the fd-virus particles (Mr = 1.64 × 10⁷ g mol−1) it is thus found that the overlap concentration c* = 0.07 mg mL−1.
2 μm and a width of the size distribution smaller than one percent were employed. These were suspended in solutions of wild type fd-virus covering a range of mass concentrations of 0 ≤ cfd ≤ 1 mg mL−1 corresponding to 0 ≤ cfd ≲ 14c* where c* is the virus overlap concentration which is defined as the concentration of rods where the volume fraction of fictitious spheres with a diameter equal to the length of the rods with the same number concentration as the rods is unity, that is 1 = ρπL3/6, with ρ the number of rods per unit volume.37 This is the concentration above which the rotational dynamics of the rods is affected by rod–rod interactions. From the molecular weight of the fd-virus particles (Mr = 1.64 × 10⁷ g mol−1) it is thus found that the overlap concentration c* = 0.07 mg mL−1.
To avoid bacterial growth all suspensions were prepared using a water/ethanol mixture which contained 15% of alcohol by volume resulting a solvent viscosity of η = 1.5 mPa s at 20 °C. To control the electrostatic repulsion between the probe spheres and the wall, the ionic strength was adjusted by applying 5 mmol L−1 of TRIS-buffer at pH = 8.2 in the case of the smallest probe sphere size. In the case of the two larger spheres, the buffer concentration was reduced to 2 mmol L−1 to avoid sphere sedimentation by enhancing electrostatic stabilization. The wild type fd-virus was grown in-house following standard procedures described elsewhere.38 Once harvested and cleaned, the viruses were transferred into the suitable TRIS-buffer/ethanol solution by exhaustive dialysis. This stock solution was diluted with the appropriate buffer to obtain all suspensions with the designated fd-concentrations used in the experiments. The fd-content of all solutions was determined by UV/vis spectroscopy.39
3.3 Data analysis
To quantify the interaction profiles, the histograms of the scattered intensities were converted to experimental profiles using eqn (1), which were fitted by the following model-function, taking into account electrostatic repulsion, a sum of the tweezers' photon pressure and the gravitational contribution, and depletion interaction| |  | (20) |
Here B is the amplitude of the electrostatic repulsion, κD−1 is the Debye screening length, ![[F with combining tilde]](https://www.rsc.org/images/entities/i_char_0046_0303.gif) is the sum of weight force Fg = mg and the light force due to the tweezers photon pressure with m the probe sphere mass and g the acceleration of gravity, and Adep = cfdNAπRL2/3Mfd is the amplitude of the depletion potential where cfd is the virus mass content per volume, NA Avogadro's number, R the probe sphere radius, L the virus length and Mfd its molar mass. As sketched in Fig. 1, the potential profile is a non-monotonic function of separation distance with a single minimum, the depth of which varies with cfd. At small separation distances, the electrostatic repulsion causes a negative gradient while at larger distances the attractive forces dominate the potential. The procedure which was applied to extract potentials on absolute scales of energy and distance is discussed in detail in our previous paper. We will not repeat this discussion here, since the focus of this contribution is the discussion of dynamic information while the static results will be stated only briefly.
is the sum of weight force Fg = mg and the light force due to the tweezers photon pressure with m the probe sphere mass and g the acceleration of gravity, and Adep = cfdNAπRL2/3Mfd is the amplitude of the depletion potential where cfd is the virus mass content per volume, NA Avogadro's number, R the probe sphere radius, L the virus length and Mfd its molar mass. As sketched in Fig. 1, the potential profile is a non-monotonic function of separation distance with a single minimum, the depth of which varies with cfd. At small separation distances, the electrostatic repulsion causes a negative gradient while at larger distances the attractive forces dominate the potential. The procedure which was applied to extract potentials on absolute scales of energy and distance is discussed in detail in our previous paper. We will not repeat this discussion here, since the focus of this contribution is the discussion of dynamic information while the static results will be stated only briefly.
Intensity traces were always recorded for 1000 seconds with a sampling time of 2 ms resulting in 5 × 10⁵ data points per trace. For the extraction of dynamic information, the time intensity traces have to be converted to the one-dimensional particle trajectories as a function of time, using the exponential relation between separation distance and scattered intensity. From these, the discrete conditional probability distributions, pi(hi(t), t|h0), can be easily constructed by identifying all occurrences of a selected h0-value and counting the frequencies ni(hi(t)) of a given value hi(t) after a given time t. These quantities can as well be expressed in terms of the particle center of mass position z, bearing in mind that z = h + R
| |  | (21) |
from which the mean displacement and the mean squared displacement are calculated as
| |  | (22) |
and
| |  | (23) |
for selected times and starting values. This will essentially allow the determination of the local drift velocity
v(
z0) and diffusion coefficient
Dn(
z0) directly from the scattered intensity traces applying linear fits of the initial slope of the MD and MSD
vs. time curves. It is not possible to determine
v(
z0) and
Dn(
z0) from scattered intensity correlation functions since there are no analytical expressions relating these quantities to the ITACF.
4 Results and discussion
4.1 Static interaction potentials
The static interaction potentials between a wall and probe spheres of different size dispersed in suspensions with increasing concentrations of the rod-shaped depletant fd-virus were measured by TIRM. To increase the reliability of the results all experiments were performed at ten different power settings of the tweezers laser, for each fd-concentration. Simultaneous non-linear least squares fitting by eqn (20) to the experimental data was used to determine the amplitude, Adep, of the depletion interaction as a function of depletant concentration. Since all parameters entering Adep are exactly known from the literature, an expected trend for this dependence can be calculated assuming the Derjaguin-approximation to be valid and neglecting the rod–rod interaction. In Fig. 2 we compare this prediction to the experimental data, where the results were averaged over all applied nominal laser tweezers powers. In the case of the two smaller probe spheres, the shown results are additionally averaged over two independent measurement series. Intriguingly, the experimental data follow the trend predicted by the Derjaguin approximation for ideal gas behavior of the rods in regions of virus concentration and size ratio where these approximations are expected to be violated. In the case of the two probe spheres with R = 1.5 μm and R = 2.0 μm, for which Derjaguin-approximation is valid,9,10,15 the theoretical model matches the experimental data up to rod concentrations of about 0.6 mg mL−1, which corresponds to roughly eight times the rod overlap concentration. This confirms qualitatively earlier findings by Lin et al.11 and Lau et al.,12 who investigated the particle particle pair potential by laser tweezers techniques. For the smallest probe sphere there is agreement within experimental scatter of the measured data with the approximate predictions throughout the whole range of rod concentrations which were investigated. Actually this is expected from the expansion by Mao et al.8 according to which the normalized amplitudes of the depletion potential are given by| |  | (24) |
where d ≈ 7 nm is the rods' hard core cross section diameter and K02 ≈ −0.05 ≈ −K03. Accordingly, the deviation between the ideal gas approximation and the expansion is of the order of a few percent, as shown by the dashed magenta line in Fig. 2. Adding twice the Debye screening length to the diameter, will change the result only within the thickness of the said line. At even higher concentrations we find a systematic deviation of the experimental data towards higher values of Adep/R than predicted for the sphere with R = 1.5 μm and for the largest probe sphere we observe a substantial mismatch in the same direction. A potential explanation for such deviations was given by Lin et al.,11 who observed that in some cases two particles could be bridged by adsorbing rods, which resulted in a harmonic potential with very large attractive forces at large separation distances. However, this should, as they argue, also lead to a repulsive contribution at short separations, which we do not observe. The deviation of the experimental results and the virial approximation is most probably due to the slow oscillatory-like convergence of the virial expansion: each higher order term in the expansion seems to partly compensate the preceding lower order term, so that many terms in the virial expansion need to be accounted for before an accurate approximation is achieved. For flexible polymers there is a fundamental difference between the mechanism leading to depletion forces below and far above the overlap concentration, due to the interpenetration of polymers chains leading to a loss of the integrity of single polymers (see ref. 4, and references therein). The only existing theory for depletion interactions for higher rod-depletant concentrations is the discussed virial expansion up to third order in concentration. For even higher concentrations, an in-depth discussion of depletion interactions that goes beyond this third order virial approach is as yet to be developed. To get some further insight into the physics of the investigated system we will now discuss experiments on the probe sphere dynamics, which can be extracted from TIRM data.
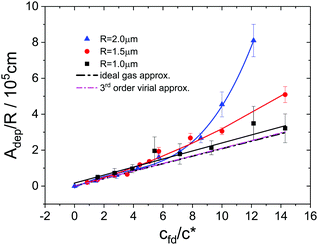 |
| | Fig. 2 Normalized amplitude of the depletion interaction as a function of depletant concentration. Full symbols are experimental data obtained with probe spheres of different size, as indicated in the legend and averaged over all laser tweezers powers. The full lines are guides to the eye and the error bars represent standard deviations of the experimental distribution with respect to laser powers. The black dashed-dotted line represents the expected trend according to eqn (20), assuming that the Derjaguin- and the ideal gas approximation are valid while the dashed magenta line represents the prediction by Mao et al.8 | |
4.2 Spatially averaged diffusion coefficients
As a first step we follow the approach of Bevan and Prieve to determine the averaged diffusion coefficient, 〈Dn〉TIRM, from the initial slope of the normalized ITACF. The time dependencies of correlation functions (as well as MDs and MSDs as will be discussed below) for short times are fitted with a linear function in time. Adding a quadratic contribution does not improve the quality of the fits for short times, and do not affect the values obtained for the initial slope. A representative set of correlation functions obtained with a probe sphere of R = 1.5 μm at a nominal tweezers laser power of 0.03 W and with increasing fd-concentrations is shown in Fig. 3.
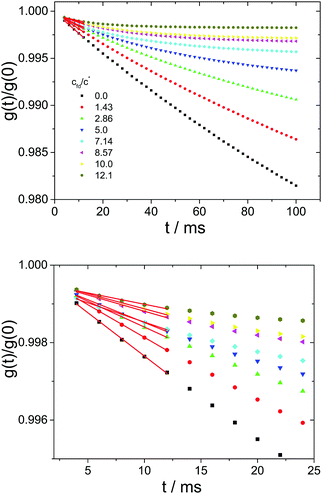 |
| | Fig. 3 Top: Example of normalized time auto-correlation functions of scattered intensities calculated from intensity traces measured with a probe sphere of R = 1.5 μm at a nominal tweezers laser power of 0.03 W and at increasing fd-concentrations as indicated in the legend. Bottom: Zoom into the short time regime. The red lines represent the linear fits at t → 0 which were used to determine 〈Dn〉TIRM. | |
The averaged diffusion coefficients are determined by multiplying the resulting slopes of the linear fits to the first five data points, with the squared penetration depth of the evanescent wave. Theoretical values for the averaged diffusion constant, 〈Dn〉theo, can be calculated by introducing Brenner's expression25,26 for the near wall diffusion Dn(z) = D0f(z) into eqn (6), where D0 is the particle's Stokes–Einstein bulk diffusion coefficient and
| |  | (25) |
is a position dependent near wall friction coefficient with
α = cosh
−1(
z/
R). In
Fig. 4 we show the ratios 〈
Dn〉
theo/〈
Dn〉
TIRM, which have been calculated for each applied tweezers' power and averaged subsequently. We choose this representation to highlight the qualitative similarity to the static data shown in
Fig. 2. Note that for the calculation of the theoretical diffusion coefficients, the viscosity of the solvent has been used instead of the total solution viscosity. This will be rationalized in Section 4.3, both on the basis of measurements of the spatially resolved velocities as well as the mesh size of the fd-virus network relative to the bead displacement during the short time interval from which the diffusion coefficients are obtained.
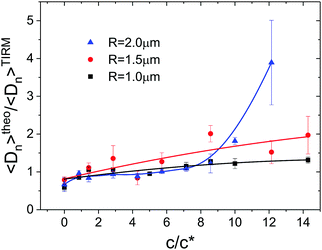 |
| | Fig. 4 Ratios of the numerical predictions over experimental data of the averaged diffusion coefficient normal to the wall. Symbols are ratios obtained with probe spheres of different size, as indicated in the legend and averaged over all laser tweezers powers. The full lines are guides to the eye and the error bars represent standard deviations of the distribution with respect to laser powers. | |
As for the static results, all experimental data agree quite well with the theoretical expectation up to an fd-concentration of about 0.4 mg mL−1, which for the smallest probe sphere applies throughout the entire concentration regime. For the case of the sphere with R = 1.5 μm the experimental data show a small but significant deviation from the prediction at cfd ≳ 0.5 mg mL−1, while in this concentration range the experimental data obtained with the largest probe sphere are up to a factor of four higher than expected. This mismatch is most probably due to the quite large inaccuracy in determining the diffusion coefficients, due to the very short time range over which the correlation function varies linearly in time (this will be discussed in quantitative detail in Section 4.3), although there seems to be a correlation with the observation from static data where, in the same range of probe sphere size and virus concentrations, the apparent amplitude of the depletion potential is much deeper than expected from the theoretical prediction. As the physics behind a potential correlation between static and spatially averaged dynamic properties are unknown to us, we refrain from a further discussion, and in the following we extracted spatially resolved dynamic information directly from scattered intensity traces. For this purpose, we analyzed the distributions of particle displacements depending on the starting separation distance, as will be discussed in the next section.
4.3 Spatially resolved dynamic information
Particle mean displacements and mean squared displacements were calculated as a function of time and starting position according to eqn (22) and (23). Some representative examples for the time dependence of MDs and MSDs are shown in Fig. 5. At low starting values (z0 = R + 10 nm, black curve in the top panel), the MDs are always positive and increase continuously with time, due to the repulsive interaction of the particle with the wall. Differently, at z0 = R + 100 nm (purple curve in the top panel) where the effective gravitational contribution dominates the static potential, the mean displacements are always negative and decrease monotonically with time. In both cases the MD curves level off only at times beyond about two seconds. In cases where z0 ≈ R + hm (light blue curve in the top panel), the absolute values of the mean displacements are very small, because the particle is almost force free at the starting position.
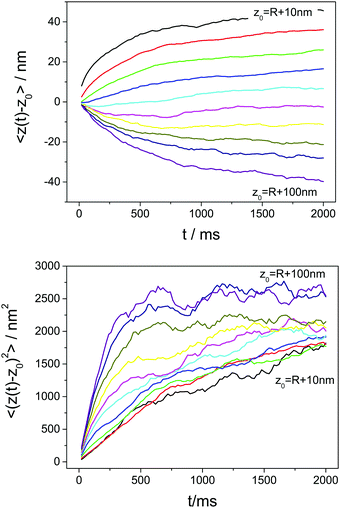 |
| | Fig. 5 Mean displacements (top) and mean squared displacements (bottom) as a function of time of a particle with R = 2 μm in a depletant free suspension. Curves were calculated for starting separation distances ranging from 10 to 100 nm in steps of 10 nm. | |
All MSD curves show an almost linear time dependence at small times and level off to a plateau value at large times (see Fig. 5, lower panel). The height of these plateaus represent the square of the maximum distances the particles may explore starting from a given z0 until the potential difference makes the probability of the displacement vanish. According to eqn (18) and (19), the initial slope of a MD vs. time curve is the particles drift velocity at the chosen position, v(z0) = v(h0 + R), while the short time slope of a MSD vs. time curve is twice the position dependent diffusion coefficient Dn(z0). In the following these quantities will be treated in detail.
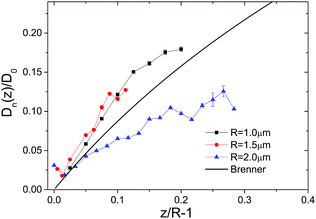 |
| | Fig. 6 Normalized particle diffusion coefficients as a function of normalized separation distance. Symbols are experimental data obtained at a nominal tweezers' power of 30 mW and with different probe particle sizes as indicated in the legend. Particles were suspended in depletant free solution. The full line is the theoretical prediction by Brenner and co-workers. | |
In Fig. 6 diffusion coefficients of particles in depletant free suspensions are displayed in terms of the ratio Dn(z)/D0versus the normalized separation distance h/R = z/R − 1. For convenience of notation, the subscript 0 is dropped from the position coordinate here and further on. The error bars assigned to the experimental data represent the confidence interval of the linear least squares fit to the initial part of the MSD vs. time curves. We used the solvent viscosity of η = 1.5 mPa s for the used water/ethanol mixture to calculate D0 from the particle radius using the Stokes–Einstein relation and from that Dn(z)/D0 as a function of z by applying eqn (25). The resulting data are represented by the full black curve in Fig. 6. It is obvious that the experimental data deviate considerably from Brenner's prediction, which does not improve when depletant rods are added to the system. Therefore we refrain from the discussion of the diffusion coefficients measured at finite fd-concentration, also because the zero-shear viscosity of fd-suspensions cannot be measured reliably.40 The discrepancy between the experimental data for the diffusion coefficient and Brenner's theory in Fig. 6 reveals the substantial inaccuracy with which diffusion coefficients can be determined from TIRM experiments. As will be seen later, spatially resolved velocities can be obtained much more accurately.
The drift velocities, obtained from the same sets of raw data, are plotted as a function of position in Fig. 7 and compared to the predictions based on Brenner's near wall friction coefficient through eqn (12). Again, the symbols are experimental data for all probe sphere sizes, which were determined by linear least squares fitting of the initial part of the MD versus time curves, while the lines represent the predictions for the corresponding probe particle size. The input parameters for these calculations are solvent viscosity, which was again set to η = 1.5 mPa s in all cases, and the potential derivative, which was determined from the static measurements, thus there are no adjustable parameters. The contribution from the first term in eqn (12) to the drift velocity is always positive and becomes zero at large distance. The second term gives a positive contribution for short distances, becomes zero at the position of the potential minimum, and attains a non-zero constant value at large distances due to the gravitational force on the beads (although such large distances are difficult to probe with TIRM for the large range of the depletion potential in the present system). Outside the potential minimum, both contributions can be equally important. Differently from the diffusion coefficients obtained from the same systems, shown before in Fig. 6, here we observe very good agreement between experimental data and predictions for the drift velocities.
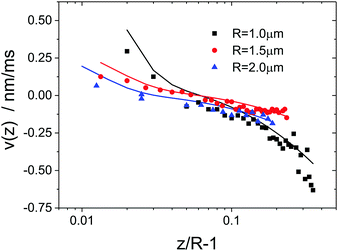 |
| | Fig. 7 Particle drift velocities as a function of normalized separation distance. Symbols are experimental data obtained at a nominal tweezers power of 30 mW and with different probe particle sizes as indicated in the legend. Particles were suspended in depletant free solution. The full lines are theoretical predictions calculated without adjustable parameters applying Brenner's expression for the near wall friction coefficient. | |
The observed quantitative agreement between experimental and predicted drift velocities suggests a way of measuring local viscosities in the sample solution. For this purpose we determined the drift velocities for all probe sphere sizes and all fd-concentrations and fitted the position dependence of the experimental data using a combination of eqn (12) and (25) as the model function with the viscosity as the only free parameter. For the data obtained from the largest spheres we could not get meaningful fits at the two highest fd-concentrations, because the number of data points was too small due to the very limited mobility of the probe sphere. For the other systems, the experimental data and the best fitting curves are shown in Fig. 8 and the best fitting viscosity values are shown in Fig. 9. Apart from two outliers related to the smallest probe sphere, the viscosities obtained for all probe spheres are close to the solvent viscosity of 1.5 mPa s with some experimental scatter. Actually the average of all fitted viscosity values is 1.41 mPa s. This finding may seem counterintuitive at first glance, since a significant increase of the viscosity with fd concentration should be expected. However, looking at the absolute velocity values shows that they have a maximum of about 0.5 nm ms−1. On the other hand, the times over which the MD vs. time curves are evaluated are 100 ms at most. Consequently we are observing drifts which are generally smaller than Δz < 50 nm. Since the mesh size of a rod network varies like c−0.5,37 and the mesh size ξ is of the order L at the overlap concentration c*, it follows that  . The mesh sizes in our fd-virus suspensions thus span the range from 200 to 880 nm, which is significantly larger than the typical drift distances. Therefore it appears reasonable that the sphere mainly probes the solvent viscosity on these time and length scales.
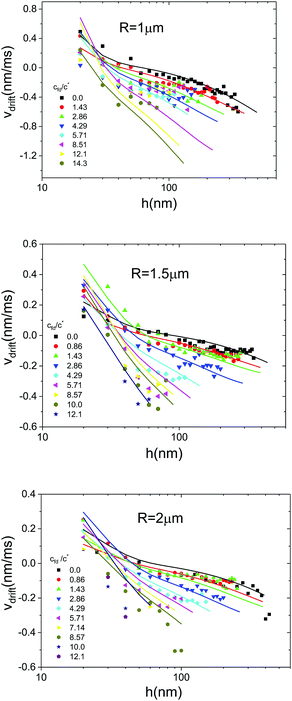 |
| | Fig. 8 Local drift velocities as a function of separation distance. Symbols are experimental data obtained at a nominal tweezers power of 0.03 W for spheres with R = 1 μm (top), R = 1.5 μm (middle) and R = 2 μm (bottom) in suspensions of various fd-concentrations as indicated in the legends. The full lines represent simultaneous non linear least squares fits using a combination of eqn (12) and (25) as the model function. Note that there are no fitting curves for the two highest fd-concentrations in the bottom panel. | |
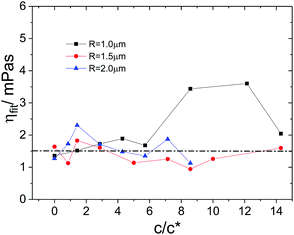 |
| | Fig. 9 Best fitting viscosity values as a function of depletant concentration. Symbols are data for different particle sizes as indicated in the legend, obtained at 0.03 W tweezers laser power. The data were determined by non-linear least squares fitting of the drift velocity vs. separation distance curves displayed in Fig. 8. | |
It is intriguing that the experimental data are much better described by the theoretical prediction in the case of the drift velocities than in the case of the diffusion coefficients. In the following we will give a qualitative argument which might explain this observation. For the determination of v(z) and Dn(z) we rely on an initial linear dependence of the particles' mean displacement and mean squared displacement on time. Therefore, the ratio of the second coefficient in the short time expansions of these quantities over the first coefficient, according to eqn (18) and (19), is a key parameter determining the reliability of the obtained results. For further discussion we term these ratios
| |  | (26) |
and
| |  | (27) |
It is important to note that the drift velocity will be very small or even zero close to the equilibrium separation distance,
i.e. z =
hm +
R and consequently, the ratio
Adrift will diverge for these separation distances. Therefore we will discuss the ratios
Adrift and
Adiff only for separation distances
z/
R > 1.1. A collection of representative ratios is displayed in
Fig. 10. They were calculated for a sphere with radius
R = 2 μm, interacting with the wall by a potential as typically observed in the static experiments,
i.e. an electrostatic repulsion with amplitude
B = 20
kBT and a Debye screening length of
κ−1 = 10 nm, a sum of light and weight force,
![[F with combining tilde]](https://www.rsc.org/images/entities/i_char_0046_0303.gif) G
G = 75 fN and a depletion potential of which the amplitude is determined by the fd-concentration as indicated in the figure legends. It is immediately evident that in all relevant cases the ratio |
Adrift| < 1, while
Adiff is more than an order of magnitude larger for comparable parameters. Note that both parameters
Adrift and
Adiff have the dimension of reciprocal time, which should be identified with the time range over which the linear fit is applied which is of the order of several milliseconds to several tens of milliseconds. This implies that for a given sphere size, the time range in which reliable diffusion coefficients can be determined is at least an order of magnitude smaller than the range in which drift velocities can be measured reliably. However no matter which time range is chosen, we will always observe that
Adrift ≪
Adiff showing that the linear fit will always be less reliable in the case of the MSD data as compared to the MD data.
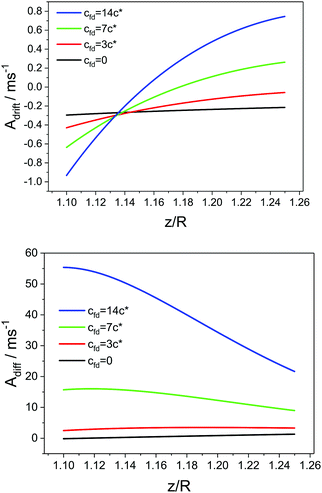 |
| | Fig. 10 Ratios between the second and first coefficient of the short time expansions of the time dependence of the mean displacement (top) and the mean squared displacement (bottom). Curves are calculated for a R = 2 μm sphere suspended in solutions with varying fd-concentrations as indicated in the legend. | |
5 Conclusions
In our earlier contribution16 we showed that depletion potentials induced by the rod-like fd-virus particles (long and stiff rod-like colloids) follow the classical Asakura–Oosawa theory up to 5 times the overlap concentration c*, at which the theory is expected to fail. Above a concentration of about 6c*, however, we observe deviations from the ideal gas behavior (see Fig. 2), which are much larger than predicted by a third order virial expansion in concentration.5,8 The dynamics of spheres in depletion potentials at such high fd-concentrations can be probed by Total Internal Reflection Microscopy (TIRM). Earlier, pioneering work in ref. 27 and 28 in which spatially averaged dynamics was probed, is extended to probe spatially resolved quantities. Mean squared displacements (MSDs) and mean displacements (MDs) are obtained from the one dimensional particle trajectories as a function of time for a range of initial positions of the probe sphere. It is shown that the time range over which the MSD varies strictly linearly with time is quite limited, leading to quite inaccurate values for the position dependent diffusion coefficients (see Fig. 6). The same holds for the spatially averaged diffusion coefficients determined from the initial slope of the correlation function as proposed by Prieve. Much more reliable data are obtained from the MDs, (see Fig. 7 and 8) because the term, second order in time, is much less significant at short times. From the spatially resolved MDs we deduce the local viscosity. Since the displacement of the probe spheres during the time range in which the MD varies linearly with time is much less than the mesh size of the fd-virus network, the viscosity of the pure solvent is probed. This would be different for other types of systems where the spatial extent of microstructural order in the depletant solution is larger than the size of the probe sphere, in which case the spatially varying bulk viscosity will be probed. Future numerical work is needed to calculate MDs over large time intervals, beyond the linear time regime, in order to probe the local bulk viscosity from the long-time behavior of the MDs for systems where the mesh size is larger than the typical sphere displacement within the linear time regime.
Conflicts of interest
There are no conflicts of interest to declare.
Acknowledgements
This work was financially supported by the European Commission through the FP7 research infrastructure project “European Soft Matter Infrastructure (ESMI)” (Grant Agreement No. 262348) and the FP7 Marie Sklodowska Curie Initial Training Network SOMATAI (Grant Agreement No. 316866), which is gratefully acknowledged. SD thanks Benoit Loppinet from FORTH and the ICS-3 group at FZ-Jülich for discussions and support.
References
- A. R. Hemsley and P. C. Griffiths, Philos. Trans. R. Soc., A, 2000, 358, 547 CrossRef CAS.
- S. Asakura and F. Oosawa, J. Chem. Phys., 1954, 22, 1255 CrossRef CAS.
- S. Asakura and F. Oosawa, J. Polym. Sci., 1958, 33, 183 CrossRef CAS.
-
Colloids and the Depletion Interaction, ed. R. Tuinier and H. N. W. Lekkerkerker, Springer, 2011, vol. 833 Search PubMed.
- L. Auvray, J. Phys., 1981, 42, 79–95 CrossRef CAS.
- A. Sharma and Y. J. Walz, J. Chem. Soc., Faraday Trans., 1996, 92, 4997 RSC.
- A. Sharma, S. N. Tan and Y. J. Walz, J. Colloid Interface Sci., 1997, 191, 236 CrossRef CAS PubMed.
- Y. Mao, M. Cates and H. Lekkerkerker, J. Chem. Phys., 1997, 106, 3721–3729 CrossRef CAS.
- K. Yaman, M. Jeng, P. Pincus, C. Jeppesen and C. M. Marques, Phys. A, 1997, 247, 159 CrossRef CAS.
- K. Yaman, C. Jeppesen and C. M. Marques, Europhys. Lett., 1998, 42, 221 CrossRef CAS.
- K.-h. Lin, J. C. Crocker, A. C. Zeri and A. G. Yodh, Phys. Rev. Lett., 2001, 87, 88301 CrossRef CAS PubMed.
- A. W. C. Lau, K.-h. Lin and A. G. Yodh, Phys. Rev. E: Stat., Nonlinear, Soft Matter Phys., 2002, 66, 020401(R) CrossRef PubMed.
- M. Oettel, Phys. Rev. E: Stat., Nonlinear, Soft Matter Phys., 2004, 69, 041404 CrossRef CAS PubMed.
- M. Oettel, H. Hansen-Goos, P. Bryk and R. Roth, Europhys. Lett., 2009, 85, 36003 CrossRef.
- P. R. Lang, J. Chem. Phys., 2007, 127, 124906 CrossRef PubMed.
- S. D. Sio and P. R. Lang, Z. Phys. Chem., 2015, 229, 1161–1175 Search PubMed.
- D. C. Prieve, Adv. Colloid Interface Sci., 1999, 82, 93–125 CrossRef CAS.
- D. Rudhardt, C. Bechinger and P. Leiderer, Phys. Rev. Lett., 1998, 81, 1330–1333 CrossRef CAS.
- C. Bechinger, D. Rudhardt, P. Leiderer, R. Roth and S. Dietrich, Phys. Rev. Lett., 1999, 83, 3960–3963 CrossRef CAS.
- L. Helden, R. Roth, G. H. Koenderink, P. Leiderer and C. Bechinger, Phys. Rev. Lett., 2003, 90, 048301 CrossRef CAS PubMed.
- L. Helden, G. H. Koenderink, P. Leiderer and C. Bechinger, Langmuir, 2004, 20, 5662–5665 CrossRef CAS PubMed.
- D. Kleshchanok, R. Tuinier and P. R. Lang, J. Phys.: Condens. Matter, 2008, 20, 073101 CrossRef.
- C. July and P. R. Lang, Langmuir, 2010, 26, 18647–18651 CrossRef CAS PubMed.
- C. July, D. Kleshchanok and P. R. Lang, Soft Matter, 2011, 7, 6444–6450 RSC.
- H. Brenner, Chem. Eng. Sci., 1961, 16, 242–251 CrossRef CAS.
- A. J. Goldman, R. G. Cox and H. Brenner, Chem. Eng. Sci., 1967, 22, 637–651 CrossRef CAS.
- N. A. Frej and D. C. Prieve, J. Chem. Phys., 1993, 98, 7552–7564 CrossRef CAS.
- M. A. Bevan and D. C. Prieve, J. Chem. Phys., 2000, 113, 1228–1236 CrossRef CAS.
- S. H. Behrens, J. Plewa and D. G. Grier, Eur. Phys. J. E: Soft Matter Biol. Phys., 2003, 10, 115–121 CrossRef CAS PubMed.
- R. J. Oetama and J. Y. Walz, J. Colloid
Interface Sci., 2005, 284, 323 CrossRef CAS PubMed.
- T. Brettschneider, G. Volpe, L. Helden, J. Wehr and C. Bechinger, Phys. Rev. E: Stat., Nonlinear, Soft Matter Phys., 2011, 83, 041113 CrossRef PubMed.
- L. Helden, E. Eremina, N. Riefler, C. Hertlein, C. Bechinger, Y. Eremin and T. Wriedt, Appl. Opt., 2006, 45, 7299–7308 CrossRef PubMed.
- N. Riefler, E. Eremina, C. Hertlein, L. Helden, Y. Eremin, T. Wriedt and C. Bechinger, J. Quant. Spectrosc. Radiat. Transfer, 2007, 106, 464–474 CrossRef CAS.
- C. Hertlein, N. Riefler, E. Eremina, T. Wriedt, Y. Eremin, L. Helden and C. Bechinger, Langmuir, 2008, 24, 1–4 CrossRef CAS PubMed.
-
J. Happel and H. Brenner, Low Reynolds Numbers Hydrodynamics, Kluwer, Dordrecht, 1991 Search PubMed.
-
M. Lisicki and G. Nägele, in Soft Matter at Aqueous Interfaces, Lecture notes of Physics 917, ed. P. R. Lang and Y. Liu, Springer, Dordrecht, The Netherlands, 2016, ch. Colloidal Hydrodynamics and Interfacial Effects Search PubMed.
- P.-G. de Gennes, P. Pincus, R. M. Velasco and F. Brochard, J. Phys., 1976, 37, 1461–1473 CrossRef CAS.
- D. A. Marvin and B. Hohn, Bacteriol. Rev., 1969, 53, 172 Search PubMed.
- K. R. Purdy and S. Fraden, Phys. Rev. E: Stat., Nonlinear, Soft Matter Phys., 2004, 70, 061703 CrossRef PubMed.
- C. Lang, J. Kohlbrecher, L. Porcar and M. P. Lettinga, Polymers, 2016, 8, 291 CrossRef.
|
| This journal is © The Royal Society of Chemistry 2018 |
Click here to see how this site uses Cookies. View our privacy policy here.  Open Access Article
 and
Peter R.
Lang
 *
*


![[thin space (1/6-em)]](https://www.rsc.org/images/entities/char_2009.gif) 1.5
1.5![[thin space (1/6-em)]](https://www.rsc.org/images/entities/char_2009.gif) and
and![[thin space (1/6-em)]](https://www.rsc.org/images/entities/char_2009.gif) 2 μm and a width of the size distribution smaller than one percent were employed. These were suspended in solutions of wild type fd-virus covering a range of mass concentrations of 0 ≤ cfd ≤ 1 mg mL−1 corresponding to 0 ≤ cfd ≲ 14c* where c* is the virus overlap concentration which is defined as the concentration of rods where the volume fraction of fictitious spheres with a diameter equal to the length of the rods with the same number concentration as the rods is unity, that is 1 = ρπL3/6, with ρ the number of rods per unit volume.37 This is the concentration above which the rotational dynamics of the rods is affected by rod–rod interactions. From the molecular weight of the fd-virus particles (Mr = 1.64 × 10⁷ g mol−1) it is thus found that the overlap concentration c* = 0.07 mg mL−1.
2 μm and a width of the size distribution smaller than one percent were employed. These were suspended in solutions of wild type fd-virus covering a range of mass concentrations of 0 ≤ cfd ≤ 1 mg mL−1 corresponding to 0 ≤ cfd ≲ 14c* where c* is the virus overlap concentration which is defined as the concentration of rods where the volume fraction of fictitious spheres with a diameter equal to the length of the rods with the same number concentration as the rods is unity, that is 1 = ρπL3/6, with ρ the number of rods per unit volume.37 This is the concentration above which the rotational dynamics of the rods is affected by rod–rod interactions. From the molecular weight of the fd-virus particles (Mr = 1.64 × 10⁷ g mol−1) it is thus found that the overlap concentration c* = 0.07 mg mL−1.

![[F with combining tilde]](https://www.rsc.org/images/entities/i_char_0046_0303.gif) is the sum of weight force Fg = mg and the light force due to the tweezers photon pressure with m the probe sphere mass and g the acceleration of gravity, and Adep = cfdNAπRL2/3Mfd is the amplitude of the depletion potential where cfd is the virus mass content per volume, NA Avogadro's number, R the probe sphere radius, L the virus length and Mfd its molar mass. As sketched in Fig. 1, the potential profile is a non-monotonic function of separation distance with a single minimum, the depth of which varies with cfd. At small separation distances, the electrostatic repulsion causes a negative gradient while at larger distances the attractive forces dominate the potential. The procedure which was applied to extract potentials on absolute scales of energy and distance is discussed in detail in our previous paper. We will not repeat this discussion here, since the focus of this contribution is the discussion of dynamic information while the static results will be stated only briefly.
is the sum of weight force Fg = mg and the light force due to the tweezers photon pressure with m the probe sphere mass and g the acceleration of gravity, and Adep = cfdNAπRL2/3Mfd is the amplitude of the depletion potential where cfd is the virus mass content per volume, NA Avogadro's number, R the probe sphere radius, L the virus length and Mfd its molar mass. As sketched in Fig. 1, the potential profile is a non-monotonic function of separation distance with a single minimum, the depth of which varies with cfd. At small separation distances, the electrostatic repulsion causes a negative gradient while at larger distances the attractive forces dominate the potential. The procedure which was applied to extract potentials on absolute scales of energy and distance is discussed in detail in our previous paper. We will not repeat this discussion here, since the focus of this contribution is the discussion of dynamic information while the static results will be stated only briefly.


 . The mesh sizes in our fd-virus suspensions thus span the range from 200 to 880 nm, which is significantly larger than the typical drift distances. Therefore it appears reasonable that the sphere mainly probes the solvent viscosity on these time and length scales.


![[F with combining tilde]](https://www.rsc.org/images/entities/i_char_0046_0303.gif) G = 75 fN and a depletion potential of which the amplitude is determined by the fd-concentration as indicated in the figure legends. It is immediately evident that in all relevant cases the ratio |Adrift| < 1, while Adiff is more than an order of magnitude larger for comparable parameters. Note that both parameters Adrift and Adiff have the dimension of reciprocal time, which should be identified with the time range over which the linear fit is applied which is of the order of several milliseconds to several tens of milliseconds. This implies that for a given sphere size, the time range in which reliable diffusion coefficients can be determined is at least an order of magnitude smaller than the range in which drift velocities can be measured reliably. However no matter which time range is chosen, we will always observe that Adrift ≪ Adiff showing that the linear fit will always be less reliable in the case of the MSD data as compared to the MD data.
G = 75 fN and a depletion potential of which the amplitude is determined by the fd-concentration as indicated in the figure legends. It is immediately evident that in all relevant cases the ratio |Adrift| < 1, while Adiff is more than an order of magnitude larger for comparable parameters. Note that both parameters Adrift and Adiff have the dimension of reciprocal time, which should be identified with the time range over which the linear fit is applied which is of the order of several milliseconds to several tens of milliseconds. This implies that for a given sphere size, the time range in which reliable diffusion coefficients can be determined is at least an order of magnitude smaller than the range in which drift velocities can be measured reliably. However no matter which time range is chosen, we will always observe that Adrift ≪ Adiff showing that the linear fit will always be less reliable in the case of the MSD data as compared to the MD data.


