 Open Access Article
Creative Commons Attribution 3.0 Unported Licence
Co-assemblies of polydiacetylenes and metal ions for solvent sensing†
Si
Wu
 *ab,
Libin
Pan
a,
Youju
Huang
 b,
Ni
Yang
a and
Qijin
Zhang
*a
aHefei National Laboratory for Physical Sciences at the Microscale, CAS Key Laboratory of Soft Matter Chemistry, Anhui Key Laboratory of Optoelectronic Science and Technology, Innovation Centre of Chemistry for Energy Materials, Department of Polymer Science and Engineering, University of Science and Technology of China, Hefei, 230026, China. E-mail: siwu@ustc.edu.cn; zqjm@ustc.edu.cn
bMax Planck Institute for Polymer Research, Ackermannweg 10, 55128 Mainz, Germany. E-mail: wusi@mpip-mainz.mpg.de
First published on 27th July 2018
Abstract
We demonstrate an easy and low-cost approach for the colorimetric differentiation of organic solvents using co-assemblies of polydiacetylenes (PDAs) and metal ions. The co-assemblies were prepared by the self-assembly of amphiphilic 10,12-tricosa diynoic acid with different metal ions (Zn2+, Cu2+, Ni2+, Ca2+) and subsequent photopolymerization. Different metal ions underwent different interactions with the carboxyl groups on the side chains of poly(10,12-tricosa diynoic acid), which influenced the stimuli-responsiveness of the PDA/metal ion co-assemblies. As a result, the PDA/metal ion co-assemblies with different metal ions showed different solvatochromism. Based on this property, the co-assemblies were used as sensors to differentiate organic solvents.
Introduction
Conjugated polymer-based sensors are sensitive to very minor perturbations due to amplification by a collective system response and therefore offer a remarkable advantage over small molecule-based sensors.1–6 Polydiacetylenes (PDAs) are well-known conjugated polymers. PDAs show stimuli-responsive blue-to-red color changes because the conformation of the conjugated backbone changes, which results in a change of the efficient conjugated length of the polymer chain.4,7–14 Most PDAs appear with an intense blue color related to an absorption maximum at a wavelength λmax of around 640 nm. External stimuli such as temperature,7–13,15 pH,16,17 stress,18 ions,19 solvents,20 ligands,21 and biomaterials cause a color change to the red phase with λmax around 550 nm.22 The intriguing stimuli-responsive color change properties23–25 show potential for applications in sensing.A promising application of PDAs is solvent sensing. PDAs show solvatochromism when exposed to solvents.26 However, there has been nearly no development of PDA-based sensor systems for differentiation of organic solvents until recently. Lu et al. proposed that the solvatochromism of PDAs could be used for applications in solvent sensing.27,28 Recently, two real solvent sensor systems based on the solvatochromism of PDAs have been developed by Kim's group.20,29 In their first system, four organic solvents can be distinguished by four different PDAs. In their second system, nine organic solvents can be distinguished by the mixtures of two different PDAs.20 In our previous work, hydrogen bonding complexes containing three different PDAs were used to distinguish hexane from three other solvents.11 The solvent sensor systems mentioned above require the synthesis of diacetylenes with different substituents, and at least two different diacetylenes were needed for solvent sensing. It is a challenge to use only one commercially available diacetylene for differentiation of various organic solvents. If this kind of solvent sensor system is available, tedious synthesis work can be avoided and the cost of preparation of a solvent sensor system can be reduced.
The aim of this work is to demonstrate an easy and low-cost strategy to use only one commercially available diacetylene to construct a solvent sensor system that can be used to differentiate solvents. The key challenge in the fabrication of PDA-based solvent sensors is to construct a library of PDAs with different stimuli-responsive color changes, i.e. to obtain a series of PDAs with different sensitivities to solvents. Our concept of the construction of such a sensor system is based on co-assemblies of a PDA and different metal ions. We use 10,12-tricosa diynoic acid and different metal salts to prepare co-assemblies of PDA/metal ions. Different metal ions show different coordination interactions with carboxyl groups on the side chains of poly(10,12-tricosa diynoic acid), which directly cause different stimuli-responsive properties of these PDA/metal ion co-assemblies. We built a library for solvent sensing based on these PDA/metal ion co-assemblies. We demonstrate that six organic solvents can be distinguished using these co-assemblies.
Experimental section
Materials
10,12-Tricosa diynoic acid (TDA) was purchased from Alfa Aesar and used as received. Cu(NO3)2, Zn(NO3)2, Ni(NO3)2 and Ca(NO3)2 were all analytical reagents and used without further purification. Milli-Q water was used in all cases.Preparation of the PDA/metal ion assemblies
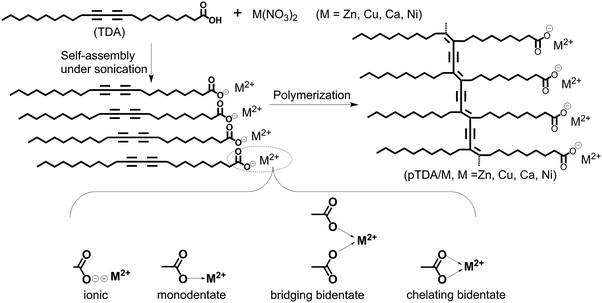
The process of preparation of the PDA/metal ion co-assemblies is shown in Fig. 1.An ethanol solution of TDA (6.0 × 10⁻² mol L−1, 1.0 mL), after 5 min ultrasonic wave treatment, was added to 300 mL of Milli-Q water. Then, the M(NO3)2 (M = Zn, Cu, Ca, Ni) aqueous solution (3.0 mL, 4.0 × 10⁻² mol L−1) was also added into the Milli-Q water above. The resulting mixture was treated using ultrasonic waves for 1 hour in an Elma S60H ultrasonic tank. A dispersion was obtained after ultrasonic treatment and the dispersion was cooled to room temperature naturally. The obtained dispersion was stored in a fridge at 4 °C overnight. Polymerization was carried out at room temperature by irradiating the dispersion using a UV-hand lamp at 254 nm. The pH of these assemblies was 4.7–5.6. The names of the co-assemblies are abbreviated as PTDA/M (M = Zn2+, Cu2+, Ca2+, Ni2+).
Measurements
UV-vis absorption spectra were measured on a SHIMADZU UV-2550 PC spectrophotometer. Solvatochromism of the PTDA assemblies was studied using UV-vis absorption spectroscopy and the details of the experiments are as follows. A small amount of a solvent was added to the PTDA assemblies and the UV-vis spectrum of the sample was measured; then, a bit more solvent was added to the PTDA assemblies and the UV-vis spectrum was measured again. This experiment was similar to titrimetric analysis. Titration was stopped when the absorption bands of the assemblies did not change. The colorimetric response (CR) of the assemblies was calculated according to the absorption spectra. CR is defined as CR = (B0 − Bf)/B0, in which B = Ablue/(Ablue + Ared), B0 and Bf are the pre- and post-exposure values, and Ablue and Ared are the blue phase and red phase absorptions. FTIR spectra were obtained using a Nicolet 8700 spectrometer. The sample for FTIR measurement was prepared by applying the dispersion onto a silicon wafer and leaving it to dry in air, and then the sample was transferred to an oven and dried under vacuum overnight. The morphologies and energy dispersive spectra (EDS) of the assemblies were observed on a JEOL-2010 transmission electron microscope (TEM). The samples for TEM measurements were prepared by applying a drop of the dispersion onto a Cu grid and leaving it to dry in air.Calculation of the solubility parameters
According to solubility theory, the total solubility parameter δt could be divided into three component Hansen parameters, δd, δp and δh, by considering the dispersion, polar and hydrogen bonding forces.30 The Hansen parameters of the water/organic solvent mixtures can be estimated from the following equation:| δaverage = ∑ϕiδi | (1) |
The Hansen parameters of the side chains of PTDA and the repeating unit of the backbone of PTDA can be calculated according to a group-contribution method (see ESI†).30
Hansen solubility parameters can also be used in the equivalent form of Teas parameters.30 With these parameters, each compound is represented by a single point in a ternary plot. The Teas parameters of the water/organic solvent mixtures can be estimated from the following equations:30
| fd = δd/(δd + δp + δh) | (2) |
| fp = δp/(δd + δp + δh) | (3) |
| fh = δh/(δd + δp + δh) | (4) |
Results and discussion
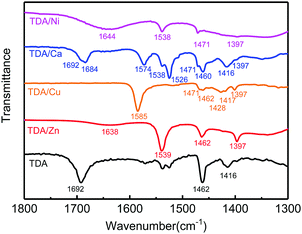
The process of preparation of the co-assemblies of PDAs with different metal ions and possible coordination interactions between the carboxylate anion and metal ions are illuminated in Fig. 1. The interactions between carboxyl groups and metal ions in the co-assemblies were studied using FTIR spectroscopy (Fig. 2). TDA assemblies without metal ions (black line) have a strong band at 1692 cm−1, which is attributed to the hydrogen-bonded carbonyl stretching band ν(C![[double bond, length as m-dash]](https://www.rsc.org/images/entities/char_e001.gif) O).31,32 For TDA/Ca (blue line), the stretching band at 1692 cm−1 still exists, indicating incomplete coordination between carboxylic acids and Ca2+. For TDA assemblies containing other metal ions, some new bands appear at 1600–1500 and 1500–1350 cm−1, which can be ascribed to the antisymmetric νas(COO−) and symmetric νs(COO−) stretching vibrations of the carboxylate anion, respectively.31,33 In the FTIR spectra of TDA/Ni and TDA/Zn, there are broad bands at 1644 and 1638 cm−1, respectively, which come from vibrations of water molecules in the two samples.34 As the drying processes of these two samples are the same as the other samples without such a peak, there should be no free water molecules in these two samples. The vibration peak probably comes from water molecules coordinated with Ni2+ and Zn2+, or hydrated carboxylate ions.33,35 For TDA/Cu, no stretching bands of hydrogen-bonded carbonyl can be detected, indicating the complete coordination between carboxylic acid with Cu2+.
O).31,32 For TDA/Ca (blue line), the stretching band at 1692 cm−1 still exists, indicating incomplete coordination between carboxylic acids and Ca2+. For TDA assemblies containing other metal ions, some new bands appear at 1600–1500 and 1500–1350 cm−1, which can be ascribed to the antisymmetric νas(COO−) and symmetric νs(COO−) stretching vibrations of the carboxylate anion, respectively.31,33 In the FTIR spectra of TDA/Ni and TDA/Zn, there are broad bands at 1644 and 1638 cm−1, respectively, which come from vibrations of water molecules in the two samples.34 As the drying processes of these two samples are the same as the other samples without such a peak, there should be no free water molecules in these two samples. The vibration peak probably comes from water molecules coordinated with Ni2+ and Zn2+, or hydrated carboxylate ions.33,35 For TDA/Cu, no stretching bands of hydrogen-bonded carbonyl can be detected, indicating the complete coordination between carboxylic acid with Cu2+.
The CH2 scissoring band δ(CH2) is at around 1471 cm−1, which reflects the packing structure of TDA.31,35 A broad peak centered between 1467 and 1469 cm−1 is indicative of hexagonal packing, a sharp peak at ca. 1471–1472 cm−1 is characteristic of a triclinic structure, and a doublet at 1465 and 1473 cm−1 is indicative of an orthorhombic structure. Because the CH2 scissoring band in our samples sometimes overlapped with other bands, it is impossible to discriminate among these structures.
It is well-known that the separation (Δ) between antisymmetric and symmetric stretching vibrations of carboxylate (Δ = νas(COO−) − νs(COO−)) can be used as a diagnosis to determine the coordination type (ionic, monodentate, bridging bidentate, chelating bidentate) between the carboxylate and metal ions.33,35 The relationship between the separation values and the coordination types can be generalized as follows: ionic (164 cm−1), monodentate (200–300 cm−1), bridging bidentate (140–170 cm−1), and chelating bidentate (40–110 cm−1).33,35 The calculation results and the interaction types of TDA assemblies are listed in Table 1. For TDA/Ni, carboxyl groups form chelating bidentate complexes with Ni2+. For TDA/Ca, the hydrogen-bonded carbonyl stretching band ν(C![[double bond, length as m-dash]](https://www.rsc.org/images/entities/char_e001.gif) O) splits into a peak at 1684 cm−1 and a shoulder at 1692 cm−1, and at the same time, some strong bands such as those at 1573 and 1526 cm−1 appeared, indicating that there are both hydrogen-bonded carboxyl groups and chelating bidentate complexes in TDA/Ca. In the cases of Cu2+ and Zn2+, both separation values are in the region of the bridging bidentate. However, the difference of the separation values is as large as 15 cm−1 for the two samples. Such a difference may be due to the different coordination geometries of Zn2+ and Cu2+.31,33 These FTIR results clearly indicate that TDA exhibits different coordination types with different metal ions in the co-assemblies.
O) splits into a peak at 1684 cm−1 and a shoulder at 1692 cm−1, and at the same time, some strong bands such as those at 1573 and 1526 cm−1 appeared, indicating that there are both hydrogen-bonded carboxyl groups and chelating bidentate complexes in TDA/Ca. In the cases of Cu2+ and Zn2+, both separation values are in the region of the bridging bidentate. However, the difference of the separation values is as large as 15 cm−1 for the two samples. Such a difference may be due to the different coordination geometries of Zn2+ and Cu2+.31,33 These FTIR results clearly indicate that TDA exhibits different coordination types with different metal ions in the co-assemblies.
| Sample | FTIR analysis | Interaction type |
|---|---|---|
| a The interaction types are assigned according to ref. 31, 33 and 35. | ||
| TDA/Ni | 1644 cm−1 | H-Bonding |
| Δ = 1538 − 1397 = 143 cm−1 | Bridging bidentate | |
| TDA/Ca | 1692 cm−1, 1684 cm−1 | H-Bonding |
| Δ = 1574 − 1460 = 114 cm−1 | Chelating bidentate | |
| Δ = 1574 − 1416 = 158 cm−1 | Ionic | |
| Δ = 1574 − 1397 = 177 cm−1 | Bridging bidentate | |
| Δ = 1538 − 1460 = 78 cm−1 | Chelating bidentate | |
| Δ = 1538 − 1416 = 122 cm−1 | — | |
| Δ = 1538 − 1397 = 141 cm−1 | Bridging bidentate | |
| Δ = 1526 − 1460 = 66 cm−1 | Chelating bidentate | |
| Δ = 1526 − 1416 = 110 cm−1 | Chelating bidentate | |
| Δ = 1526 − 1397 = 129 cm−1 | — | |
| TDA/Cu | Δ = 1585 − 1462 = 123 cm−1 | — |
| Δ = 1585 − 1417 = 168 cm−1 | Ionic | |
| Δ = 1585 − 1397 = 188 cm−1 | Bridging bidentate | |
| TDA/Zn | 1638 cm−1 | H-Bonding |
| Δ = 1539 − 1462 = 77 cm−1 | Chelating bidentate | |
| Δ = 1539 − 1397 = 142 cm−1 | Bridging bidentate | |
| TDA | 1692 cm−1 | H-Bonding |
All TDA/M can be photopolymerized. Polymerization of TDA/Zn assemblies under UV irradiation at 254 nm causes a characteristic absorption band of blue phase PDA at around 600–700 nm (Fig. 3). This result indicates the formation of a conjugated polymer backbone after UV irradiation. The color of the sample changed to blue. Similar photopolymerization behavior was observed for all the other TDA (co-)assemblies. The standard methods of molecular weight determination such as GPC are not appropriate because our samples are insoluble.
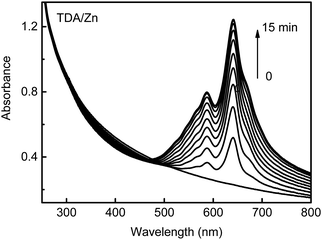 | ||
| Fig. 3 UV-vis absorption spectra of TDA/Zn co-assembly recorded after various irradiation times of UV light at 254 nm. | ||
It is well known that the mechanism of photopolymerization of diacetylene is a topochemical reaction.36,37 The reaction can take place in close-packed structures, such as crystals,36,37 monolayers,38 Langmuir–Blodgett films,38,39 liposomes,38 micelles or vesicles.38 Obviously, the microenvironments of the TDA assemblies are suitable for the topochemical reaction, which is proved by the characteristic absorption band of blue phase PDA at 600–700 nm. The morphologies of PTDA and the PTDA/M co-assemblies were observed using a TEM (Fig. 4). PTDA without metal ions formed spherical nanoparticles with a diameter of a few tens of nanometers. PTDA/Ca formed nanoparticles with a typical size of 30–120 nm. PTDA/Ni assembled into spherical nanoparticles with a typical size of 40–200 nm. PTDA/Cu formed lamellar-like nanostructures with a typical size of 50 nm to several hundred nanometers. PTDA/Zn assembled into lamellar-like structures with a typical size of several hundred nanometers. The structure of PTDA/Zn was further characterized by focusing the electron beam on a piece of the lamellar-like nanostructure to obtain an EDS spectrum. As shown in Fig. 4f, the signals of Zn are very clear in the EDS spectrum. This result shows Zn2+ is introduced into the PTDA assemblies, which is in accordance with the FTIR result.
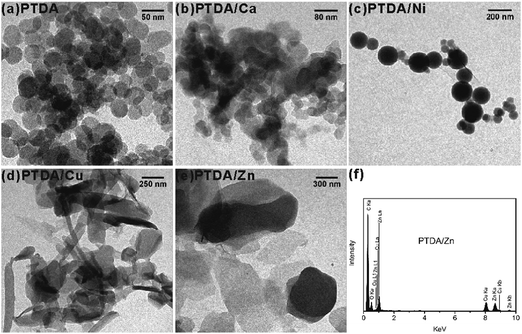 | ||
| Fig. 4 TEM images of (a) PTDA, (b) PTDA/Ca, (c) PTDA/Ni, (d) PTDA/Cu and (e) PTDA/Zn; (f) EDS spectrum of PTDA/Zn. | ||
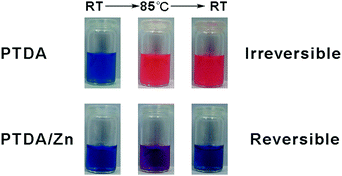
Thermochromism of PTDA and PTDA/Zn was first tested as soon as these co-assemblies were obtained. As shown in Fig. 5, PTDA showed irreversible thermochromism and PTDA/Zn showed reversible thermochromism. Metal ions have effects on the thermochromism of PTDA assemblies. In terms of this observation, it is anticipated that PTDA with different metal ions may show different responsive properties upon other stimuli such as solvents.
The THF-induced color change of PTDA, PTDA/Ca and PTDA/Zn was investigated using UV-vis absorption spectroscopy. As shown in Fig. 6a and b, when the concentration of THF reached 11.8% in PTDA and 14.3% in PTDA/Ca, respectively, the characteristic absorption bands of blue phase PDA disappeared. The color change of these two samples was observed by the naked eye. The colors of the two samples changed to red when the concentrations of THF went over a critical value. However, the blue phase band of PTDA/Zn at 600–700 nm did not disappear even when the concentration of THF was as high as 60% (Fig. 6c). The proportions of blue phase PDA and red phase PDA remain the same when the concentration of THF is between 14.3% and 60%. The color of PTDA/Zn became purple but not red, which is totally different from that of PTDA and PTDA/Ca. The colorimetric response (CR) of PTDA, PTDA/Ca and PTDA/Zn with different concentrations of THF was calculated according to the UV-vis absorption spectra (Fig. 6d). PTDA was the most sensitive to THF. PTDA/Zn is the most resistant to THF. The sensitivity of PTDA/Ca is between the sensitivities of PTDA and PTDA/Zn. Based on these results, we conclude that PTDA assemblies with different metal ions show different solvatochromism to the same solvent.
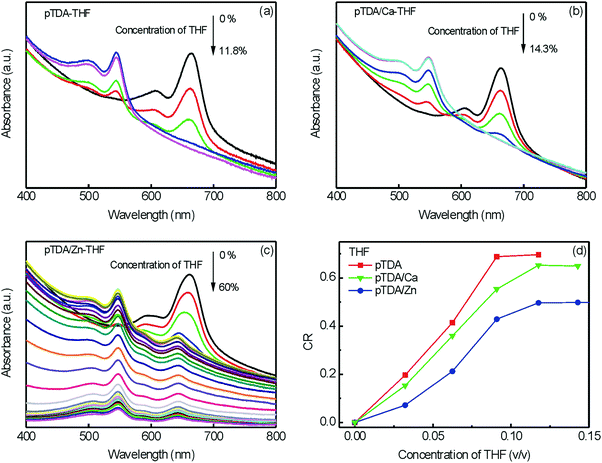 | ||
| Fig. 6 UV-vis absorption spectra of (a) PTDA, (b) PTDA/Ca and (c) PTDA/Zn at different concentrations of THF. (d) THF-induced colorimetric response (CR) of PTDA, PTDA/Ca and PTDA/Zn. | ||
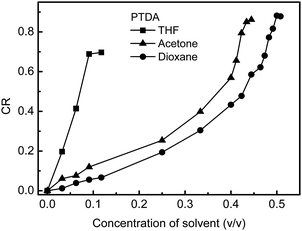
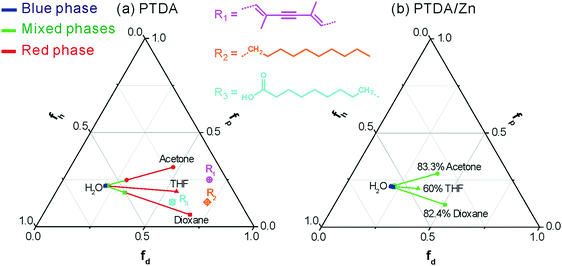
The CR of PTDA in different concentrations of THF, dioxane and acetone is shown in Fig. 7. PTDA is the most sensitive to THF, the least sensitive to acetone and the sensitivity of PTDA to dioxane is in the middle. So, PTDA showed different solvatochromism to different solvents. It is well known that the solvatochromism of PDAs comes from the polymer–solvent interactions that change the chain conformations of PDAs.40 The strength of the polymer–solvent interaction can be calculated according to the solubility parameters.30 The solubility parameters of the side chains and backbone of PTDA and the solvent environments were calculated and a phase diagram (Teas plot) of PTDA in different solvent environments is shown in Fig. 8a. Details of the calculation of the solubility parameters are described in the Experimental section and the ESI.† In the Teas plot, THF is near both the backbone and the side chains of PTDA; acetone is near the backbone of PTDA but away from the side chains of PTDA; dioxane is near the side chains of PTDA but away from the backbone of PTDA. This result indicates that THF can swell both the backbone and the side chains of PTDA well and the other two solvents can only swell the side chains or the backbone of PTDA. THF is a “stronger” solvent for swelling PTDA, which results in PTDA being more sensitive to THF. So, the theoretical calculations are in accordance with the experimental results shown in Fig. 7.
The solubility parameters of PTDA/Zn cannot be calculated with the current knowledge of solubility parameters. The calculation of the solubility parameters of hybrids of polymer/metal ions requires an improvement of current solubility theory. The solubility parameters of the solvent environments of PTDA/Zn can be calculated and they are shown in Fig. 8b. As shown in Fig. 8b, the phase behaviour of PTDA/Zn is quite different from that of PTDA. PTDA/Zn is not only more resistant to THF (the result of Fig. 6) but also more resistant to acetone and dioxane, indicating that coordination with Zn2+ improved the stability of PTDA. It is well known that covalent bonds, hydrogen bonds and π–π stacking can improve the stability of PDAs.8,9,12,13 The coordination between carboxyl groups and Zn2+ plays the same role as that of the other bonds mentioned above.
As discussed before, both separation values of Cu2+ and Zn2+ are in the region of bridging bidentate. However, the solvatochromism of PTDA/Cu is totally different from that of PTDA/Zn. PTDA/Cu is even more sensitive to solvents than PTDA without metal ions (Fig. 9). There are two possible reasons. One is that the solvents can coordinate with Cu2+. The other is that the difference of the separation values of PTDA/Zn and PTDA/Cu is as large as 15 cm−1, indicating different coordination geometries between them.31,33 Huang et al. reported that the UV polymerization of Langmuir–Blodgett films of TDA with Cu2+ results in red phase PDA but not blue phase PDA.31 PTDA/Cu may have a strong tendency to form the red phase conformation. The sensitivity of PTDA/Cu allows us to obtain co-assemblies that are more sensitive than PTDA without metal ions.
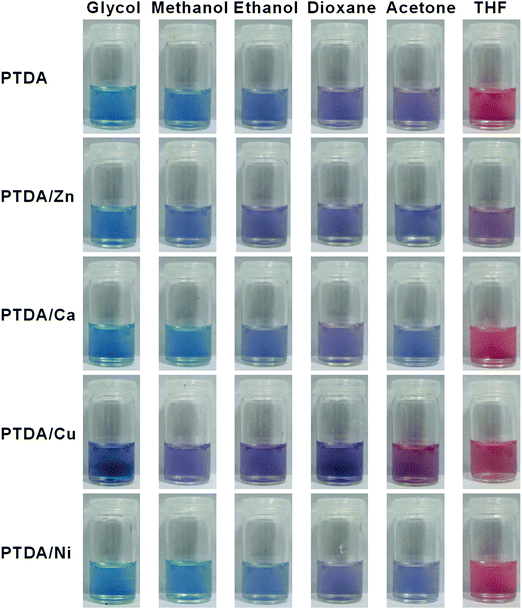 | ||
| Fig. 9 Photographs of PTDA and PTDA/M (M = Zn, Cu, Ca, Ni) after exposure to organic solvents. The volume fractions of the solvents are 33.3%. | ||
It should be noted that a CR value of 0.10–0.15 is usually readily discernible by the naked eye.41 To probe the feasibility of a visual solvent sensor system based on PTDA co-assemblies with different metal ions, 1 mL of organic solvent such as methanol, THF, ethanol, glycol, dioxane and acetone was added to 2 mL of PTDA co-assemblies with different metal ions. Photos of the samples were taken after the addition of the solvents and the assemblies were mixed for 1 min. As shown in Fig. 9, PTDA can distinguish methanol from ethanol, but it cannot distinguish dioxane from acetone; PTDA/Cu can distinguish dioxane from acetone, but it cannot distinguish methanol from ethanol. However, when PTDA and PTDA/Cu are put together in a library, methanol, ethanol, dioxane and acetone can be distinguished. As shown in Fig. 9, we used PTDA and PTDA co-assemblies with four different metal ions to construct a library. When used in combination, the PDA assemblies in this library allow for the visual differentiation of six organic solvents by simply monitoring the color changes. The metal ion solutions without PDA assemblies were almost colorless, showing the color changes are indeed caused by the structural change of the PDA assemblies (ESI,† Fig. S4 and S5).
The above-mentioned results showed that metal ions have a strong influence on the color change of PDA assemblies. The solvent-induced color changes in the PTDA assemblies with different metal ions can stay nearly unchanged for at least several hours. The vivid color change in response to the organic solvents, which can be observed by the naked eye, is a major advantage of PDA-based sensors. The number of distinguishable organic solvents should increase when more different metal ions are used. As a kind of self-assembled coordination system, this system is easily tunable by varying the metal ions. Compared with other PDA-based solvent sensors,20,29 the advantage of the current system is that only one commercially available diacetylene monomer is used as the building block of the sensor system. Therefore, tedious synthesis work is avoided and the cost of preparation of a solvent sensor system can be reduced. A combinatorial approach could also be developed by introducing different ratios of PTDA and PTDA/Zn into film systems to fabricate a library of PDA-based sensors with different sensitivities. Our current effort is focused on the fabrication of test papers containing PTDA assemblies with different metal ions.
Conclusions
In summary, a solvent sensor system based on coordination of different metal ions with a commercially available diacetylene has been developed. The experimental results demonstrate that the different solvatochromism of these co-assemblies comes from different coordination interactions between PTDA and the metal ions. The advantages of the PDA/metal ion co-assemblies include low cost and easy fabrication. We believe this study opens up a new route for the design of conjugated polymer-based solvent sensor systems. The strategy of using metal coordination should be applicable for construction of other functional polymer/metal ion co-assemblies.Conflicts of interest
There are no conflicts to declare.Acknowledgements
S. W. acknowledges support from the Deutsche Forschungsgemeinschaft (DFG, WU 787/2-1, WU 787/8-1, and WU 787/10-1), the Fonds der Chemischen Industrie (FCI, No. 661548), and the Thousand Talents Plan for Young Professionals. Q. Z. acknowledges support from the National Natural Science Foundation of China (NSFC) (51673178). We thank Prof. G. Zou for the helpful discussion. Open Access funding provided by the Max Planck Society.References
- D. T. McQuade, A. E. Pullen and T. M. Swager, Conjugated Polymer-Based Chemical Sensors, Chem. Rev., 2000, 100(7), 2537–2574 CrossRef PubMed.
- B. Y. Gao, G. J. Yuan and L. L. Ren, Polydiacetylene-functionalized alumina aerogels as visually observable sensing materials for detecting VOCs concentration, J. Mater. Sci., 2018, 53(9), 6698–6706 CrossRef.
- Y. S. Cho, D. H. Ma and K. H. Ahn, Shape-selective, stoichiometric sensing of fatty acids with a mixed polydiacetylene liposome, J. Mater. Chem. C, 2016, 4(14), 2871–2876 RSC.
- J. E. Yang, J. S. Park, E. Cho, S. Jung and S. R. Paik, Robust Polydiacetylene-Based Colorimetric Sensing Material Developed with Amyloid Fibrils of alpha-Synuclein, Langmuir, 2015, 31(5), 1802–1810 CrossRef PubMed.
- C. F. Chen, J. Chen, T. Y. Wang and M. H. Liu, Fabrication of Helical Nanoribbon Polydiacetylene via Supramolecular Gelation: Circularly Polarized Luminescence and Novel Diagnostic Chiroptical Signals for Sensing, ACS Appl. Mater. Interfaces, 2016, 8(44), 30608–30615 CrossRef PubMed.
- D. H. Park, W. Jeong, M. Seo, B. J. Park and J. M. Kim, Inkjet-Printable Amphiphilic Polydiacetylene Precursor for Hydrochromic Imaging on Paper, Adv. Funct. Mater., 2016, 26(4), 498–506 CrossRef.
- S. Okada, S. Peng, W. Spevak and D. Charych, Color and Chromism of Polydiacetylene Vesicles, Acc. Chem. Res., 1998, 31(5), 229–239 CrossRef.
- D. J. Ahn and J.-M. Kim, Fluorogenic Polydiacetylene Supramolecules: Immobilization, Micropatterning, and Application to Label-Free Chemosensors, Acc. Chem. Res., 2008, 41(7), 805–816 CrossRef PubMed.
- B. Yoon, S. Lee and J. M. Kim, Recent conceptual and technological advances in polydiacetylene-based supramolecular chemosensors, Chem. Soc. Rev., 2009, 38(7), 1958–1968 RSC.
- S. Wu, L. F. Niu, J. Shen, Q. J. Zhang and C. Bubeck, Aggregation-Induced Reversible Thermochromism of Novel Azo Chromophore-Functionalized Polydiacetylene Cylindrical Micelles, Macromolecules, 2009, 42(1), 362–367 CrossRef.
- S. Wu, F. Shi, Q. J. Zhang and C. Bubeck, Stable Hydrogen-Bonding Complexes of Poly(4-vinylpyridine) and Polydiacetylenes for Photolithography and Sensing, Macromolecules, 2009, 42(12), 4110–4117 CrossRef.
- H. S. Peng, J. Tang, L. Yang, J. B. Pang, H. S. Ashbaugh, C. J. Brinker, Z. Z. Yang and Y. F. Lu, Responsive periodic mesoporous polydiacetylene/silica nanocomposites, J. Am. Chem. Soc., 2006, 128(16), 5304–5305 CrossRef PubMed.
- H. S. Peng, J. Tang, J. B. Pang, D. Y. Chen, L. Yang, H. S. Ashbaugh, C. J. Brinker, Z. Z. Yang and Y. F. Lu, Polydiacetylene/silica nanocomposites with tunable mesostructure and thermochromatism from diacetylenic assembling molecules, J. Am. Chem. Soc., 2005, 127(37), 12782–12783 CrossRef PubMed.
- M. Takeuchi, H. Imai and Y. Oaki, Effects of the intercalation rate on the layered crystal structures and stimuli-responsive color-change properties of polydiacetylene, J. Mater. Chem. C, 2017, 5(32), 8250–8255 RSC.
- X. J. Yan and X. Q. An, Thermal and photic stimuli-responsive polydiacetylene liposomes with reversible fluorescence, Nanoscale, 2013, 5(14), 6280–6283 RSC.
- G. Y. Ma, A. M. Muller, C. J. Bardeen and Q. Cheng, Self-assembly combined with photopolymerization for the fabrication of fluorescence “turn-on” vehicle sensors with reversible “on–off” switching properties, Adv. Mater., 2006, 18(1), 55–60 CrossRef.
- S. J. Kew and E. A. H. Hall, pH response of carboxy-terminated colorimetric polydiacetylene vesicles, Anal. Chem., 2006, 78(7), 2231–2238 CrossRef PubMed.
- K. Tashiro, H. Nishimura and M. Kobayashi, First success in direct analysis of microscopic deformation mechanism of polydiacetylene single crystal by the X-ray imaging-plate system, Macromolecules, 1996, 29(25), 8188–8196 CrossRef.
- J. Lee, H. J. Kim and J. Kim, Polydiacetylene liposome arrays for selective potassium detection, J. Am. Chem. Soc., 2008, 130(15), 5010–5011 CrossRef PubMed.
- J. Yoon, Y. S. Jung and J. M. Kim, A Combinatorial Approach for Colorimetric Differentiation of Organic Solvents Based on Conjugated Polymer-Embedded Electrospun Fibers, Adv. Funct. Mater., 2009, 19(2), 209–214 CrossRef.
- J. S. Kauffman, B. M. Ellerbrock, K. A. Stevens, P. J. Brown, W. T. Pennington and T. W. Hanks, Preparation, Characterization, and Sensing Behavior of Polydiacetylene Liposomes Embedded in Alginate Fibers, ACS Appl. Mater. Interfaces, 2009, 1(6), 1287–1291 CrossRef PubMed.
- A. Pevzner, S. Kolusheva, Z. Orynbayeva and R. Jelinek, Giant chromatic lipid/polydiacetylene vesicles for detection and visualization of membrane interactions, Adv. Funct. Mater., 2008, 18(2), 242–247 CrossRef.
- Y. Z. Wang, H. L. Li, C. Wu, Y. Yang, L. Shi and L. X. Wu, Chiral Heteropoly Blues and Controllable Switching of Achiral Polyoxometalate Clusters, Angew. Chem., Int. Ed., 2013, 52(17), 4577–4581 CrossRef PubMed.
- L. Tan, M. Y. Yang, H. X. Wu, Z. W. Tang, J. Y. Xiao, C. J. Liu and R. X. Zhuo, Glucose- and pH-Responsive Nanogated Ensemble Based on Polymeric Network Capped Mesoporous Silica, ACS Appl. Mater. Interfaces, 2015, 7(11), 6310–6316 CrossRef PubMed.
- D. F. Li, F. F. Lu, J. Wang, W. D. Hu, X. M. Cao, X. Ma and H. Tian, Amorphous Metal-Free Room-Temperature Phosphorescent Small Molecules with Multicolor Photoluminescence via a Host–Guest and Dual-Emission Strategy, J. Am. Chem. Soc., 2018, 140(5), 1916–1923 CrossRef PubMed.
- R. R. Chance, Chromism in Polydiacetylene Solutions and Crystals, Macromolecules, 1980, 13(2), 396–398 CrossRef.
- Y. F. Lu, Y. Yang, A. Sellinger, M. C. Lu, J. M. Huang, H. Y. Fan, R. Haddad, G. Lopez, A. R. Burns, D. Y. Sasaki, J. Shelnutt and C. J. Brinker, Self-assembly of mesoscopically ordered chromatic polydiacetylene/silica nanocomposites, Nature, 2001, 410(6831), 913–917 CrossRef PubMed.
- P. J. Wu, S. Y. Kuo, Y. C. Huang, C. P. Chen and Y. H. Chan, Polydiacetylene-Enclosed Near-Infrared Fluorescent Semiconducting Polymer Dots for Bioimaging and Sensing, Anal. Chem., 2014, 86(10), 4831–4839 CrossRef PubMed.
- J. Yoon, S. K. Chae and J. M. Kim, Colorimetric sensors for volatile organic compounds (VOCs) based on conjugated polymer-embedded electrospun fibers, J. Am. Chem. Soc., 2007, 129(11), 3038–3039 CrossRef PubMed.
- B. A. Miller-Chou and J. L. Koenig, A review of polymer dissolution, Prog. Polym. Sci., 2003, 28(8), 1223–1270 CrossRef.
- X. Huang, S. G. Jiang and M. H. Liu, Metal ion modulated organization and function of the Langmuir–Blodgett films of amphiphilic diacetylene: photopolymerization, thermochromism, and supramolecular chirality, J. Phys. Chem. B, 2005, 109(1), 114–119 CrossRef PubMed.
- D. J. Ahn, E. H. Chae, G. S. Lee, H. Y. Shim, T. E. Chang, K. D. Ahn and J. M. Kim, Colorimetric reversibility of polydiacetylene supramolecules having enhanced hydrogen-bonding under thermal and pH stimuli, J. Am. Chem. Soc., 2003, 125(30), 8976–8977 CrossRef PubMed.
- J. E. Tackett, FT-IR characterization of metal acetates in aqueous solution, Appl. Spectrosc., 1989, 43(3), 483–489 CrossRef.
- R. C. Gore, R. B. Barnes and E. Petersen, Infrared absorption of aqueous solutions of organic acids and their salts, Anal. Chem., 1949, 21(3), 382–386 CrossRef.
- C. Ohe, H. Ando, N. Sato, Y. Urai, M. Yamamoto and K. Itoh, Carboxylate-counterion interactions and changes in these interactions during photopolymerization of a long-chain diacetylene monocarboxylic acid at air–water interfaces: external infrared reflection absorption spectroscopic study, J. Phys. Chem. B, 1999, 103(3), 435–444 CrossRef.
- G. Wegner, Topochemical polymerization of monomers with conjugated triple bonds, Angew. Chem., Int. Ed., 1971, 10(5), 355 Search PubMed.
- H. Sixl, Spectroscopy of the intermediate states of the solid-state polymerization reaction in diacetylene crystals, Adv. Polym. Sci., 1984, 63, 49–90 CrossRef.
- H. Ringsdorf, B. Schlarb and J. Venzmer, Molecular architecture and function of polymeric oriented systems: models for the study of organization, surface recognition, and dynamics of biomembranes, Angew. Chem., Int. Ed., 1988, 27(1), 113–158 CrossRef.
- G. Lieser, B. Tieke and G. Wegner, Structure, phase transitions and polymerizability of multilayers of some diacetylene monocarboxylic acids, Thin Solid Films, 1980, 68(1), 77–90 CrossRef.
- M. Schott, The colors of polydiacetylenes: a commentary, J. Phys. Chem. B, 2006, 110(32), 15864–15868 CrossRef PubMed.
- I. Gill and A. Ballesteros, Immunoglobulin–polydiacetylene sol–gel nanocomposites as solid-state chromatic biosensors, Angew. Chem., Int. Ed., 2003, 42(28), 3264–3267 CrossRef PubMed.
Footnote |
| † Electronic supplementary information (ESI) available: Calculations of the solubility parameters, photograph and UV-vis absorption spectra of solutions of M(NO3)2. See DOI: 10.1039/c8sm01282b |
| This journal is © The Royal Society of Chemistry 2018 |

