 Open Access Article
Creative Commons Attribution 3.0 Unported Licence
Ideal wet two-dimensional foams and emulsions with finite contact angle†
S. J.
Cox
 *a,
A. M.
Kraynik
bc,
D.
Weaire
c and
S.
Hutzler
 c
c
aDepartment of Mathematics, Aberystwyth University, Aberystwyth SY23 3BZ, UK. E-mail: foams@aber.ac.uk
bSandia National Laboratories (retired), Albuquerque, New Mexico, USA
cSchool of Physics, Trinity College Dublin, The University of Dublin, Ireland
First published on 4th July 2018
Abstract
We present simulations that show that the equilibrium structure of an ideal two-dimensional foam with a finite contact angle develops an inhomogeneity for high liquid fraction ϕ. In liquid–liquid emulsions this inhomogeneity is known as flocculation. In the case of an ordered foam this requires a perturbation, but in a disordered foam inhomogeneity grows steadily and spontaneously with ϕ, as demonstrated in our simulations performed with the Surface Evolver.
1. Introduction
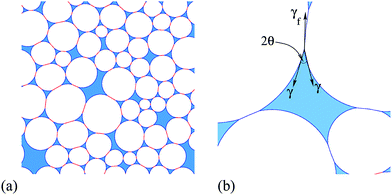
In emulsions, the term flocculation refers to the (spontaneous) clustering of droplets, leading to the formation of density inhomogeneities. Here we describe the onset of flocculation in computer simulations of two-dimensional (2D) liquid foams. This only occurs in systems where the liquid–gas interfaces meet at a finite contact angle θ, as illustrated in Fig. 1(b). Previous simulations of 2D foams with finite liquid fraction ϕ have taken this contact angle to be zero1 or, where that was not feasible for numerical reasons, as small as possible.2 We treat both liquid and gas as incompressible, since the pressure differences between bubbles are much smaller than atmospheric pressure, and so the results apply equally to emulsions.Two-dimensional foams have properties that are broadly similar to their three-dimensional counterparts, but are much simpler to analyse. Their study has early antecedents,3 and continues to be of interest today. The usual theoretical model is entirely two-dimensional, while the third dimension may be significant in relevant experimental systems, such as a foam trapped between two plates.3,4
A simulated example of an ideal 2D foam with finite liquid fraction ϕ and finite contact angle θ is shown in Fig. 1(a). It was produced by the method described in Appendix A, which minimizes the surface energy of the foam. The gas bubbles are surrounded by a network of smoothly-curved thin films connecting the liquid-filled Plateau borders, which each have three or more sides. There are therefore two types of interface: liquid–gas interfaces around each Plateau border, and gas–liquid–gas interfaces forming the bubble–bubble contacts. On each of the interfaces the Laplace–Young law relates the product of interfacial tension and curvature to the pressure difference across the interface,5,6 and consequently liquid films are represented by arcs of circles that meet at the vertices of Plateau borders. The films are considered to be infinitesimally thin, so all of the liquid in the foam is considered to be contained in the Plateau borders.
A finite contact angle implies that the interfacial tension associated with the bubble–bubble interfaces is less than twice that associated with the Plateau borders (see Fig. 1b). Note that throughout this paper “interfacial tension” is used for what is really a line tension (or energy per unit line length) in such an idealised 2D model. The contact angle θ is given by
 | (1) |
![[small script l]](https://www.rsc.org/images/entities/i_char_e146.gif) for the film thickness, the film tension is given by
for the film thickness, the film tension is given byγf = 2γ + V(![[small script l]](https://www.rsc.org/images/entities/i_char_e146.gif) ), ), | (2) |
![[small script l]](https://www.rsc.org/images/entities/i_char_e146.gif) ) is an effective interface potential. V can estimated from DLVO theory: it is negative and its derivative is equal to minus the disjoining pressure.8 The surface energy of the foam is the sum of the lengths of all interfaces, multiplied by their appropriate interfacial tension.
) is an effective interface potential. V can estimated from DLVO theory: it is negative and its derivative is equal to minus the disjoining pressure.8 The surface energy of the foam is the sum of the lengths of all interfaces, multiplied by their appropriate interfacial tension.
For bubbles immersed in a liquid, the presence of finite contact angles entails net attractive forces between them (see Fig. 2) when they are only slightly compressed together. This is similar to the attraction between droplets, when considering emulsions.9
 | ||
| Fig. 2 The (line) energy of two isolated circular bubbles is reduced when they share a common interface, if the contact angle θ is finite. | ||
In the present paper we address some basic consequences of introducing finite contact angles into the standard model of 2D foams, by analysing simulations carried out with the Surface Evolver software of Ken Brakke.10 We will see that finite contact angles, even if apparently very small, can have large effects.
Henry Princen introduced the concept of a contact angle between a thin liquid film and its adjacent Plateau border11 and he established its physical significance in foams and emulsions by analysing 2D ordered (hexagonal) monodisperse structures,7 which admit analytical solutions. The Surface Evolver and current computational resources enable the simulation of disordered foams, which is the usual practical case of interest. Princen's work was stimulated by his own measurements of contact angles for soap films in contact with bulk solution.12 He found that finite contact angles up to 17° could be achieved in surfactant (SDS) solutions at sufficiently high concentrations of added electrolytes. More recently, contact angles up to 30° have been found in emulsions.13
We shall begin in Section 2 by recapitulating Princen's 2D model of an ordered foam, which gave a number of exact results. This turns out to be instructive when discussing our own results from simulations of disordered polydisperse foams, which are described in Section 3. We summarize our conclusions in Section 4.
2. Ordered hexagonal foams
Even the apparently trivial case of an ordered 2D foam proves to present some challenges to detailed understanding, so we shall examine it carefully.Monodisperse 2D bubbles are arranged in equilibrium on an hexagonal lattice (Fig. 3). Princen7 showed that the liquid fraction ϕθ0 of such a packing at zero compression, which corresponds to zero osmotic pressure7,14,15 and minimal surface energy,7 is given by
 | (3) |
 | (4) |
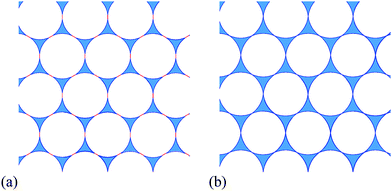 | ||
| Fig. 3 Examples of monodisperse hexagonal foams for contact angle θ = 6.26° and different values of liquid fraction. (a) Liquid fraction ϕθ0 = 0.084, where the energy is minimal (state of zero compression, eqn (3)). (b) Liquid fraction ϕθm = 0.128, the maximum value of liquid fraction at which the bubbles still remain in contact (eqn (7)). | ||
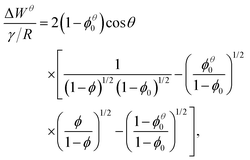
Princen calculated the work per unit area, ΔWθ, required to compress (by removing liquid) a foam from the liquid fraction ϕθ0 to any given ϕ,7 at constant bubble area. The bubble area is written in terms of the radius R of an undeformed circular bubble of the same area, resulting in‡
 | (5) |
In the following we will consider the energy per bubble E as a function of liquid fraction ϕ and contact angle θ. Using eqn (5) and  we obtain
 | (6) |
![[thin space (1/6-em)]](https://www.rsc.org/images/entities/char_2009.gif) cos
cos![[thin space (1/6-em)]](https://www.rsc.org/images/entities/char_2009.gif) θ) = (1 − ϕ0)−1/2.
θ) = (1 − ϕ0)−1/2.
The energy E(ϕ,θ) in eqn (6) may be characterised by two different critical values of the liquid fraction, as shown in Fig. 4. These are
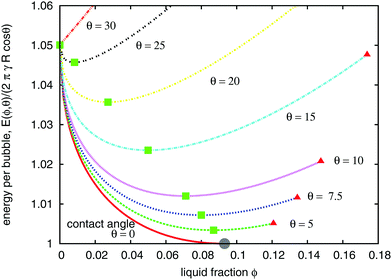 | ||
Fig. 4 Variation of the energy per bubble E(ϕ,θ)/(2πRγ![[thin space (1/6-em)]](https://www.rsc.org/images/entities/char_2009.gif) cos cos![[thin space (1/6-em)]](https://www.rsc.org/images/entities/char_2009.gif) θ) (eqn (6)) of an ordered hexagonal 2D foam with liquid fraction ϕ, for a range of different contact angles θ. (γ: bulk interfacial tension, R: radius of an undeformed (circular) bubble.) Symbols correspond to the critical liquid fractions ϕθ0 (green squares), ϕθm (red triangles), and ϕ0 (grey disc), defined in the text. θ) (eqn (6)) of an ordered hexagonal 2D foam with liquid fraction ϕ, for a range of different contact angles θ. (γ: bulk interfacial tension, R: radius of an undeformed (circular) bubble.) Symbols correspond to the critical liquid fractions ϕθ0 (green squares), ϕθm (red triangles), and ϕ0 (grey disc), defined in the text. | ||
• the liquid fraction ϕθ0 (eqn (3)) at which the energy has a minimum;
• the maximum value of liquid fraction ϕθm at which the bubbles remain in contact, given by
 | (7) |
Fig. 5 displays the variation of both ϕθ0 and ϕθm with contact angle θ. Note that θ = 0 is a special case because the critical values coincide,  . Fig. 3 shows an ordered foam at each of the critical liquid fractions ϕθm and ϕθ0, for contact angle θ = 6.26°.
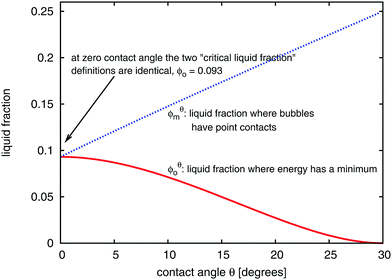 | ||
| Fig. 5 Variation of the critical liquid fractions ϕθ0 (eqn (3)), and ϕθm (eqn (7)) as a function of contact angle θ in an ordered hexagonal foam. | ||
When the contact angle is finite, the non-circular bubbles at ϕθm contact their neighbours at a point. However, this situation differs from the conventional wet limit for zero contact angle, as we explore below.
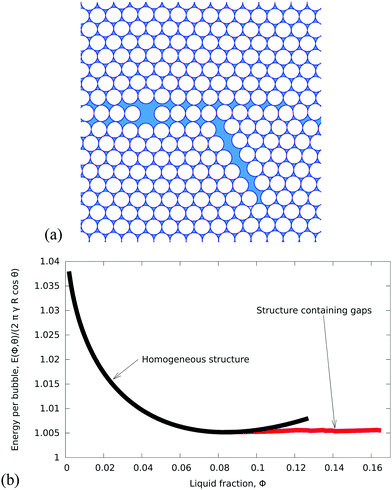
All points on the curves for energy as a function of liquid fraction, shown in Fig. 4, correspond to (possibly metastable) equilibrium structures. Since the liquid fraction ϕθ0 corresponds to the minimum energy, any homogeneous structure for which ϕ > ϕθ0 must be metastable, at least for an infinite sample. This is because an inhomogeneous structure can be defined, with constant energy (in the limit of infinite sample size) close to E(ϕθ0). This scenario is illustrated in Fig. 6, where we have represented the energy of the inhomogeneous structure by a horizontal line beyond ϕθ0.
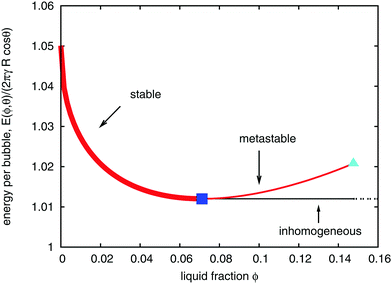 | ||
| Fig. 6 Variation of the energy per bubble E(ϕ,θ) of an initially ordered hexagonal foam (for contact angle θ = 10°). For values of liquid fraction exceeding ϕθ0 (marked by a blue square), the hexagonal bubble arrangement is metastable, since alternative inhomogeneous structures exist with lower energy. (Fig. 7(a) shows such an example, obtained from simulation.) The light blue triangle at critical liquid fraction ϕθm corresponds to the point where bubbles in an hexagonal arrangement no longer touch. | ||
The formation of inhomogeneities in the ordered monodisperse structure can be simulated by considering a representative area of foam that contains a large number of bubbles, and increasing the liquid fraction by expanding the system while keeping the bubble areas fixed. An example of such an inhomogeneous structure is shown in Fig. 7. Finite contact angles were included by assigning different values for the line tension in the bubble–bubble interfaces (γf) and the Plateau border sides (γ); the contact angle is given by eqn (1). (For further details see Appendix A.)
The inhomogeneity does not arise spontaneously in these simulations, but requires a perturbation at a liquid fraction just above ϕθ0. This is achieved by randomly displacing all of the Plateau border vertices by a small distance of about 0.13R; this allows the system to escape from the metastable branch by undergoing topological transitions that are triggered when film lengths go to zero. These result in the formation of cracks, or liquid pools, as illustrated in Fig. 7. The requirement of a perturbation to trigger instability is a familiar feature of highly symmetric structures that are locally stable, for which alternative structures of lower energy are available. Subsequently, increasing or decreasing the liquid fraction keeps the foam at roughly constant energy. Small fluctuations in the energy occur because, as the liquid fraction changes in this finite sample of foam, there are short periods during which the energy increases elastically, followed by topological transitions that reduce the energy. As the sample size increases, such fluctuations become less marked.
This instability is reminiscent of the observations by Abd el Kadar and Earnshaw16 in experiments with monodisperse 2D bubble rafts in an hexagonal confinement. About 25 minutes after foam formation, cracks appeared within the perfectly ordered structure, rapidly leading to the formation of a hole in the monolayer. No bubbles are lost in this process. The authors attribute the development of this inhomogeneity to the movement and build-up of local stresses, for example due to small variations in bubble size. It is conceivable that the existence of a finite contact angle plays a further role, although the concept cannot be applied straightforwardly to bubble rafts, as opposed to 2D foam trapped between plates.
3. Disordered foams with finite contact angle
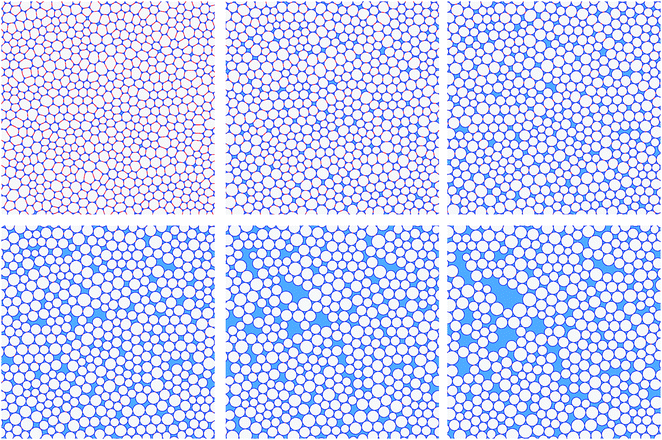
Having established the effect of a finite contact angle for ordered foams we now turn to the results of Surface Evolver simulations of disordered foams, as exemplified in Fig. 8. The results presented below are based on five samples with N = 1500 bubbles and different values of the contact angle θ between 2.6° and 15.9°. The foams are polydisperse: the bubbles have average area close to 1 but the variation in bubble areas differs between samples. The polydispersity is captured by the parameter | (8) |
 is the Sauter mean radius in 2D and the average, denoted with 〈
![[thin space (1/6-em)]](https://www.rsc.org/images/entities/char_2009.gif) 〉, is over all bubbles in the foam. Details of the simulations are presented in Appendix A. A video of the wetting of a foam with contact angle 15.9° is available in the ESI.†
〉, is over all bubbles in the foam. Details of the simulations are presented in Appendix A. A video of the wetting of a foam with contact angle 15.9° is available in the ESI.†
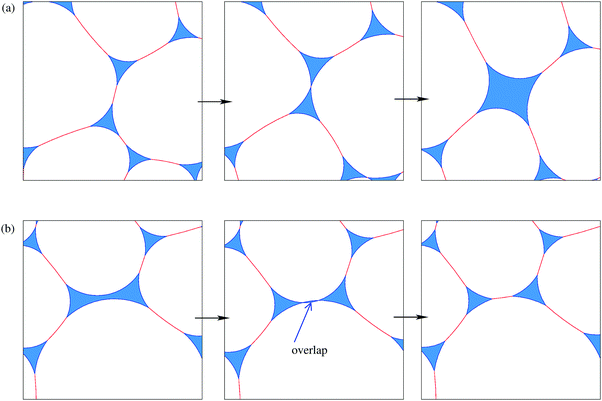
We simulate the wetting of a dry foam by increasing the area of liquid and keeping the area of gas constant. We again find that inhomogeneities develop as the liquid fraction ϕ is increased. However, these inhomogeneities do not necessarily result from metastable structures of the kind discussed in the previous section. The disordered samples spontaneously undergo discrete topological transitions as the liquid fraction is increased; these occur when the length of a film between two neighbouring bubbles goes to zero, causing them to separate. In the simplest case, two bubbles that share a shrinking edge separate, and two three-sided Plateau borders merge to form a four-sided Plateau border, as shown in the Appendix, Fig. 11. Similarly, non-adjacent edges on a Plateau border with four or more sides may come into contact, and a new edge is formed. Various combinations of these topological transitions are responsible for the highly irregular liquid regions shown in Fig. 8.
Fig. 9 illustrates the growth of inhomogeneity as the liquid fraction is increased. The evolving inhomogeneity exhibits an acceleration in the growth of a few, increasingly larger, Plateau borders, while most remain small. The area of the largest Plateau border, Amaxpb, within a sample (Fig. 9) increases roughly exponentially with liquid fraction.
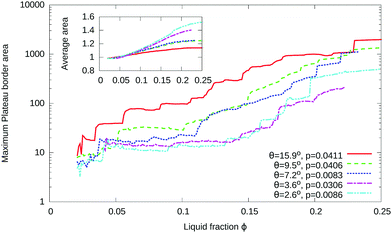 | ||
| Fig. 9 The development of inhomogeneities in disordered foams with finite contact angle is illustrated by the observation that, while the average area of a Plateau border 〈Apb〉 grows sublinearly with liquid fraction ϕ (inset), the area of the largest Plateau border Amaxpb (at each value of ϕ) grows approximately exponentially (note the logarithmic vertical axis). The data shown is for five simulations of disordered foams, with values of contact angle as indicated. The areas are normalized by the average area 〈Apb〉 that would result if Plateau borders did not merge, eqn (9). Note that the drops in area at low liquid fraction correspond to the splitting of a Plateau border with more than three sides into three-sided Plateau borders, as explained in Appendix A. | ||
The average area of the Plateau borders 〈Apb〉 is given by
 | (9) |
The energy per bubble, defined as the total energy divided by the number of bubbles N, is plotted as a function of liquid fraction in Fig. 10. It has been rescaled by (1 + p) to compensate for the polydispersity of the samples, as explained in Appendix B. As in the case of ordered foams, an increase in contact angle leads to an increase in energy for a given value of the liquid fraction. For fixed contact angle, the energy decreases with increasing liquid fraction, at first steeply, and then more slowly. The initially monotonic decrease in energy with ϕ is consistent with the gradual development of inhomogeneities that we observe in disordered foams.
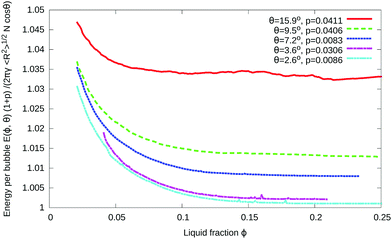 | ||
| Fig. 10 Variation of the energy with liquid fraction ϕ for five disordered foams with finite contact angles. The gradual development of inhomogeneities, as shown in Fig. 8, is accompanied by a decrease in energy as a function of ϕ followed by saturation to a roughly constant value. The energy has been rescaled using the polydispersity parameter p defined in eqn (8). | ||
What should we expect the eventual state of a foam to be, were this wetting process to be continued to ever higher values of liquid fraction, beyond the usual 2D wet foam limit? We expect that the presence of a finite contact angle, which causes an effective adhesion between the bubbles, will lead to one large cluster of bubbles surrounded by liquid. This is again reminiscent of the clustering seen in 2D bubble rafts.18
4. Summary and conclusions
Due to their increased stability, adhesive or “sticky” 3D emulsions, featuring droplet flocculation,13,19,20 find many applications in the food and cosmetics industries. Here we have discussed flocculation in the case of the analogous system of liquid foams.Unlike the familiar case of a foam with zero contact angle, an ideal two-dimensional foam with a finite contact angle develops an inhomogeneity for high liquid fraction ϕ. In an ordered foam this inhomogeneity appears at a critical value of ϕ, but in a disordered foam there is a gradual development of inhomogeneity with increasing ϕ. This implies that the notion of the wet limit is ill-defined in foams with finite contact angle.
As in other aspects of foam physics, our results for 2D foam should give a general indication of the corresponding properties of 3D foams and emulsions. It is surprising that the subject of finite contact angles has remained underdeveloped, and it is hoped that the present results will stimulate further experiments and simulations. Indeed, there does not appear to be any 2D data that could be compared to our findings.
In light of the described inhomogeneous structures, it may now be of interest to revisit earlier work on the ideal disordered 2D foam model, but including a finite contact angle. For example, does a finite contact angle affect the statistics of bubble rearrangements, perhaps by suppressing system-wide avalanches of topological changes, following a small increase in ϕ?21
Conflicts of interest
There are no conflicts to declare.Appendix A. Simulations using the Surface Evolver
We carried out simulations of both ordered (hexagonal) and disordered (polydisperse) foams with finite contact angles using Ken Brakke's Surface Evolver software10 to relax an initial foam structure to a minimum of the surface energy (which is proportional to the total perimeter), subject to fixed bubble areas.In principle, all the properties of an ordered hexagonal foam can be captured from a single cell, considered with periodic boundary conditions. However, since we seek an instability of this structure to an inhomogeneous state, we must instead simulate many cells. We chose to reproduce the basic hexagonal cell 256 times to form a 16 × 16 hexagonal lattice with periodic boundary conditions.
The disordered foams are made as dry foams, also with periodic boundary conditions, from a Voronoi construction in the usual way;22 these have N = 1500 bubbles, with average area 〈A〉 close to 1, and different polydispersity.
Both ordered and disordered foams are turned into wet foams of liquid fraction ϕ ≈ 0.03 by adding a small triangular Plateau border at each three-fold vertex; the liquid fraction is set by the total area of all Plateau borders. They have no individual area constraints, and therefore all have the same pressure.
Each side of each Plateau border is associated with a fixed bulk interfacial tension γ ≥ ½; the interfacial tension in the thin liquid films is set to γf = 1. The contact angle is then given by eqn (1). The current version of the Surface Evolver software does not allow for the simulation of 2D foams with zero contact angle and we find that θ = 2.6° is the minimum value that we can choose to ensure convergence. Examination of the consequences of this limitation provided some initial motivation for this study.
In the Surface Evolver, each edge is represented as a circular arc, and a local minimum of the interfacial energy is sought using up to 2 × 10⁴ iterations to achieve a relative accuracy close to 10−6.
The liquid fraction is changed by increasing the area of liquid and keeping the area of gas constant (so the size of the periodic box increases). Small increments in ϕ allow us to explore a large range of liquid fractions: at each step, the liquid fraction is increased by 0.001, up to about ϕ = 0.25. We used the gradient descent method for energy minimisation, with occasional Hessian iterations, to move towards a minimum of interfacial energy  . Here Lj denotes the lengths of the interfaces, and γj is either γ or γf, depending on whether the interface is associated with a Plateau border or a film.
As the foam evolves, bubble rearrangements (topological changes) occur. We chose a critical film length of 10−4 below which these are triggered. The difficult step is in recognising when a four-sided Plateau border should split into two three-sided Plateau borders (or, in general, a many-sided Plateau border should split into two parts). To achieve this we check whether two sides of any Plateau border with more than three sides overlap, as illustrated in Fig. 11. If they do, these two sides are joined, to split the Plateau border. We briefly increase γ and perform a few iterations, and then the minimization continues.
Appendix B. Energy of a polydisperse 2D foam
The energy of a foam decreases with increasing polydispersity in the bubble areas at fixed liquid fraction.17 We capture this dependence as follows. We define polydispersity in terms of the 2D Sauter mean radius according to eqn (8) and then the energy of an equilibrium, dry (i.e., ϕ = 0), 2D foam can be written as | (B.1) |
Acknowledgements
SJC wishes to thank K. Brakke for advice about Surface Evolver simulations and R. Höhler for useful discussions. SH and DW acknowledge the support of the MPNS COST Actions MP1106 Smart and green interfaces and MP1305 Flowing matter. The visit of AMK to the TCD Foams and Complex Systems group was funded by the TCD Visiting Professors Fund and the Dublin Graduate Physics Program, and his visit to Aberystwyth was funded by the Distinguished Visiting Fellowship Scheme of the Royal Academy of Engineering. Financial support from Science Foundation Ireland (SFI) under grant number 13/IA/1926 (SH, DW) and the European Space Agency ESA, Project microG-Foam, AO99075 and contract 4000115113, ‘Soft Matter Dynamics’ (SJC, SH, DW) is also gratefully acknowledged.References
- F. Bolton and D. Weaire, The effects of Plateau borders in the two-dimensional soap froth. II. General simulation and analysis of rigidity loss transition, Philos. Mag. B, 1992, 65, 473–487 Search PubMed.
- Z. Jing, S. Wang, M. Lv, Z. Wanga and Z. Luoa, The effect of plastic rearrangements on the flow of two-dimensional wet foam, Soft Matter, 2015, 11, 2973–2982 RSC.
- C. S. Smith, The shapes of metal grains, with some other metallurgical applications of topology, Metal Interfaces, ASM, Cleveland, 1952, pp. 65–108 Search PubMed.
- S. J. Cox and E. Janiaud, On the structure of quasi-two-dimensional foams, Philos. Mag. Lett., 2008, 88, 693–701 CrossRef.
- D. Weaire and S. Hutzler, The Physics of Foams, Oxford University Press, 1999 Search PubMed.
- I. Cantat, S. Cohen-Addad, F. Elias, F. Graner, R. Höhler, O. Pitois, F. Rouyer and A. Saint-Jalmes, Foams: Structure and Dynamics, Oxford University Press, 2013 Search PubMed.
- H. M. Princen, Highly concentrated emulsions. I. Cylindrical systems, J. Colloid Interface Sci., 1979, 71(1), 55–66 CrossRef.
- D. Bonn, J. Eggers, J. Indekeu, J. Meunier and E. Rolley, Wetting and spreading, Rev. Mod. Phys., 2009, 81, 739 CrossRef.
- D. Langevin, Surfactants, in The Oxford Handbook of Soft Condensed Matter, ed. E. M. Terentjev and D. A. Weitz, Oxford University Press, USA, 2015, pp. 51–93 Search PubMed.
- K. A. Brakke, The Surface Evolver, Exp. Math., 1992, 1, 141–165 CrossRef . Software free to download from http://facstaff.susqu.edu/brakke/evolver/evolver.html.
- H. M. Princen and S. G. Mason, Shape of a fluid drop at a fluid-liquid interface. I. Extension and test of two-phase theory, J. Colloid Interface Sci., 1965, 20(2), 156–172 CrossRef.
- H. M. Princen, Contact angles and transition regions in soap films, J. Phys. Chem., 1968, 72(9), 3342–3345 CrossRef.
- R. Aveyard, B. P. Binks, J. Esquena, P. D. I. Fletcher, R. Buscall and S. Davies, Flocculation of weakly charged oil–water emulsions, Langmuir, 1999, 15(4), 970–980 CrossRef.
- H. M. Princen, Osmotic pressure of foams and highly concentrated emulsions. I. Theoretical considerations, Langmuir, 1986, 2(4), 519–524 CrossRef.
- S. Hutzler and D. Weaire, The osmotic pressure of a two-dimensional disordered foam, J. Phys.: Condens. Matter, 1995, 7(47), L657 CrossRef.
- A. Abd el Kader and J. C. Earnshaw, Stability of two-dimensional foam, Philos. Mag. A, 1997, 76(6), 1251–1260 Search PubMed.
- A. M. Kraynik, D. A. Reinelt and F. van Swol, Structure of random foam, Phys. Rev. Lett., 2004, 93, 208301 CrossRef PubMed.
- C. Kuo, A. Levine and M. Dennin, Bubble Ribbons under Imposed Flow, Colloids Surf., A, 2017, 534, 38–43 CrossRef.
- J. Bibette, T. G. Mason, H. Gang, D. A. Weitz and P. Poulin, Structure of adhesive emulsions, Langmuir, 1993, 9(12), 3352–3356 CrossRef.
- R. Aveyard, B. P. Binks, J. Esquena, P. D. I. Fletcher, P. Bault and P. Villa, Flocculation transitions of weakly charged oil-in-water emulsions stabilized by different surfactants, Langmuir, 2002, 18(9), 3487–3494 CrossRef.
- F. F. Dunne, F. Bolton, D. Weaire and S. Hutzler, Statistics and topological changes in 2d foam from the dry to the wet limit, Philos. Mag., 2017, 97, 1768–1781 CrossRef.
- K. A. Brakke, Statistics of non-Poisson point processes in several dimensions, 2006, http://facstaff.susqu.edu/brakke/aux/downloads/papers/nonpoisson.pdf.
Footnotes |
| † Electronic supplementary information (ESI) available. See DOI: 10.1039/c8sm00739j |
| ‡ Princen7 describes his calculation in terms of the deformation of columns of hypothetical cylindrical emulsion drops. We have re-written his expression in terms of liquid fraction ϕ, rather than gas fraction (1 − ϕ), and corrected one misprint (missing superscript θ in his eqn (35)). |
| This journal is © The Royal Society of Chemistry 2018 |

