 Open Access Article
Creative Commons Attribution 3.0 Unported Licence
Equally probable positive and negative Poisson's ratios in disordered planar systems
Christophe M.
Verstreken
 ab,
Kevin J.
Chalut
ab and
Raphael
Blumenfeld
*ac
aCavendish Laboratory, Department of Physics, University of Cambridge, Cambridge CB3 0HE, UK. E-mail: rbb11@cam.ac.uk
bWellcome Trust/Medical Research Council Cambridge Stem Cell Research Institute, University of Cambridge, Tennis Court Road, Cambridge, CB2 1QR, UK
cImperial College London, London SW7 2BP, UK
First published on 27th July 2018
Abstract
Auxetic materials, characterised by a negative Poisson's ratio, have properties that are different from most conventional materials. These are a result of the constraints on the kinematics of the material's basic structural components, and have important technological implications. Models of these materials have been studied extensively, but theoretical descriptions have remained largely limited to materials with an ordered microstructure. Here we investigate whether negative Poisson's ratios can arise spontaneously in disordered systems. To this end, we develop a quantitative description of the structure in systems of connected basic elements, which enables us to analyse the local and global responses to small external tensile forces. We find that the Poisson's ratios in these disordered systems are equally likely to be positive or negative on both the element and system scales. Separating the strain into translational, rotational and expansive components, we find that the translational strains of neighbouring basic structural elements are positively correlated, while their rotations are negatively correlated. There is no correlation in this type of system between the local auxeticity and local structural characteristics. Our results suggest that auxeticity is more common in disordered structures than the ubiquity of positive Poisson's ratios in macroscopic materials would suggest.
1 Introduction
Materials with a negative Poisson's ratio (PR), called auxetics, have positively correlated horizontal and vertical strains, and thus expand (contract) in both directions when stretched (compressed).1 Various such materials can be found in nature, including polymers, foams, minerals, and even nuclei of stem cells.2,3 A range of auxetic structures has also been made artificially.4,5 Auxetic behaviour in disordered materials is not uncommon; for example, a crumpled ball of paper expands in all directions when stretched between two fingers. Yet, most investigations of the relation between internal structural characteristics and large scale auxeticity have focused on ordered systems.6–13 As such, few studies exist of auxeticity in disordered systems, including behaviour of three-dimensional folded sheets14,15 and perturbing slightly ordered structures by defects.16,17 Thus, auxeticity of disordered structures is still far from fully understood.We address this problem by modelling auxeticity in isostatic structures that consist of minimally connected constituent units that can freely fold, expand and contract.18,19 Isostatic systems are statistically determinate—a particularly convenient property for our purposes, as we can relate the stress to the local microstructure by calculating the inter-element forces directly, without requiring elasticity theory. This feature also makes these structures ideal for modelling the jamming transition in systems in which the elements are macroscopic grains or colloids. We use arrangements of isostatic systems to analyse random disordered isostatic systems, and investigate the microscopic drivers of auxeticity on the local and global scales.
To be isostatic, a mechanically stable structure has only to satisfy a minimal connectivity criterion: that the mean number of force-carrying inter-element contacts per element is equal to a specific value zc.20 Generically, zc = d(d + 1) and d + 1 for d-dimensional systems of frictionless and frictional non-spherical elements, respectively.21 Analysis of stress transmission in these materials explains the ubiquity of non-uniform stress states exhibited by particulate media.22–25 A first-principles continuum stress theory for two-dimensional isostatic granular media has been developed, based on a parameterisation of the inter-element forces into ‘loop forces’, where loops are the elementary voids, or cells, enclosed by individual elements.26,27
Since zc = 3 in two dimensions, we choose to focus on planar systems of triangles, connected to nearest neighbours at the vertices by conceptual frictionless hinges, as illustrated in Fig. 1. For later use, we assign a direction to the edges of each triangle, t, making it a vector, ![[r with combining right harpoon above (vector)]](https://www.rsc.org/images/entities/i_char_0072_20d1.gif) ct, with c being the cell that the edge borders. Thus defined, these vectors circulate clockwise around the triangles.26 For each
ct, with c being the cell that the edge borders. Thus defined, these vectors circulate clockwise around the triangles.26 For each ![[r with combining right harpoon above (vector)]](https://www.rsc.org/images/entities/i_char_0072_20d1.gif) ct, we define a dual vector
ct, we define a dual vector ![[R with combining right harpoon above (vector)]](https://www.rsc.org/images/entities/i_char_0052_20d1.gif) ct, extending from the centroid of triangle t to the centroid of cell c. These two vectors form the diagonals of a quadrilateral, known as a quadron.28 The quadrons are fundamental volume elements that tessellate the system space perfectly. Moreover, the structure of each quadron can be quantified unambiguously by a local structural tensor,
ct, extending from the centroid of triangle t to the centroid of cell c. These two vectors form the diagonals of a quadrilateral, known as a quadron.28 The quadrons are fundamental volume elements that tessellate the system space perfectly. Moreover, the structure of each quadron can be quantified unambiguously by a local structural tensor, ![[r with combining right harpoon above (vector)]](https://www.rsc.org/images/entities/i_char_0072_20d1.gif) ct⊗
ct⊗![[R with combining right harpoon above (vector)]](https://www.rsc.org/images/entities/i_char_0052_20d1.gif) ct, allowing us to quantify the local disordered structure anywhere in the system.26,28,29 This is convenient for relating local structural characteristics to local PR.
ct, allowing us to quantify the local disordered structure anywhere in the system.26,28,29 This is convenient for relating local structural characteristics to local PR.
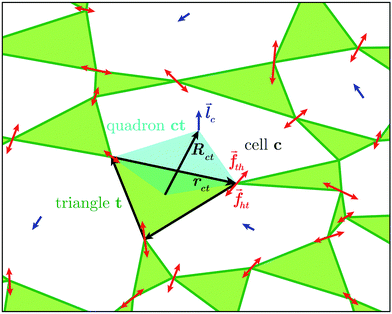 | ||
Fig. 1 Close-up view of individual triangles in our system. The edges of triangle t are made into vectors, ![[r with combining right harpoon above (vector)]](https://www.rsc.org/images/entities/i_char_0072_20d1.gif) ct, that circulate the triangle clockwise. These vectors make a disordered graph of randomly shaped triangles, connected to their nearest neighbours at the vertices. The vector ct, that circulate the triangle clockwise. These vectors make a disordered graph of randomly shaped triangles, connected to their nearest neighbours at the vertices. The vector ![[R with combining right harpoon above (vector)]](https://www.rsc.org/images/entities/i_char_0052_20d1.gif) ct extends between the centroid of triangle t and that of its neighbouring cell, c. The vectors ct extends between the centroid of triangle t and that of its neighbouring cell, c. The vectors ![[r with combining right harpoon above (vector)]](https://www.rsc.org/images/entities/i_char_0072_20d1.gif) ct and ct and ![[R with combining right harpoon above (vector)]](https://www.rsc.org/images/entities/i_char_0052_20d1.gif) ct are the diagonals of a quadrilateral volume element, which is called quadron.29 Inter-triangle forces (red) are calculated as the difference between the loop forces ct are the diagonals of a quadrilateral volume element, which is called quadron.29 Inter-triangle forces (red) are calculated as the difference between the loop forces ![[l with combining right harpoon above (vector)]](https://www.rsc.org/images/entities/i_char_006c_20d1.gif) c (blue) of neighbouring cells. c (blue) of neighbouring cells. | ||
In mechanical equilibrium, the forces of triangles on their neighbours (inter-triangle forces or ITFs), can be parametrised using loop forces, with one loop force ![[l with combining right harpoon above (vector)]](https://www.rsc.org/images/entities/i_char_006c_20d1.gif) per cell enclosed by triangles. As such, the force that triangle t exerts on its neighbour t′ is the difference between the loop forces of the two cells, c and c′, straddling the common joint of these triangles26 (see Fig. 1):
per cell enclosed by triangles. As such, the force that triangle t exerts on its neighbour t′ is the difference between the loop forces of the two cells, c and c′, straddling the common joint of these triangles26 (see Fig. 1):
![[f with combining right harpoon above (vector)]](https://www.rsc.org/images/entities/i_char_0066_20d1.gif) tt′ = tt′ = ![[l with combining right harpoon above (vector)]](https://www.rsc.org/images/entities/i_char_006c_20d1.gif) c′ − c′ − ![[l with combining right harpoon above (vector)]](https://www.rsc.org/images/entities/i_char_006c_20d1.gif) c c | (1) |
By calculating the fabric tensor, the quantitative description of the local structure of our isostatic systems can be coarse-grained to the overall system.26,27,30 Furthermore, the fabric tensor is related to local rotational strains,31 and can be used to identify and isolate rotational strains in auxetic materials.18,19 In this paper, we extend this latter development and apply it to random systems.
2 Theory
We first determine the number of equations required to calculate the inter-triangular forces in a disordered planar system consisting of N (≫1) triangles. The contours of the triangles form a graph of Nv connected vertices, Ne edges, and Nf faces. Identifying the Nb boundary triangles in this structure, it is convenient for the purpose of our analysis to enclose this graph within a frame to which the boundary triangles are connected by one of their vertices. For such a graph, Euler's topological relation for two-dimensional graphs in the plane is,32| Nv − Ne + Nf = 1, | (2) |
In our graph, the vertices are the analogues of the contact points in granular assemblies. The edges are the triangle edges and the additional Nb edges formed by the frame. The faces consist of the triangle faces and the internal elementary voids (called cells or loops here), which include the additional Nb voids formed by the frame. Putting these numbers together, we have: Nf = Nc + N + Nb faces, (the Nc internal cells, the N loops around each triangle and the Nb boundary cells), Ne = 3N + Nb, and Nv = (3N + Nb)/2. Substituting these into Euler's relation (2), we have
 | (3) |
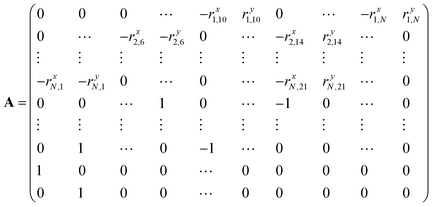
Specifically, we can define the following N × N matrix A, loop forces vector X, and boundary forces vector B.33 As before, the first N rows correspond to the torque balance on all N triangles, the next Nb rows correspond to the boundary forces on Nb/2 vertices, and the final 2 rows normalise the 2 force components of the first loop force:
 | (4) |
 | (5) |
 | (6) |
| Ax = B | (7) |
3 Model and methods
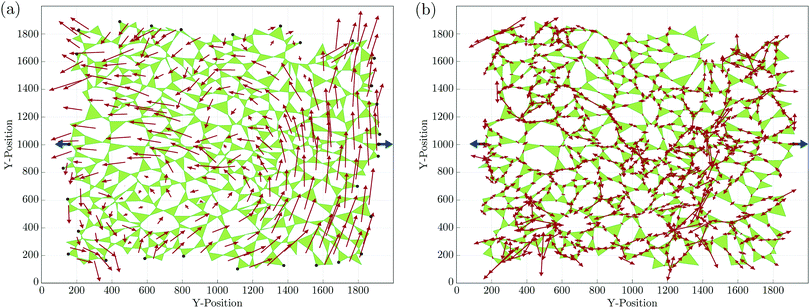
We generated numerically 15![[thin space (1/6-em)]](https://www.rsc.org/images/entities/char_2009.gif) 000 disordered planar assemblies of triangles as model systems. First, we distributed 200 points randomly within a rectangle of 2000 × 2000 in arbitrary units. We then generated a Voronoi tessellation around the points of the system, obtaining a planar cellular structure, with exactly three edges emanating from each node. Connecting the midpoints of these edges around each node produces a disordered assembly containing about 300 triangles in each system. With exactly 3 = d + 1 contacts per triangle, we made this system isostatic by imposing one force on every other boundary triangle vertex. We then used (7) to calculate the loop forces (see, e.g.Fig. 2a) and, from those, the ITFs by (1). Typically, the solutions contain regions in which the loop forces have smoothly-changing directional orientation, separated by sharp gradients, as illustrated on the right side of Fig. 2a. The sharp gradients correspond to localised force chains.26,27,34,35 These force chains can be observed experimentally in granular systems.36–38
000 disordered planar assemblies of triangles as model systems. First, we distributed 200 points randomly within a rectangle of 2000 × 2000 in arbitrary units. We then generated a Voronoi tessellation around the points of the system, obtaining a planar cellular structure, with exactly three edges emanating from each node. Connecting the midpoints of these edges around each node produces a disordered assembly containing about 300 triangles in each system. With exactly 3 = d + 1 contacts per triangle, we made this system isostatic by imposing one force on every other boundary triangle vertex. We then used (7) to calculate the loop forces (see, e.g.Fig. 2a) and, from those, the ITFs by (1). Typically, the solutions contain regions in which the loop forces have smoothly-changing directional orientation, separated by sharp gradients, as illustrated on the right side of Fig. 2a. The sharp gradients correspond to localised force chains.26,27,34,35 These force chains can be observed experimentally in granular systems.36–38
Starting from the initial stress state, we calculated the mean force amplitude at a vertex for each system, ![[f with combining macron]](https://www.rsc.org/images/entities/i_char_0066_0304.gif) , and applied two equal and opposite small tensile forces, of amplitude about δf = 1 × 10⁻³
, and applied two equal and opposite small tensile forces, of amplitude about δf = 1 × 10⁻³![[f with combining macron]](https://www.rsc.org/images/entities/i_char_0066_0304.gif) , antipodally on the left and right boundaries, along the x-axis near the middle of the system (shown as blue forces in Fig. 2). We then calculated the changes in the loop forces and the ITFs.
, antipodally on the left and right boundaries, along the x-axis near the middle of the system (shown as blue forces in Fig. 2). We then calculated the changes in the loop forces and the ITFs.
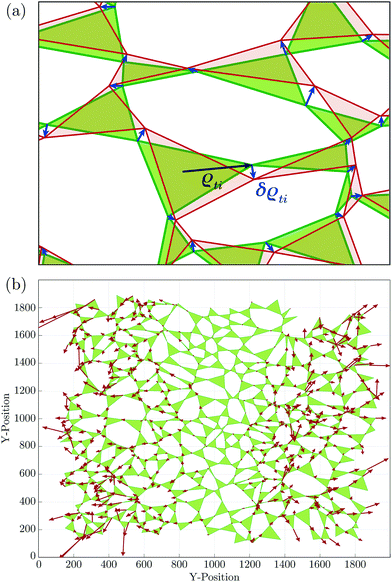
The changes in the ITFs give rise to vertex displacements, resulting in triangle rotations, translations and expansions (or contractions), such that the triangle edges remain straight. It should be noted that the static determinacy constrains all the degrees of freedom and, therefore, the vertex displacements are only the result of the triangles’ elastic compliance. In the absence of inertial effects, each vertex's displacement is proportional to the force on it, and we expect vertices to displace towards the external tensile force it is closest to. This divides the system naturally into two halves with an imaginary half-line at x = 0. The vertex's displacement is then in the direction of the force pulling toward the closest boundary, scaled by a proportionality factor ζ that is 0 on the half-line and 1 on the corresponding boundary. A typical example of a displacement field is shown in Fig. 3a.
The displacements data were then recorded for later analysis, increased the magnitudes of the boundary tensile forces, calculate the new ITFs, and repeated the process. The accumulated displacements resulting from 100 successive repetitions of the process are shown in Fig. 3b.
In the following, we refer to the gradient of the displacement as strain, for short, although this term is normally reserved for its symmetric part. The strain can be defined for individual triangles and can be separated into a translational, an expansive and a rotational component:
| εt = εtranst + εexpt + εrott. | (8) |
The translational strain captures the displacements of the triangles’ centres of mass and it is defined as
 | (9) |
![[R with combining right harpoon above (vector)]](https://www.rsc.org/images/entities/i_char_0052_20d1.gif) t is the vector from the origin to the centroid of triangle t,
t is the vector from the origin to the centroid of triangle t, ![[R with combining right harpoon above (vector)]](https://www.rsc.org/images/entities/i_char_0052_20d1.gif) 0 is the position of the entire system's centre of mass, and δ
0 is the position of the entire system's centre of mass, and δ![[R with combining right harpoon above (vector)]](https://www.rsc.org/images/entities/i_char_0052_20d1.gif) is the mean displacement of the vertices of t. The expansive component of the strain depends on the outward or inward displacements of the vertices of the triangle, projected on the vector ρti
is the mean displacement of the vertices of t. The expansive component of the strain depends on the outward or inward displacements of the vertices of the triangle, projected on the vector ρti | (10) |
 | (11) |
Each triangle hosts exactly three quadrons, as shown in Fig. 1, each described by a structure tensor Cct = ![[r with combining right harpoon above (vector)]](https://www.rsc.org/images/entities/i_char_0072_20d1.gif) ct⊗
ct⊗![[R with combining right harpoon above (vector)]](https://www.rsc.org/images/entities/i_char_0052_20d1.gif) ct.28 The triangle's structure tensor is the sum of the structure tensors of its three quadrons:
ct.28 The triangle's structure tensor is the sum of the structure tensors of its three quadrons:
 | (12) |
 | (13) |
 | (14) |
 | (15) |
 | (16) |
 | (17) |
 | (18) |
4 Results
Defining the PR of triangle t as| νt = εt,yy/εt,xx, | (19) |
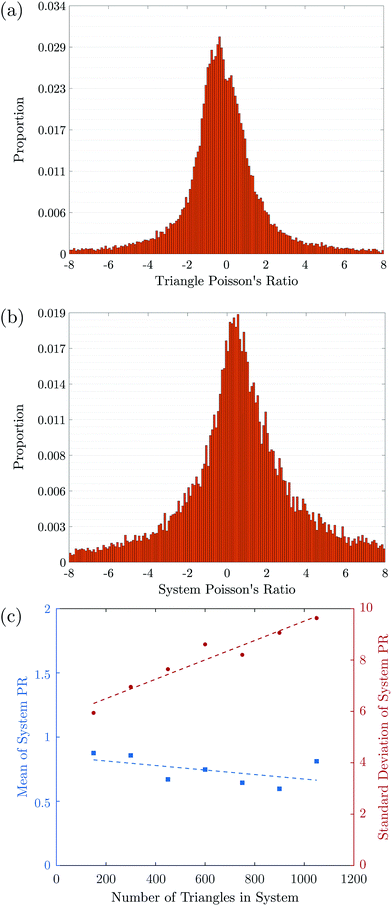
In Fig. 4a, we plot a histogram of the local PRs for data collected from over 40![[thin space (1/6-em)]](https://www.rsc.org/images/entities/char_2009.gif) 000 triangles from 100 different system realisations. It is broadly symmetric, with the mean and standard deviation being −0.2 and 1.8, respectively, demonstrating that there is hardly any sign preference for the local PRs.
000 triangles from 100 different system realisations. It is broadly symmetric, with the mean and standard deviation being −0.2 and 1.8, respectively, demonstrating that there is hardly any sign preference for the local PRs.
We also computed the global PR of each system, defined as
 | (20) |
![[thin space (1/6-em)]](https://www.rsc.org/images/entities/char_2009.gif) 000 systems of 300 triangles each. This histogram is also symmetric, with its mean and standard deviation 0.9 and 7.0, respectively. Interestingly, this histogram's standard deviation is much larger than for the individual triangles, which is a result of its tails falling slower than exponential, although faster than algebraically.
000 systems of 300 triangles each. This histogram is also symmetric, with its mean and standard deviation 0.9 and 7.0, respectively. Interestingly, this histogram's standard deviation is much larger than for the individual triangles, which is a result of its tails falling slower than exponential, although faster than algebraically.
To examine the dependence of these results on system size, we repeated the simulations for systems of sizes ranging from N = 150 to N = 1050 triangles each. We find that the distributions’ standard deviations are an order of magnitude larger than their means and are broadly symmetric around 0, as can be observed in Fig. 4. Zooming in on the means and standard deviations of the global PR distributions over the 7-fold size variation, we observe that the mean decreases slightly with N, from 0.82 to 0.66. This decrease is not statistically significant and is also consistent with no change within 95% confidence. In contrast, the standard deviation increases significantly with size by about 53%, from 6.31 to 9.70, indicating, with 95% confidence, that the width of the PR value distribution increases proportionally to N.
To gain insight into the relationship between the Poisson's ratio and the local structure, we investigated the local correlations between structural, elastic and strain properties, with the structural characteristics quantified using the above quadron description. To this end, we first express the stress on triangle t in terms of the loop forces of the cells surrounding it.26 The increase in the boundary forces gives rise to the following change in the stress
 | (21) |
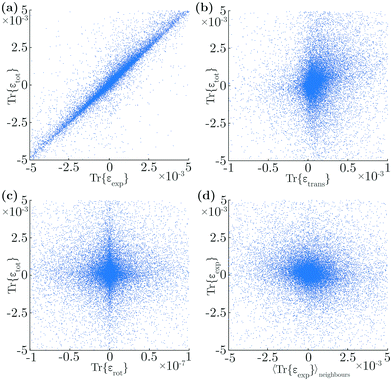
In particular, we correlated the traces of the different strain components of individual triangles with the trace of that triangle's total strain, for 100 systems and 3 × 10⁴ triangles. Irrelevant outliers, within the 2% highest and lowest strains, were disregarded. We find that the expansive component is the dominant contributor to the symmetric part of the strain, with a correlation of γ = 0.93 between Tr{εexpt} and Tr{εtott} (Fig. 5a). The second largest contributor is the translational strain, with a correlation of γ = 0.24 between Tr{εtranst} and Tr{εtott} (Fig. 5b). In contrast, there is hardly any correlation between the rotational component and the total strain, γ = 0.03 (Fig. 5c). As expected, the importance of expansion in the overall strain of individual triangles causes a negative correlation of γ = −0.10 between the expansive strains of neighbouring triangles (Fig. 5d). The translational strains of neighbours are positively correlated, with γ = 0.67, which is induced by our method of determining vortex displacements. Interestingly, while the rotational strain does not correlate well between nearest neighbours, with γ = −0.06, the rotation angle of neighbours is anti-correlated, with γ = −0.35, which is an aspect of the ‘anti-ferromagnetic’-like rotational nature of such systems.11,31,39–41
We also investigated the correlations between the one-triangle PR and local structural characteristics, including the triangle: size, shape, quadron sizes, displacement, and any of the strain contributors. We found no significant correlation between any of these quantities.
5 Conclusions and discussion
We studied the poorly understood issue of auxetic behaviour in disordered structures, modelled here by planar statically determinate, or isostatic, systems of triangular elements. Specifically, we addressed the question of whether a negative Poisson ratio (PR) can emerge spontaneously without design or whether a positive PR is more common, as its ubiquity in macroscopic materials might suggest.We simulated 15![[thin space (1/6-em)]](https://www.rsc.org/images/entities/char_2009.gif) 000 disordered planar systems, each of about 300 randomly-shaped connected compliant triangles, stretched them incrementally, and computed the PR for each triangle and for the entire assembly. Our main finding is that positive and negative PRs are almost equally likely to occur in such disordered systems. This conclusion holds on both the triangle scale (Fig. 4a) and the entire system (Fig. 4b). This suggests that large-scale systems with this layout would be almost PR-neutral, displaying a behaviour that is neither conventionally elastic nor fully auxetic. This result may seem counter-intuitive in view of the prevalence of positive PRs in macroscopic structures. However, it reinforces that these are not conventional elastic systems and that PR of such structures should be carefully analysed.
000 disordered planar systems, each of about 300 randomly-shaped connected compliant triangles, stretched them incrementally, and computed the PR for each triangle and for the entire assembly. Our main finding is that positive and negative PRs are almost equally likely to occur in such disordered systems. This conclusion holds on both the triangle scale (Fig. 4a) and the entire system (Fig. 4b). This suggests that large-scale systems with this layout would be almost PR-neutral, displaying a behaviour that is neither conventionally elastic nor fully auxetic. This result may seem counter-intuitive in view of the prevalence of positive PRs in macroscopic structures. However, it reinforces that these are not conventional elastic systems and that PR of such structures should be carefully analysed.
The mean contributions of the translational, expansive and rotational strains to the total strain of a triangle were found to be 23.2 ± 0.05%, 77.3 ± 0.05% and 0.0 ± 0.05%, respectively. The corresponding correlations between those and a triangle's total strain were 0.24 ± 0.005, 0.93 ± 0.005, and 0.03 ± 0.005, respectively. We also found a significant anti-correlation of −0.10 between the expansive strains of neighbouring triangles, as well as a considerable anti-correlation of −0.35 between their rotations. The latter is directly related to antiferromagnetic-like rotational dynamics in such systems, discussed in granular systems.31,39–41 We emphasise that, by imposing static determinacy, we constrained movement in our systems and, had the triangles been rigid, they would have no degrees of freedom to deploy and not displace. Thus, the displacements we observe arise from local expansions and contractions, which fits well with the correlations we observe.
We also searched for correlations between the sign of the PR and local microstructural descriptors. Such correlations, if found, could lead to informed design of auxetic disordered structures. However, we found none in this study. It is possible that such correlations have been washed out by the strong anti-correlation between nearest-neighbour expansive strains. To study this issue in more depth, a similar study should be carried out on systems of fully rigid triangles9 with fewer boundary constraints. We conjecture that such systems would show stronger correlations between the local PR and the translational and rotational strains. The latter is directly related to the local structural rotational disorder, defined in ref. 26 and 27 as the symmetric part of the local tensor Qt(![[r with combining right harpoon above (vector)]](https://www.rsc.org/images/entities/i_char_0072_20d1.gif) ) and we therefore expect that such systems would show local structure–PR correlations.
) and we therefore expect that such systems would show local structure–PR correlations.
Conflicts of interest
There are no conflicts to declare.Acknowledgements
This work was supported by the Engineering and Physical Sciences Research Council (1506089) (C. M. V.), and the UK Medical Research Council and Wellcome Trust (K. J. C.).References
- R. S. Lakes, Science, 1987, 235, 1038–1040 CrossRef PubMed.
- S. Pagliara, K. Franze, C. R. McClain, G. W. Wylde, C. L. Fisher, R. J. M. Franklin, A. J. Kabla, U. F. Keyser and K. J. Chalut, Nat. Mater., 2014, 13, 638–644 CrossRef PubMed.
- A. C. Hodgson, C. M. Verstreken, C. L. Fisher, U. F. Keyser, S. Pagliara and K. J. Chalut, Lab Chip, 2017, 17, 805–813 RSC.
- A. Alderson and K. L. Alderson, Proc. Inst. Mech. Eng., Part G, 2007, 221, 565–575 CrossRef.
- J. N. Grima, D. Attard, R. Gatt and R. N. Cassar, Adv. Eng. Mater., 2009, 11, 533–535 CrossRef.
- K. E. Evans, Endeavour, 1991, 15, 170–174 CrossRef.
- D. R. Reid, N. Pashine, J. M. Wozniak, H. M. Jaeger, A. J. Liu, S. R. Nagel and J. J. de Pablo, Proc. Natl. Acad. Sci. U. S. A., 2018, 115, E1384–E1390 CrossRef PubMed.
- J. N. Grima and K. E. Evans, J. Mater. Sci. Lett., 2000, 19, 1563–1565 CrossRef.
- J. N. Grima, A. Alderson and K. E. Evans, Phys. Status Solidi B, 2005, 242, 561–575 CrossRef.
- J. N. Grima, P. S. Farrugia, C. Caruana, R. Gatt and D. Attard, J. Mater. Sci., 2008, 43, 5962 CrossRef.
- J. N. Grima and K. E. Evans, J. Mater. Sci., 2006, 41, 3193–3196 CrossRef.
- D. Attard, E. Manicaro and J. N. Grima, Phys. Status Solidi B, 2009, 246, 2033–2044 CrossRef.
- R. Gatt, L. Mizzi, J. I. Azzopardi, K. M. Azzopardi, D. Attard, A. Casha, J. Briffa and J. N. Grima, Sci. Rep., 2015, 5, 8395 CrossRef PubMed.
- A. S. Balankin, D. S. Ochoa, E. P. León, R. C. M. de Oca, A. H. Rangel and M. A. M. Cruz, Phys. Rev. B: Condens. Matter Mater. Phys., 2008, 77, 125421 CrossRef.
- O. Bouaziz, J. Masse, S. Allain, L. Orgéas and P. Latil, Mater. Sci. Eng., A, 2013, 570, 1–7 CrossRef.
- J. N. Grima, S. Winczewski, L. Mizzi, M. C. Grech, R. Cauchi, R. Gatt, D. Attard, K. W. Wojciechowski and J. Rybicki, Adv. Mater., 2015, 27, 1455–1459 CrossRef PubMed.
- T. Mukhopadhyay and S. Adhikari, Mech. Mater., 2016, 95, 204–222 CrossRef.
- R. Blumenfeld, Mol. Simul., 2005, 31, 867–871 CrossRef.
- R. Blumenfeld and S. F. Edwards, J. Supercond. Novel Magn., 2012, 25, 565–571 CrossRef.
- J. C. Maxwell, Philos. Mag., 1864, 27, 294–299 Search PubMed.
- R. C. Ball and D. V. Grinev, Phys. A, 2001, 292, 167–174 CrossRef.
- J. P. Wittmer, P. Claudin, M. E. Cates and J.-P. Bouchaud, Nature, 1996, 382, 336–338 CrossRef.
- J. P. Wittmer, M. E. Cates and P. Claudin, J. Phys. I, 1997, 7, 39–80 CrossRef.
- M. E. Cates, J. P. Wittmer, J.-P. Bouchaud and P. Claudin, Phys. Rev. Lett., 1998, 81, 1841–1844 CrossRef.
- R. Blumenfeld, S. F. Edwards and S. M. Walley, Granular Systems, The Oxford Handbook of Soft Condensed Matter, 2016, ch. 5, pp. 167–222 Search PubMed.
- R. C. Ball and R. Blumenfeld, Phys. Rev. Lett., 2002, 88, 115505 CrossRef PubMed.
- R. Blumenfeld, Phys. Rev. Lett., 2004, 93, 108301 CrossRef PubMed.
- R. Blumenfeld and S. F. Edwards, Phys. Rev. Lett., 2003, 90, 114303 CrossRef PubMed.
- R. Blumenfeld and S. F. Edwards, Eur. Phys. J. E: Soft Matter Biol. Phys., 2006, 19, 23–30 CrossRef PubMed.
- M. Gerritsen, G. Kreiss and R. Blumenfeld, Phys. Rev. Lett., 2008, 101, 098001 CrossRef PubMed.
- R. C. Ball and R. Blumenfeld, Philos. Trans. R. Soc. London, Ser. A, 2003, 361, 731 CrossRef PubMed.
- H. S. M. Coxeter, Regular Polytopes, Dover Publications, New York, 3rd edn, 1973, p. 368 Search PubMed.
- G. Camisasca, MSc thesis, University of Cambridge, 2013.
- J.-P. Bouchaud, P. Claudin, D. Levine and M. Otto, Eur. Phys. J. E: Soft Matter Biol. Phys., 2001, 4, 451–457 CrossRef.
- R. Blumenfeld, New J. Phys., 2007, 9, 160 CrossRef.
- R. P. Seelig and J. Wulff, Trans. Am. Inst. Min., Metall. Pet. Eng., 1946, 166, 492–504 Search PubMed.
- T. Wakabayashi, Proc. 7th Jpn. Nat. Cong. Appl. Mech., 1957, 153 Search PubMed.
- C. h. Liu, S. R. Nagel, D. A. Schecter, S. N. Coppersmith, S. Majumdar, O. Narayan and T. A. Witten, Science, 1995, 269, 513–515 CrossRef PubMed.
- R. Blumenfeld, S. F. Edwards and M. Schwartz, Eur. Phys. J. E: Soft Matter Biol. Phys., 2010, 32, 333–338 CrossRef PubMed.
- R. M. Baram, H. J. Herrmann and N. Rivier, Phys. Rev. Lett., 2004, 92, 044301 CrossRef PubMed.
- R. Blumenfeld and S. F. Edwards, J. Phys. Chem. B, 2009, 113, 3981–3987 CrossRef PubMed.
| This journal is © The Royal Society of Chemistry 2018 |

![[small rho, Greek, vector]](https://www.rsc.org/images/entities/i_char_e137.gif)
![[small sigma, Greek, macron]](https://www.rsc.org/images/entities/i_char_e0d2.gif)
