 Open Access Article
Rupture of granular rafts: effects of particle mobility and polydispersity†
Carole
Planchette
 *a,
Elise
Lorenceau
b and
Anne-Laure
Biance
 c
c
aInstitute of Fluid Mechanics and Heat Transfer, Graz University of Technology, Inffeldgasse 25/F, 8010 Graz, Austria. E-mail: carole.planchette@tugraz.at
bLaboratoire Interdisciplinaire de Physique, Université Grenoble Alpes, 140 Av. de la physique, 38058 Grenoble, France
cInstitut Lumière Matière, Université Claude Bernard Lyon 1, 10 rue Ada Byron, 69622 Villeurbanne, France
First published on 12th June 2018
Abstract
Reversible encapsulation of liquid materials is a technical challenge in many applications such as for the transport and controlled delivery of active ingredients. In contrast to most state-of-the-art processes, capillary adsorbed solid particles can achieve chemical-reaction-free encapsulation by forming dense rafts which isolate the liquid from its surroundings. While the production conditions of such capsules have been characterized, the control of the armor robustness remains poorly described and understood. In this paper, we probe the armor robustness via impacts of droplets on encapsulated materials. Thereby, we establish the mechanisms and conditions of armor rupture and derive models that predict the rupturing thresholds or probabilities. Using monodisperse sized particles and gradually increasing the impacting drop velocity, a sharp transition from sustained to coalescing drops is observed. On mobile rafts made of particles at the water/air interface, the velocity threshold increases with increasing particle diameter while an opposite trend is observed on immobile rafts made of particles trapped at a gelified interface. Two models based on particle pair and triplet interactions, respectively, quantitatively match the experiments. Assembling rafts with particles of two different sizes significantly smoothens the coalescence transition, regardless of particle mobility. Beyond apparent similarities, rationalizing the rupturing probability of mobile and immobile armor evidences very different sensitivity to heterogeneities. On immobile armor, drop coalescence remains random and thus well described by the statistical particle distribution while on mobile armor the ruptures are preferably localized at the non-percolated parts of the granular network.
1 Introduction
Dense assemblies of particles adsorbed at liquid interfaces are commonly found in nature where they are used as armor to prevent fatal contact with the liquid bulk. For example, galling aphids, insects that feed from plant sap, wrap their liquid waste into waxy hydrophobic particles they excrete. The synthesized particles create a barrier at the sticky waste interface and prevent smaller individuals getting trapped in it.1 Reciprocally, the diving bell spider which lives under water fabricates silky fibers to cover a protecting air bubble, so it can dive without suffocating by staying inside.2 This armor is not only found around drops or bubbles but can be built on flat interfaces extending over several meters. Indeed, fire ants which live in areas subjected to frequent flooding are able to assemble at the water interface and make use of capillary interactions between them to form rafts preventing individuals from sinking.3 The raft can accommodate the whole colony during days or weeks till the drifted assembly reaches some earth again. The stabilization of liquid interfaces by particles is also well known and widely used in industrial applications. Their usage includes drop and bubble stabilization as well as assemblies of them to create Pickering emulsions, ultra-stable foams, dry water, or bijels.4–6 In some cases, this armor is not desirable. Rain drops that impact a sandy partly hydrophobic soil get covered by sand grains preventing rain drainage and eroding the soil. Similarly, such phenomena must be minimized during fertilizer or pesticide spraying. In other applications such as in flotation or wet granulation7,8 the armor that forms around bubbles or drops is desired only during certain process phases or under certain process conditions. Thus, describing and predicting the robustness of such armor is essential to the understanding of its natural occurrence and to the optimization of its industrial usage.To date, an impressive theoretical framework9 has been put in place to understand the local mechanism(s) leading to coalescence. Yet, several points remain unknown.
First, using coated drops, also called liquid marbles, Aussillous et al. show that the armor ruptures when reaching a critical extension for which a hole(s) opens between the grains.10 The quasi-static critical extension obtained by compressing a marble between two plates,11 0.66, is very similar to the dynamic one, 0.65, measured via marble impacts onto solid surfaces.12 Thus, the influence of the particle mobility and associated kinetics of the armor robustness appears secondary. Yet, liquid marble impacts onto glass plates and paraffin coated plates12 showed that the nature of the surface affects the rupture transition. However, it was not possible to demonstrate whether this was due to a change of particle mobility resulting from different particle/substrate interactions or not. In the same study, it was observed that smaller particles tend to form only a few fractures in an otherwise densely packed assembly while larger particles seemed to distribute homogeneously at the free interface. Particle interactions of different magnitudes may explain this observation but surprisingly, the particle size did not significantly affect the rupture transition.
The robustness of flat liquid interfaces has also been studied. Zuo et al.13 probed the maximal load of nanoparticle rafts applying quasi-statically a pressure via a solid rod, raising issues caused by the presence of the large solid surface. Fractures driven by a local gradient of surface tension have been observed.14 The kinetics is rather fixed by the advection of the surfactant, itself limited by the viscous boundary layer that develops around the fracture. Interestingly, fracture branching and kinking appeared to be mostly driven by raft heterogeneity and not by inertial effects alone. Another origin of armor failures is the destabilization of buoyant rafts. This destabilization can be local as reported for buoyant Pickering emulsion drops with the ejection of single isolated particles15,16 or collective as seen for flat rafts with the formation of a particle coated drop or particle coated jet that sinks into the liquid pool.17 These two competing destabilization mechanisms, identified numerically,18,19 rely respectively on the removal of a keystone particle caused by the excessive weight of the particles resting on it and on the sinking of the raft as a block caused by insufficient capillary stabilization at its periphery. The latter scenario, which has been recently proposed as a strategy to collect, encapsulate and sink liquid pollutants spreading at the surface of the sea, is preferably observed when the contact angle is close to 90°![[thin space (1/6-em)]](https://www.rsc.org/images/entities/char_2009.gif) 19 or when the particles strongly pin the contact line,17 as observed when using rough irregular sand grains for example. The transition between these mechanisms was attributed to an increase of particle adsorption energy – all things staying equal – or by the ability of a particle to move out of the interface.20 Investigating armored bubbles, Taccoen et al. show that the latter may cause local dislocations with mechanical consequences at the entire armor scale.21 Inter-particle interactions are also expected to influence the selection of destabilization mechanisms but their role remains mostly unknown. Furthermore, in all these cases, the destabilization is only triggered by quasistatic buoyancy, leaving no possibility for arbitrary dynamical actuations and for evaluating the effect of particle mobility.
19 or when the particles strongly pin the contact line,17 as observed when using rough irregular sand grains for example. The transition between these mechanisms was attributed to an increase of particle adsorption energy – all things staying equal – or by the ability of a particle to move out of the interface.20 Investigating armored bubbles, Taccoen et al. show that the latter may cause local dislocations with mechanical consequences at the entire armor scale.21 Inter-particle interactions are also expected to influence the selection of destabilization mechanisms but their role remains mostly unknown. Furthermore, in all these cases, the destabilization is only triggered by quasistatic buoyancy, leaving no possibility for arbitrary dynamical actuations and for evaluating the effect of particle mobility.
In this work, we tackle these two problems, namely how the mobility and the polydispersity of the particles affect the ability of the armor to hinder coalescence. We first experimentally probe the rupturing transitions of two kinds of armor via drop impacts: mobile particle rafts for which the particles are placed at an air/water interface and immobile rafts for which the particles are held in place at the interface of a strong gel reducing their mobility to zero. We show that, contrary to mobile rafts for which the velocity threshold of an impacting drop increases with increasing particle diameter,22 the velocity threshold of impacting drops onto immobile rafts decreases with increasing particle diameter. We then propose two models that quantitatively reproduce these observations. Eventually, we consider rafts made of particles of two different sizes and show how particle mobility and interactions promote collective effects which are not observed for immobile particles. The article is organized as follows. The materials and experimental methods used to form and probe the armor are detailed. Then, the rupturing thresholds for monodisperse mobile and immobile armor are reported with two corresponding models that reproduce the experimental results. The characterization of bidisperse rafts is then presented. Finally, we show that the rupturing transition significantly broadens on bidisperse mobile and immobile armor. We interpret these results with the help of the models developed for monodisperse armor accounting for particle mobility via the emergence of collective effects.
2 Experimental section
2.1 Particles
Glass beads with a density of 2500 kg m−3 were made hydrophobic by silanization using a solution of trichloro-perfluorooctyl-silane (Sigma Aldrich) in anhydrous hexane (Sigma Aldrich). The resulting contact angle was optically measured by placing particles at air/water interfaces, giving θ = 107° ± 10°. The beads were thus mechanically sieved to obtain several particle lots with narrow size distributions. For each particle lot, the size distribution was estimated by measuring the diameter of at least 1000 particles. Images of the particles were recorded using a camera equipped with a microscope lens and automated image analysis was performed to obtain the diameter distribution. The experimental distribution was finally fitted by a Gaussian distribution with mean bead diameters ranging from 48 to 570 μm and a typical relative standard deviation below 10%. The resulting values are given in Table 1 together with the particle Bond number defined as Bo = Δρgd2/σ where Δρ is the particle and water density difference, g the gravitational acceleration, d the mean particle diameter and σ the surface tension.| Mean diameter (μm) | Relative standard deviation (%) | Bond number (Δρgd2/σ) | Lot designation (if applicable) |
|---|---|---|---|
| 48 | 12.5 | 4.8 × 10⁻⁴ | |
| 64.5 | 7.8 | 8.6 × 10⁻⁴ | |
| 79 | 5.1 | 1.3 × 10⁻³ | |
| 107 | 8.4 | 2.4 × 10⁻³ | Small |
| 192 | 4.7 | 7.7 × 10⁻³ | Large |
| 570 | 7.9 | 6.8 × 10⁻² |
2.2 Raft preparation
To produce the rafts, particles are placed at the interface of a liquid puddle whose contact line is pinned to the substrate, providing rafts of typically 8 cm2. The puddle depth is fixed by the capillary length of the undecorated liquid and is found to be close to 5 mm after particle deposition. Practically, particles are sprinkled onto the puddle while it is vibrated till the particle density is large enough to induce jamming. The jamming, also designated as the collapse threshold,23 is detected by the appearance of wrinkles at the surface. The excess of particles is then smoothly blown away so that only a monolayer remains trapped at the interface.Deionized water is used to produce mobile rafts. In contrast, for immobilizing the rafts, a dyed aqueous solution of low temperature agarose (Agarose Type IX A, Sigma Aldrich) at 2% (w:w) is used, providing after cooling a gel with a strength of more than 400 g cm−2. The dye is Indigotin 85 E 132 (BASF) at a concentration of 0.6% (w:w). In this case, the particles are deposited on the interface of the heated (70 ± 10 °C), and therefore still liquid, agarose solution. The puddle is then placed to cool down in a fridge (6 ± 2 °C) for approximately 15 minutes leading to the solution settling. The gelified armored puddle is left for a few minutes at room temperature for equilibration before being tested.
Bidisperse armor is produced using mixtures of small (d = 107 μm diameter) and large (D = 192 μm) particles in known proportions. The bidisperse mixtures are described by the surface weighted relative amount of small particles φs = nd2/(nd2 + ND2) where d and D denote the particle diameter and n and N the number of particles – small and large, respectively – in a sample containing a total of n + N particles. In the present study, we employ eight bidisperse mixtures with φs ranging from 0.2 to 0.9 with typical increasing steps of 0.1. The bidisperse armors are further characterized by the spatial distribution of small and large particles.
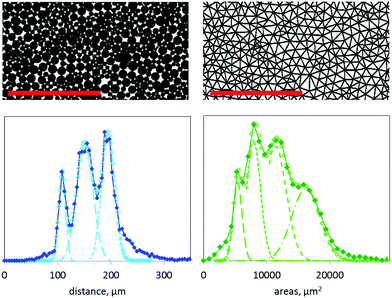
The particle density of our rafts Ψ is evaluated using top view images of the rafts (see Fig. 7, top left). The images are thresholded to obtain the surface covered by the particles which is normalized by the image surface area, giving Ψ ≈ 0.85. This value is in agreement with the results found for monodisperse rafts whose jamming particle density is close to the maximal packing fraction  .24 Particle densities close to Ψmax are typically obtained by applying compression/decompression cycles to the rafts.25,26 The slightly smaller values of Ψ obtained in this work could be due to less efficient thermalization of the rafts (vibrations instead of compression/decompression), or due to thresholding of the raft surface images which are obtained with different illumination. However, Ψ remains in the expected range of the jamming transition and is found to be independent of φs.
2.3 Drop impacts
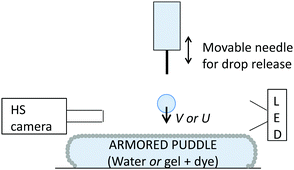
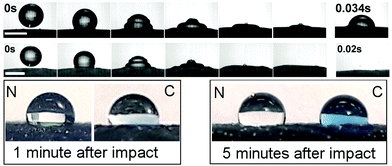
Deionized water drops are released from a thin needle. The drop diameter Δ is kept constant at 2.25 mm ± 0.10 mm. The drop velocity is varied by adjusting the needle height. The impacts are recorded using a high speed camera with a typical frame rate of 5000 fps. Movies are processed to determine the velocity of the impacting drop as well as the drop diameter. A sketch of the experimental set-up is given in Fig. 1.For impacts onto mobile rafts, two regimes are observed that can easily be distinguished and are namely designed by non-coalescence and coalescence.22 Regardless of the impact outcome, both the armored puddle and the impacting drop deform so that only the upper part of the drop remains above the undeformed raft level, as shown by the image sequences in Fig. 2. Non-coalescence corresponds to drops that recoil and remain separated from the interface on which the particles are initially placed. In contrast, if the armor ruptures, contact between the impacting drop and the puddle bulk occurs leading to the coalescence of the drop into it.
For immobile armor, two outcomes are observed. Either the drop stays on top of the particle monolayer without any contact with the agarose underneath (by analogy to the observations made with mobile armor, we called this regime non-coalescence) or the drop penetrates the armor and touches the dyed agarose. We refer to this regime as coalescence or ruptured armor. The two cases are distinguished with the help of the food dye which initially colors the gel only. If no dye is found in the drop after impact, no contact occurred and the outcome is non-coalescence. On the contrary, if the water drop is colored 5 minutes after impact, we classify the outcome as coalescence, see Fig. 2, bottom.
3 Results and discussion
3.1 Monodisperse mobile armor
Drop impacts onto monodisperse mobile silica bead armor have already been studied.22 In this previous work, the liquid/particle contact angle was 112° and the particle diameter d ranged from 32 to 159 μm, while the drop diameter Δ was varied between 1.8 and 4.0 mm. A sharp transition toward coalescence was observed whose velocity threshold V* increases with the particle diameter as d0.22, and for Δ < 3.5 mm, decreases with increasing drop diameter as Δ−0.82.These scalings were successfully reproduced considering that the kinetic energy of the impacting drop scaling as ρΔ3V2 is converted into surface energy σΣ which deforms the puddle, opening a hole(s) of area Σ ∝ ρΔ3V2/σ in its coverage where ρ is the water density, V the impacting drop velocity and σ the water surface tension. Experimental observations indicate that one or more holes in the puddle coverage are located at the drop periphery in a crown whose typical diameter is the drop diameter. Simple geometrical arguments lead to a crown width e scaling as Σ/Δ ≈ ρΔ2V2/σ. When the width of a hole reaches a critical value ecr, the two naked interfaces, typically separated by d by the presence of the particles, come into contact and the drop coalesces with the puddle. The estimation of ecr derives from geometrical considerations attributing a curvature of  and 1/Δ to the puddle and drop interfaces, respectively. Here g is the gravitational acceleration. This leads to
  . Finally, the theoretical velocity threshold is given by
 | (1) |
In the present work, we completed the experiments of drop impacts onto monodisperse mobile rafts adding two particle lots corresponding to small (d = 107 μm) and large (D = 192 μm) particles and a drop of diameter Δ = 2.25 mm. For each particle size, a series of impacts was achieved, which also shows a sharp transition between non-coalescence and coalescence and enables the determination of two threshold velocities. The threshold velocities are defined as the average of the velocities between the fastest non-coalescence and the slowest coalescence events – excluding possible isolated points which are points preceded and followed by at least five consecutive points corresponding to the other outcome (three occurrences in all the experiments). The threshold velocities were found to be 0.515 and 0.597 m s−1 for small and large particles, respectively, as reported in Fig. 3(a). The results are further represented in Fig. 3(b), together with previous measurements,22 as a function of Vtheo*, the theoretical velocity which can be derived by the above mentioned model (eqn (1)). The newly obtained data agree very well with the previous ones and the predictions. It is worth noting that the velocity threshold for coalescence increases with increasing particle diameter. The theoretical scaling predicts Vtheo*(d)/Vtheo*(D) = (d/D)1/4. Experimentally, we obtain V*(d)/V*(D) = 0.863 in perfect agreement with (107/192)1/4 = 0.864. Thus, for monodisperse mobile rafts, the larger the particles, the more robust the armor.
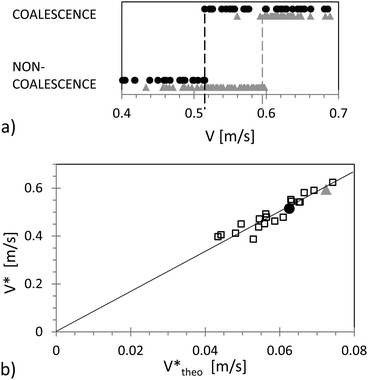 | ||
| Fig. 3 (a) Outcomes of two series of impacts on mobile small (black circles) and large particle rafts (grey triangles) as a function of the impacting velocity V; the dashed lines represent the experimental threshold velocities for the two particle sizes. (b) Experimental threshold velocities V* as a function of theoretical ones Vtheo*, eqn (1), obtained for the small particles (black circles), the large particles (grey triangles) and from data of the literature22 (squares). | ||
3.2 Monodisperse immobile armor
For immobile monodisperse armor, six particle sizes have been used that correspond to the six lots presented in Table 1. For each lot, at least one armor was produced and drops of 2.25 mm diameter were released from different heights to probe the armor robustness. As for monodisperse mobile armor, series of impacts were realized which show – except for the largest particles – a sharp velocity transition between non-coalescence (no contact with the agarose) and coalescence (contact between the drop and the agarose identified by the presence of dye in the drop after impact). Two of these series obtained with the small and large particles, respectively, are shown in Fig. 4(a). From these series, we deduce the velocity threshold of each armor. Typically this threshold is taken as the average value between the highest velocity leading to non-coalescence and the lowest one producing coalescence – excluding possible isolated points. For small particles, we find U* = 0.72 m s−1 and for large particles U* = 0.525 m s−1. For impacts on the immobile armor made of the largest particles (a diameter of 570 μm), only coalescence was observed and, for this lot, we defined the threshold as 0 m s−1. All velocity thresholds are plotted in Fig. 4(b) as a function of the particle diameter. It immediately appears that, in contrast to mobile armor, the robustness increases with decreasing particle size. Experimentally, we obtain a threshold velocity U* that varies with the particle diameter as d−0.54 (±0.10 for confidence intervals of 90%), see the insert in Fig. 4(b).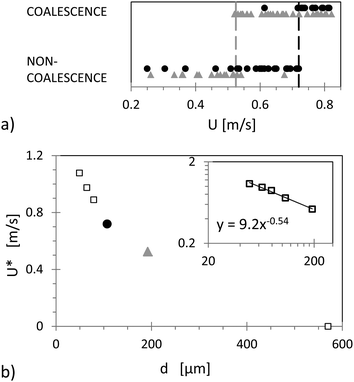 | ||
| Fig. 4 (a) Outcomes of two series of impacts on immobile small (black circles) and large (grey triangles) particle rafts. (b) Experimental threshold velocities U* as a function of particle diameter d obtained for small (black circles) particles, large particles (grey triangles) and all particle sizes listed in Table 1 (empty squares). The insert represents the same data with log–log scales. The black line corresponds to a power-law fit. | ||
To explain this scaling, we treat the immobile rafts as micro-textured surfaces. By analogy with other micro- and nano-textured surfaces, the transition between non-coalescence and coalescence can be seen as a transition between heterogeneous and homogeneous wetting states, classically refereed to as Cassie–Baxter and Wenzel states, respectively.27,28 The transition occurs when the capillary force which supports the interface cannot compensate for the externally applied pressures. Similarly, drop impacts onto hydrophobic microstructured grids show a transition between a totally retained drop and a drop emerging through the grid.29 For the immobile rafts, the particle monolayer can be seen as an array of pillars or as a grid with a more complex geometry, each pillar being a sphere and each hole an interstice between them. The elementary unit of this surface is constituted by a triplet of particles, as sketched in Fig. 5. In contrast to the grids studied in ref. 29, the monodisperse rafts keep the same geometrical constrains regardless of the interstice size. The spherical shape of the protrusions with their equator in air makes the surface “mushroom-type” with a multi-valued roughness30 and calls for an approach based on force balance rather than on surface roughness alone.
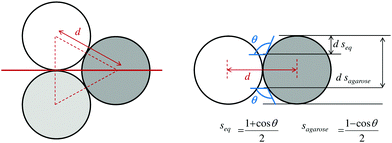 | ||
| Fig. 5 Left: Top view (sketch) of an interstice formed by three particles of diameter d. Right: Sketch of the side view. Dimensions are indicated on the sketches. | ||
The externally applied pressures can be identified as the kinetic pressure Pkin = 1/2ρU2 where U is the drop velocity and the Laplace drop pressure Pdrop = 4σ/Δ. These pressures act on the surface area of one interstice  .
.
For each interstice, the vertical component of the capillary force is:31
Balancing the capillary force with the externally applied pressures, yields:
 | (2) |
 .
.
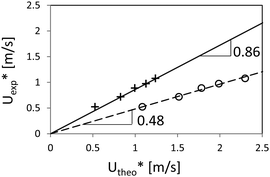
The theoretical scaling provides a velocity threshold that decreases with increasing particle diameter. In the limit of Δ ≫ d, Utheo* scales as d−0.5, in good agreement with −0.54, the exponent obtained experimentally. To determine if this model is quantitatively accurate, one needs to define at which altitude of the contact line s the coalescence would occur. The magnitude of the capillary force fσ monotonically increases with s for s ≥ seq = (1 + cos![[thin space (1/6-em)]](https://www.rsc.org/images/entities/char_2009.gif) θ)/2. Thus, a first order criterion is that coalescence takes place when the liquid contact line is at the altitude of the agarose, i.e. when s = sagarose = (1 − cos
θ)/2. Thus, a first order criterion is that coalescence takes place when the liquid contact line is at the altitude of the agarose, i.e. when s = sagarose = (1 − cos![[thin space (1/6-em)]](https://www.rsc.org/images/entities/char_2009.gif) θ)/2 ≈ 0.65, with θ = 107°. A comparison between the experimental results and this theoretical threshold is reported in Fig. 6.
θ)/2 ≈ 0.65, with θ = 107°. A comparison between the experimental results and this theoretical threshold is reported in Fig. 6.
The theoretical threshold is overestimated by a factor 2 in this case, which was indeed expected. Since the impacting droplet interface is not horizontal due to the contact angle constraint, its contact with the agarose gel is achieved for smaller s, see the sketch in ESI†![[thin space (1/6-em)]](https://www.rsc.org/images/entities/char_2009.gif) 31 for more details. Taking this into account, a rough estimate suggests that the interface reaches sagarose in its lower position when the contact line is at smax satisfying31
31 for more details. Taking this into account, a rough estimate suggests that the interface reaches sagarose in its lower position when the contact line is at smax satisfying31 , resulting in smax ≈ 0.45 and α ≈ 0.70. In this case, a reasonable quantitative agreement with the experimental data is achieved as reported in Fig. 6, though overestimated (16%). The slight deviation could be caused by defects in the particle array or variations of θ toward lower values. It is also interesting to note that for 570 μm, the model predicts permanent coalescence in agreement with the experimental observations. Finally, note that despite the complexity of the situation (inertial impact of a droplet on an entanglement), the critical inertial pressure for coalescence (ΔP = 1/2ρU2) matches quantitatively the experimental quasistatic pressure of imbibition of an assembly of grains which bears the same geometrical constraints.16
The relevance of our interpretation can also be estimated by comparing it to other scenarios.32,33 On one hand, involving the water hammer pressure Pwh = kρUC or the maximum of pressure that follows the drop recoil  32 would lead to a different scaling which appears less relevant for the present experiments. In this framework, k is a proportional constant and C is the sound velocity in water (1480 m s−1). Equilibrating Pc with Pwh provides
  and thus an exponent of −1 in contradiction with the experimental value of −0.54, while balancing Pc with PS leads to the same exponent of −1 with
  . On the other hand, a focalisation of the drop kinetic energy into the interstices33 would lead to a scaling in d3/2, thus increasing with d in contradiction with the present experimental observations.
Now that the velocity threshold for drop coalescence on mobile and immobile rafts has been characterized, we investigate the role of particle polidispersity on these thresholds.
3.3 Bidisperse armor: surface characterization
In order to estimate the coalescence threshold on bidisperse rafts, analysis of interparticle interstice size repartition must be performed. Mobile and immobile armor formed of bidisperse particle mixtures is then imaged from the top. First, the particle surface density is evaluated. It shows no difference between monodisperse and bidisperse rafts and provides Ψ ≈ 0.85 in agreement with reported values at the jamming transition.24,26 The images are further analyzed with the freeware ImageJ to detect the center of each particle. The particle center positions are then used to perform a Delaunay triangulation (using the Python SciPy package34) as illustrated in Fig. 7.In the Delaunay triangulation of each armor, the triangle side lengths indicate the distances separating pairs of neighboring particles and by extension, the types of particle pairs which are formed: small–small, small–large or large–large particles, noted dd; dD and DD, respectively. Similarly, the surface area of each triangle gives information on the geometry of each particle triplet which may be constituted by 3 small particles, 2 small – 1 large, 1 small – 2 large, or 3 large particles and referred to as ddd, ddD, dDD and DDD, respectively. Each type of particle triplet is associated with a type of particle pore. Finally, histograms of triangle side lengths and of triangle surface areas are built to evaluate the relative distribution of small and large particles in term of types of particle pair and types of particle triplet. Each triangle side length histogram is fitted with a Gaussian distribution centered at the expected values of 107 μm = (d + d)/2; 145 μm = (d + D)/2 and 192 μm = (D + D)/2. Using the Gaussian fits, we estimate the integration of each peak by 1/2δH where δ is the half-height width and H the maximum of each peak. Results are normalized by the sum of these integrals to get the relative distribution. A similar procedure is followed to obtain the relative distribution of the four expected types of particle triplet. Illustrative histograms and corresponding fits are shown in Fig. 7.
The experimental pair and triplet probability inferred from these fits are plotted in Fig. 8 together with the theoretical probabilities as a function of φs. The values of φs are deduced from the weighting of small and large particles during particle mixing. The theoretical probabilities are calculated by considering the draw of two or three particles in an assembly containing n small and N large particles. We assume that n + N is large which implies that the particle draw does not affect the assembly composition. Under these assumptions, the probability to draw one small particle is  (
( to draw one large particle). Recalling the definition of φs, we get
  which enables us to express pd and pD as a function of φs. Theoretical pair and triplet probabilities are thus reported in Table 2.
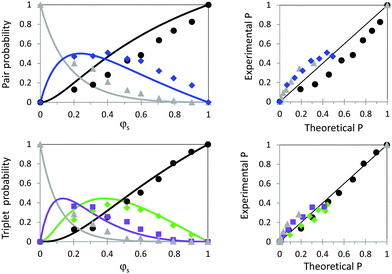 | ||
| Fig. 8 Left: Experimental (full symbols) and theoretical (full lines) probabilities for a particle pair (top) to be of type dd (black circles), Dd (blue diamonds) or DD (grey triangles) and for a triplet (bottom) to be of type ddd (black circles), Ddd (green diamonds), dDD (purple squares), or DDD (grey triangles) as a function of φs. Right: Experimental probabilities plotted as a function of theoretical ones (see Table 2), top: pairs, bottom: triplets. | ||
| Pair/triplet type | Probability | U* (immobile) (m s−1) | V* (mobile) (m s−1) |
|---|---|---|---|
| d–d | p d 2 | 0.515 | |
| d–D | 2pdpD | 0.557 | |
| D–D | p D 2 | 0.597 | |
| d–d–d | p d 3 | 0.72 | |
| d–d–D | 3pd2pD | 0.634 | |
| d–D–D | 3pdpD2 | 0.572 | |
| D–D–D | p D 3 | 0.525 |
As expected, we observe that pairs or triplets involving only small particles are more frequent for large φs while the opposite evolution is found for pairs and triplets involving only large particles. The agreement between experimental and theoretical pair and triplet distributions is very good despite some deviations, more visible when the experimental probabilities are plotted as a function of the theoretical ones (Fig. 8, right). The occurrence of pairs of small particles only is overestimated while mixed pairs and pairs of large particles only are slightly more frequent than predicted. One origin of these deviations could be a moderate segregation process taking place while the particles assemble at the interface. Indeed, buoyant particles (see Bo, Table 1) are known to locally distort the interface creating monopolar interactions between them.35,36 Since the magnitude of inter-particle attraction increases with the importance of the local interface distortion, it also increases with particle size and may explain the observed deviations. Large particles subjected to attraction come in contact and capillary bridges subjected to contact line pinning may develop that oppose their rearrangement.37,38 Another reason for the discrepancies lies in the packing of bidisperse disks. Voids may exist between the particles that are too small to accommodate any particle. The distance between the closest particles becomes larger than the sum of their radii. As a result dd or dD contact-less arrangements may be counted as dD or DD pairs. In the following, we use the experimental probabilities of pairs and triplets.
Bidisperse rafts being characterized, we now investigate their ability to prevent the coalescence of impacting drops, for both the extreme cases of immobile and mobile armor.
3.4 Bidisperse immobile armor
For drops impacting bidisperse immobile armor, no sharp transition between non-coalescence and coalescence is observed. Instead, a broader transition takes place with the coexistence of both coalescence and non-coalescence over a large range of velocities bounded by the threshold velocities observed with monodisperse rafts of large and small particles, respectively U*(D) and U*(d). For smaller velocities, U < U*(D), non-coalescence occurs and for larger velocities, U > U*(d) drops coalesce, similarly to what is observed for monodisperse rafts.To represent the outcome of an impact series onto bidisperse rafts, we estimate the coalescence probability over predefined velocity intervals and obtain the histograms presented in Fig. 9. Each point corresponds to E, the coalescence expectation calculated as the arithmetic mean of the outcomes for all impacts whose velocity is in the predefined interval. The expectation is plotted for the corresponding averaged velocity and horizontal bars indicate the minimal and maximal velocities actually probed in the predefined interval. Here and in the following, the vertical error bars correspond to  where n is the number of occurrences for each expectation and represents an estimation of the data variability. Fig. 9 shows the results obtained for φs equal to 0.2, 0.4, 0.6 and 0.8. The data corresponding to φs equal to 0.3, 0.5, 0.7 and 0.9 are presented in ref. 31 for completeness. For all φs, the coalescence expectation increases rather step-wisely with U. Two main steps can be seen. The first step occurs close to U*(D), slightly before for small φs and the second one close to U*(d), slightly after for large φs. The magnitude of the first step decreases with increasing φs while the opposite is seen for the second step. Based on the monodisperse immobile raft results, we identify the expectation step at U*(D) with the probing of interstices of type DDD and the expectation step at U*(d) with the probing of interstices of type ddd. In agreement with the knowledge about the localized pressure maximum during drop impacts,39 this evolution indicates a local probing of the raft – the scale being a priori unknown. Qualitatively, we expect the height of the step at U*(D) to increase with pDDD and consequently to decrease with φs, in agreement with the experimental results.
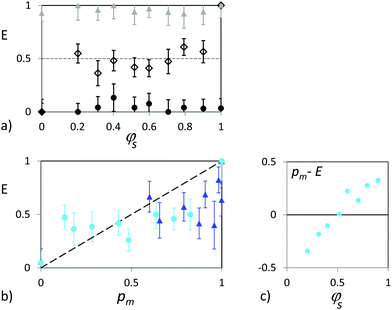
To confirm this interpretation, we plot in Fig. 10(a) the coalescence expectation for U < U*(D) (grey triangles), U*(D) < U < U*(d) (empty diamonds), and U*(d) < U (black circles) as a function of φs. As expected, for velocities smaller than U*(D), there is non-coalescence while for velocities larger than U*(d), drops coalesce. We note, as in Fig. 9, that for small φs, a few coalescence events can occur just below U*(D). This robustness decrease may be explained by local disturbances in particle packing caused by the presence of small isolated particles that prevent large ones from reaching close packing.26 We also notice that for large φs, a few non-coalescence events are observed above U*(d). This robustness increase may be caused by the presence of a few isolated large particles which tend to maintain the drop interface at a greater distance from the agarose. For intermediate velocities, U*(D) < U < U*(d), we see a clear decrease of the coalescence expectation with increasing φs, confirming the trend observed for the four mixtures of Fig. 9. A line representing 1 − φs is drawn to guide the eye which empirically well describes the evolution of E with φs. To further interpret these results, let us recall the model derived for monodisperse rafts which considers force balance in one interstice formed by three neighboring particles. For an interstice made of monodisperse particles of diameter d, the velocity threshold corresponds to  in good agreement with the experimental results providing a scaling of U* with d−0.54. On bidisperse rafts, four possible types of interstice must be considered: ddd, ddD, dDD, and DDD. In principle, the capillary force provided by each type of interstice could be directly measured using the method proposed in ref. 40. Alternatively, extending the results obtained with monodisperse rafts, we associate with each of these interstice types, a threshold velocity reported in Table 2 and defined for mixed triplets by:
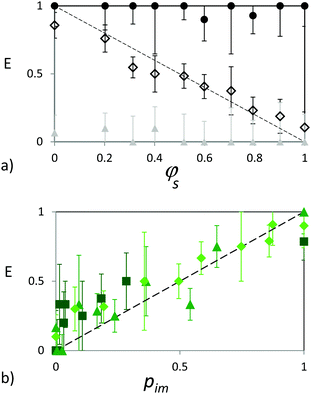 | ||
| Fig. 10 (a) Coalescence expectation for U < U*(D) (grey triangles), U*(D) < U < U*(d) (empty diamonds), and U*(d) < U (black circles) as a function of φs. The dashed line corresponds to 1 − φs and is a guide for the eye. (b) Coalescence expectation for U*(D) < U < U*(DDd) (squares), U*(DDd) < U < U*(ddD) (diamonds), U*(ddD) < U < U*(d) (triangles) as a function of pim, as defined in Table 3. | ||
Thus, the coalescence probability pim is expected to increase with four steps and can be estimated for five velocity intervals as reported in Table 3.
| Velocity range | Probability of coalescence pim |
|---|---|
| 0 − U*(D) | 0 |
| U*(D) − U*(d–D–D) | p DDD |
| U*(d–D–D) − U*(d–d–D) | p DDD + pdDD |
| U*(d–d–D) − U*(d) | p DDD + pdDD + pddD |
| U*(d) − ∞ | 1 |
In Fig. 10(b), we have plotted the coalescence expectation for all mixtures (φs = 0.2; 0.3; 0.4; 0.5; 0.6; 0.7; 0.8; and 0.9) as a function of the above defined probability pim. For all mixtures, the experimental coalescence expectations obtained on assemblies of triplets increase with the coalescence probability calculated on a single triplet.
We note, as expected, that the smaller is n, the number of impacts for a given expectation, the more important is the point dispersion.
It is noteworthy that E, the expectation of a drop to coalesce on a bidisperse raft, can be well modeled by the coalescence probability calculated at the scale of one unique interstice randomly selected on the raft pim. Indeed, we observe E ≈ paim with a = 1. This clearly indicates that the scale a priori unknown at which the local maximum pressure extends during drop impact39 typically corresponds in our case to the size of one single interstice. With the particles being immobilized by the agarose, no strong collective effects can develop that would enable averaging threshold velocities leading to a ≠ 1. The effects of neighboring particles are limited to packing heterogeneities created by the presence of particles of different sizes and possibly to a slight shift of seq within the range of the contact angle hysteresis between adjacent particles of different sizes. Heterogeneities in the particle packing may cause an excess of coalescence for U ∼ U*(D) while shifts of seq towards smaller values for small particles in contact with large ones may confer a robustness increase on the corresponding pore and enable non-coalescence to be observed for U slightly larger than U*(d).
Note that this analysis can be generalized to any polydisperse distribution of beads making use of the fact that the probability distribution of the sum of two or more independent random variables is the convolution of their individual distributions. Noting p, the probability distribution to draw a bead of diameter d, the probability distribution pT to draw a particle triplet that forms a triangle of contour length L = d1 + d2 + d3 is then given by pT(L) = (p*p*p)(L), the two convolution products of the particle probability p(d). Here, d1, d2 and d3 are the diameters of the three beads of the triplet. Further extending the results obtained on monodisperse rafts, a threshold velocity can be associated with each triplet of length L and corresponds to U = U*(d)(L/3d)−0.54. Thus, the coalescence probability for a drop impacting at this velocity U is given by the probability for the drop to probe a triplet of contour greater than L which is equal to  . For a particle size distribution following a normal law centered in d0 with a variance σ02, the probability to draw a triplet of contour L0 = 3d0 is a normal distribution centered in L0 with a variance σ2 = 3σ02. Compared to the particle size distribution, the coalescence transition is only widened by a factor
  .
.
Furthermore and similarly to scanning droplet adhesion microscopy,40 our results suggest that drop impacts could be used to map – at the microscale – the wettability of any surface accounting for its local roughness and chemical nature.
3.5 Bidisperse mobile armor
Our understanding of bidisperse immobile rafts raises several questions regarding the modeling of bidisperse mobile raft robustness. Can the approach which focuses on an elementary raft unit be transposed from the immobile situation to the mobile case using a particle pair instead of a triplet? If the maximal pressure experienced by a substrate subjected to drop impact is very punctual, how can the radial geometry observed for impacts onto mobile rafts be accounted for? Can a succession of particle pairs produce a relevant geometry? Can particle mobility give rise to collective effects? Of which kind and on which scale? Can this be modeled by an averaging approach?Let us start with a qualitative description of drop impact outcomes for mobile bidisperse rafts. Similar to immobile rafts, no sharp transition between non-coalescence and coalescence is observed. Instead, a broad transition takes place with the coexistence of both coalescence and non-coalescence over a range of velocities typically bounded by the threshold velocities observed with monodisperse rafts of small and large particles, respectively V*(d) and V*(D).
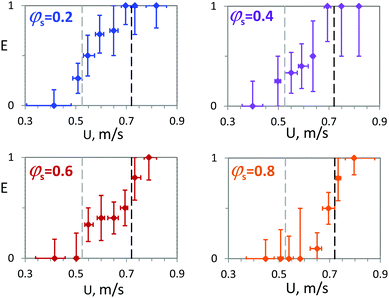
For a better description, we present in Fig. 11 the coalescence expectation E calculated over predefined velocity intervals, for φs equal to 0.2, 0.4, 0.6, and 0.8, similar to the graphs of Fig. 9 for immobile rafts. The results obtained for φs equal to 0.3, 0.5, 0.7 and 0.9 are presented in ref. 31. For all φs, the coalescence expectation increases with V. The evolution of E is characterized by an increase for velocities between V*(d) and V*(D) and resembles the one observed for immobile rafts.
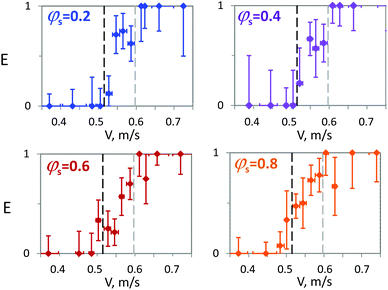 | ||
| Fig. 11 Coalescence expectation as a function of velocity for mobile bidisperse rafts with φs 0.2, 0.4, 0.6 and 0.8. The vertical dashed lines indicate the thresholds observed for monodisperse rafts. | ||
Based on the previous results and aiming at describing the dependency of E on the raft composition, we define 3 velocity thresholds corresponding to the 3 types of particle pairs that can form (see Table 3 with  ).
).
Note that V*(dD) corresponds to a hole between two particles of different sizes which, all things being equal, provides a critical broadness of  . We first assume that at the transition, mostly one hole opens at the drop periphery which is randomly located in the crown shape region. This strong assumption is indeed reasonable. Given the values of their Bond number (see Table 1), the particles are subjected to lateral capillary attractions which are known to decrease with the distance separating the particles.41 Once the opening of a hole is initiated, the hole grows which is thus expected to remain localized. This leads to identify the coalescence probability pm with:
• for V < V*(d), pm = 0;
• for V*(d) < V < V*(dD), pm = pdd;
• for V*(dD) < V < V*(D), pm = pdd + pdD;
• and for V*(D) < V, pm = pdd + pdD + pDD = 1.
This analysis is presented in Fig. 12 which summarizes the variations of E with the mobile raft composition. Contrary to immobile rafts, we observe no significant dependency. E obtained over V*(d) < V < V*(D) is found to be almost constant, close to 0.5, possibly slightly increasing with φs, see Fig. 12(a). The transposition of the analysis successfully applied to immobile rafts does not quantitatively reproduce the experimental observations. Indeed, if the coalescence expectations measured respectively over V*(d) < V < V*(dD) and V*(dD) < V < V*(D) seem to increase with pm they remain close to 0.5 without approaching 0 or 1 (Fig. 12(b)).
These results demonstrate that the robustness of bidisperse mobile rafts toward drop coalescence is comparable for rafts with large and small φs. This counter intuitive conclusion calls for explanation involving averaging or collective effects. First, the particle mobility, expected to be different for small and large particles,42 has not been accounted for whereas it constitutes a major difference to immobile rafts.
Yet, the local modification of the raft composition via dynamic segregation processes appears very unlikely due to the high particle packing density and subsequent important steric hindrance. Instead, it is more interesting to look at the mobility of the particles normal to the water interface. Thanks to a non-zero contact angle hysteresis, the adsorbed particles which fulfill the wetting conditions can be found in slightly shifted planes.20 As a consequence, particles located below the drop and which bridge two liquid interfaces may be found in the same plane even if they are of different sizes. A sketch illustrating this configuration is visible in ref. 31. This suggests that the distance separating the drop and the puddle interfaces may not be well described by a local estimation based on one single particle pair and giving d, D and (d + D)/2 for dd, DD and dD, respectively. We propose to introduce an effective particle diameter deff = dφs + D(1 − φs) to account for this effect and replace the intermediate velocity V*(dD) = V*(d)((d + D)/2d)1/4 by V(deff) = V*(d)(deff/d)1/4. Yet, the results obtained with this averaging effect (presented in ref. 31) show no significant differences to those provided by V*(dD). If this effect cannot be excluded, other factors are responsible for the deviations between theoretical predictions and the experimental expectations.
Another possible source of discrepancy is the coalescence criterion we use. Indeed, this coalescence criterion is based on a single randomly selected pair of particles and may be modified to account for the ensemble of particles located at the drop periphery. A new criterion for V*(d) < V < V*(dD) could be that there are at least m successive particle pairs of type dd along the crown. In this case again, the probability of coalescence then depends on ϕs, contrary to observations.
Thus, considering that the probed particle ensemble, small (pair) or large (crown), is randomly selected may be a wrong assumption. Indeed, at the collapse threshold, the granular character of particle rafts becomes dominant.14,23,25,43,44 By nature, when subjected to mechanical stress, such systems do not have an homogeneous response. Forces inside granular media are transmitted by the contact between particles,45,46 building a network of force chains whose directions depend on the packing of the grains,45,46 or follow the spatial distribution of the large particles only.47 Tsoungui et al.48 studied a true 2D system composed of bidisperse disks with a diameter ratio of 0.6. No regular packing was observed and the grain contacts involved in force chains tend to follow the direction of the applied macroscopic force. In our situation, the mechanical stress applied to the raft consists of small bending and large elongation. The fracture of quasi-2D elongated granular layers has been studied,49 but the link of the fracture path (observed as rough49) with the microstructure of the layers remains unexplored.
To interpret our results it may therefore be helpful to consider statistical models for fractures in disordered media.50 For 3D materials, it is known that fractures are extremely sensitive to microscopic heterogeneities where they preferably open. The reason for this localization is the corresponding inhomogeneity in stress distribution which may cause local excess of load between neighboring volume elements eventually overcoming the material cohesion. Thus, for rafts subjected to elongation, fractures are most likely to be caused by tangential force inhomogeneities. Furthermore, for bidisperse rafts, tangential stresses are more efficiently transmitted by contacts between two particles of the same size than particles of different sizes.26
Consequently, for rafts percolated with large resp. small particles, chain forces preferably build up between large (resp. small) particles only and holes in the armor preferably open within the inhomogeneities which are constituted by areas where small (resp. large) particles are found. The prediction of the coalescence probability over V*(d) < V < V*(dD) obtained assuming a random selection of a particle pair should deviate from the experimental expectations in the following manner. For rafts percolated with large (resp. small) particles, pm underestimates (resp. overestimates) E leading to pm − E < 0 (resp. pm − E > 0) while for rafts percolated with large particles and corresponding to φs < 0.4–0.5, the opposite deviation occurs with pm − E > 0. This description corresponds indeed very well to the observed deviations reported in Fig. 12(c). This analysis suggests that rupture in extended granular rafts is not set randomly and takes place preferentially with the non-percolated particles which can thus compensate for their lower frequency. Indeed, the site percolation thresholds of bidimensional triangular lattices and Delaunay networks are both found to be 0.5,51–53 providing a transition for φs = 0.5. Alternatively, by directly considering the bond percolation thresholds (approximately 0.35 and 0.33 for triangular and Delaunay networks, respectively52,54), we obtain a percolation transition at φs ≈ 0.4 (see Fig. 8 for the variations of pdd and pDD with φs). Finally, it is worth noting that the finite size of the probed area – corresponding to 200 to 660 particles depending on the raft composition – may cause the percolation transition to smoothen.
4 Conclusions
Monodisperse rafts probed by drop impacts show a sharp transition between non-coalescence and coalescence. For immobile rafts, the larger the particles, the less robust the raft while the opposite is observed for mobile rafts. The velocity thresholds can be predicted for both immobile and mobile rafts considering force or energy balances and geometric arguments focusing on an elementary unit of the rafts. For immobile rafts, the velocity threshold, which can be derived from force balance at the scale of one single pore made from three neighboring particles, varies like the particle diameter with an exponent −0.5 in quantitative agreement with the experimental results. For mobile rafts, energy balance coupled to a coalescence criterion based on one particle pair geometry provides a theoretical threshold velocity which scales as the particle diameter at the power +1/4, in agreement with the experimental results. The opposite variations of the velocity threshold observed for a mobile (on liquid) and immobile (on solid) rafts question the outcomes for rafts placed on complex fluids (viscoelastic, viscoplastic,…) which are often found in industrial applications. This will be addressed in our next study.Let us now focus on bidisperse rafts which seem, at first, similar. Both mobile and immobile rafts provide a very broad transition between non-coalescence and coalescence of impacting drops. In both cases, the velocity transition is bounded by the threshold velocities observed for monodisperse rafts made of small and large particles, respectively. Yet, the similarities are only apparent, the particularities of mobile and immobile rafts being evidenced by the usage of bidisperse particles. Indeed, immobile rafts are rigid and drop impacts correspond to very local probing, typically at the scale of one particle triplet. Thus, the transition between non-coalescence and coalescence can be well described by a statistical approach considering the random selection of one particle triplet and applying to it the results obtained for monodisperse rafts. No averaging effects at the scale of more than one interstice can be identified. This suggests that drop impacts could be used to probe the surface porosity of substrates. The advantage of such a method over established ones such as imbibition, liquid porosimetry and gas adsorption, is its spacial resolution due to the local character of the probing.
For mobile bidisperse rafts, the variations of the coalescence expectations with the drop velocity and the composition of the particle mixture are weak with values close to 0.5. In this case, the particle mobility enables collective effects to take place. Two main hypotheses have been envisaged and tested. The first one suggests that the coalescence criterion based on a single particle pair must be made less punctual. Extending the criterion to more particles or introducing an effective particle diameter to account for neighboring particles turns out to be not conclusive. The second hypothesis considers that the local criterion can be kept but that the selection of the probed particle pair is not random. Making use of the granular character of the rafts in which force chains build up, we postulate that the critical probed area is most likely localized at heterogeneities which can be identified for bidisperse rafts with the non-percolated particles. The deviations between the experimental expectations and the predictions for purely random probing demonstrate the relevance of this interpretation. Our study constitutes a strong basis to comprehend how raft robustness is influenced by the size distribution of its particles which could be tuned to meet the needs of industrial applications. We have demonstrated for the first time that the quality of the size dispersion is essential because either for mobile or immobile armor, it is the association of the particles found in the extremities of the distribution which constitutes the weakest points of the armor. We have further evidenced the effects of raft cohesion and raft heterogeneity on its robustness. Thus, the roles played by particle lateral attraction and particle mobility normal to the interface in preventing internal stresses to relax seem essential and should be given much attention in future studies.
Conflicts of interest
The authors declare no competing financial interests.Acknowledgements
ALB thanks Pr. Hajime Tanaka for fruitful discussions on raft characterizations.References
- N. Pike, D. Richard, W. Foster and L. Mahadevan, Proc. R. Soc. London, Ser. B, 2002, 269, 1211–1215 CrossRef PubMed.
- R. S. Seymour and S. K. Hetz, J. Exp. Biol., 2011, 214, 2175–2181 CrossRef PubMed.
- N. J. Mlot, C. A. Tovey and D. L. Hu, Proc. Natl. Acad. Sci. U. S. A., 2011, 108, 7669–7673 CrossRef PubMed.
- B. P. Binks, Curr. Opin. Colloid Interface Sci., 2002, 7, 21–41 CrossRef.
- E. M. Herzig, K. A. White, A. B. Schofield, W. C. K. Poon and P. S. Clegg, Nat. Mater., 2007, 6, 966–971 CrossRef PubMed.
- M. E. Cates and P. S. Clegg, Soft Matter, 2008, 4, 2132–2138 RSC.
- C. Micheau, A. Schneider, L. Girard and P. Bauduin, Colloids Surf., A, 2015, 470, 52–59 CrossRef.
- K. P. Hapgood and B. Khanmohammadi, Powder Technol., 2009, 189, 253–262 CrossRef.
- B. Binks and T. Horozov, Colloidal Particles at Liquid Interfaces, Cambridge University Press, 2006 Search PubMed.
- P. Aussillous and D. Quéré, Nature, 2001, 411, 924–927 CrossRef PubMed.
- P. Aussillous and D. Quéré, Proc. R. Soc. London, Ser. A, 2006, 462, 973–999 CrossRef.
- C. Planchette, A. L. Biance and E. Lorenceau, EPL, 2012, 97, 14003 CrossRef.
- P. Zuo, J. Liu and S. Li, Soft Matter, 2017, 13, 2315–2321 RSC.
- D. Vella, H. Y. Kim, P. Aussillous and L. Mahadevan, Phys. Rev. Lett., 2006, 96, 178301 CrossRef PubMed.
- J. W. Tavacoli, G. Katgert, E. G. Kim, M. E. Cates and P. S. Clegg, Phys. Rev. Lett., 2012, 108, 268306 CrossRef PubMed.
- P. S. Raux, H. Cockenpot, M. Ramaioli, D. Quéré and C. Clanet, Langmuir, 2013, 29, 3636–3644 CrossRef PubMed.
- M. Abkarian, S. Protière, J. M. Aristoff and H. Stone, Nat. Commun., 2013, 4, 1895 CrossRef PubMed.
- E. Kim, K. Stratford, R. Adhikari and M. E. Cates, Langmuir, 2008, 24, 6549–6556 CrossRef PubMed.
- E. G. Kim, K. Stratford, P. S. Clegg and M. E. Cates, Phys. Rev. E: Stat., Nonlinear, Soft Matter Phys., 2012, 85, 020403 CrossRef PubMed.
- O. Pitois, M. Buisson and X. Chateau, Eur. Phys. J. E: Soft Matter Biol. Phys., 2015, 38, 48 CrossRef PubMed.
- N. Taccoen, F. m. c. Lequeux, D. Z. Gunes and C. N. Baroud, Phys. Rev. X, 2016, 6, 011010 Search PubMed.
- C. Planchette, A. L. Biance, O. Pitois and E. Lorenceau, Phys. Fluids, 2013, 25, 042104 CrossRef.
- D. Vella, P. Aussillous and L. Mahadevan, Europhys. Lett., 2004, 68, 212–218 CrossRef.
- G. Lagubeau, PhD thesis, Université Paris 6, France, 2010.
- C. Planchette, E. Lorenceau and A. L. Biance, Soft Matter, 2012, 8, 2444–2451 RSC.
- P. Petit, A.-L. Biance, E. Lorenceau and C. Planchette, Phys. Rev. E, 2016, 93, 042802 CrossRef PubMed.
- D. Bartolo, F. Bouamrirene, E. Verneuil, A. Buguin, P. Silberzan and S. Moulinet, EPL, 2006, 74, 299 CrossRef.
- M. Reyssat, J. M. Yeomans and D. Quéré, EPL, 2007, 81, 26006 CrossRef.
- P. Brunet, F. Lapierre, F. Zoueshtiagh, V. Thomy and A. Merlen, Appl. Phys. Lett., 2009, 95, 254102 CrossRef.
- A. Marmur, Langmuir, 2008, 24, 7573–7579 CrossRef PubMed.
- C. Planchette, E. Lorenceau and A. L. Biance, see ESI†.
- C. Lee, Y. Nam, H. Lastakowski, J. I. Hur, S. Shin, A.-L. Biance, C. Pirat, C.-J. Kim and C. Ybert, Soft Matter, 2015, 11, 4592–4599 RSC.
- R. Sahu, S. Sett, A. Yarin and B. Pourdeyhimi, Colloids Surf., A, 2015, 467, 31–45 CrossRef.
- J. Eric, O. Travis and P. Pearu, SciPy Open source scientific tools for Python, 2001.
- M. M. Nicolson, Math. Proc. Cambridge Philos. Soc., 1949, 45, 288–295 CrossRef.
- P. A. Kralchevsky and K. Nagayama, Adv. Colloid Interface Sci., 2000, 85, 145–192 CrossRef PubMed.
- N. Xue, S. Wu, S. Sun, D. Quéré and Q. Zheng, Langmuir, 2014, 30, 14712–14716 CrossRef PubMed.
- D. M. Kaz, R. McGorty, M. Mani, M. P. Brenner and V. N. Manoharan, Nat. Mater., 2012, 11, 138 CrossRef PubMed.
- A. L. Yarin, I. V. Roisman and C. Tropea, Collision Phenomena in Liquids and Solids, Cambridge University Press, 2017 Search PubMed.
- V. Liimatainen, M. Vuckovac, V. Jokinen, V. Sariola, M. J. Hokkanen, Q. Zhou and R. H. A. Ras, Nat. Commun., 2017, 8, 1798 CrossRef PubMed.
- P. A. Kralchevsky, N. D. Denkov and K. D. Danov, Langmuir, 2001, 17, 7694–7705 CrossRef.
- A. Doerr, S. Hardt, H. Masoud and H. A. Stone, J. Fluid Mech., 2016, 790, 607–618 CrossRef.
- P. Cicuta and D. Vella, Phys. Rev. Lett., 2009, 102, 138302 CrossRef PubMed.
- E. Jambon-Puillet, C. Josserand and S. Protière, Phys. Rev. Mater., 2017, 1, 042601 CrossRef.
- H. Janssen, Z. Ver. Dtsch. Ing., 1895, 39, 1045–1049 Search PubMed.
- T. S. Majmudar and R. P. Behringer, Nature, 2005, 435, 1079 CrossRef PubMed.
- C. Voivret, J. Y. Delenne, F. Radjai and M. S. El Youssoufi, Powders Grains 2009, 2009, 1145, 297–300 Search PubMed.
- O. Tsoungui, D. Vallet and J.-C. Charmet, Granular Matter, 1998, 1, 65–69 CrossRef.
- J. C. Geminard, L. Champougny, P. Lidon and F. Melo, Phys. Rev. E: Stat., Nonlinear, Soft Matter Phys., 2012, 85, 012301 CrossRef PubMed.
- Statistical Models for the Fracture of Disordered Media, ed. H. J. Herrmann and S. Roux, North-Holland, Amsterdam, 1990 Search PubMed.
- P. H. Winterfeld, L. E. Scriven and H. T. Davis, J. Phys. C: Solid State Phys., 1981, 14, 2361–2376 CrossRef.
- J. P. Clerc, G. Giraud, J. Roussenq, R. Blanc, J. P. Carton, E. Guyon, H. Ottavi and D. Stauffer, Ann. Phys., 1983, 8, 3–105 Search PubMed.
- P. Bollobas, B. Bollobás and O. Riordan, Percolation, Cambridge University Press, 2006 Search PubMed.
- A. M. Becker and R. M. Ziff, Phys. Rev. E: Stat., Nonlinear, Soft Matter Phys., 2009, 80, 041101 CrossRef PubMed.
Footnote |
| † Electronic supplementary information (ESI) available. See DOI: 10.1039/c8sm00653a |
| This journal is © The Royal Society of Chemistry 2018 |

