
 Open Access Article
 This Open Access Article is licensed under a Creative Commons Attribution-Non Commercial 3.0 Unported Licence
Hydrogen bonding and thermoplastic elastomers – a nice couple with temperature-adjustable mechanical properties†
Elisabeth
Wittenberg
 a,
Andreas
Meyer
a,
Steffen
Eggers
a and
Volker
Abetz
*ab
a,
Andreas
Meyer
a,
Steffen
Eggers
a and
Volker
Abetz
*ab
aDepartment of Physical Chemistry, University of Hamburg, Martin-Luther-King Platz 6, 20146, Hamburg, Germany. E-mail: volker.abetz@hzg.de
bHelmholtz-Zentrum Geesthacht, Zentrum für Material- und Küstenforschung GmbH, Institute of Polymer Science, Max-Planck-Straße 1, 21502 Geesthacht, Germany
First published on 19th March 2018
Abstract
Styrene–butadiene copolymers are modified with varying fractions of benzoic acid moieties being able to perform hydrogen bonding. This is done by using a simple synthetic approach which utilizes click chemistry. Temperature-dependent dynamic mechanical properties are studied, and it turns out that even the apparently rather simple hydrogen bonding motif has a marked impact on the material properties due to the fact that it facilitates the formation of a supramolecular polymer network. Besides a glass transition, the investigated functionalized copolymers exhibit a second endothermic transition, known as a quasi-melting. This is related to the opening of the hydrogen bonding complexes. Additionally to dynamic mechanical analysis (DMA), differential scanning calorimetry (DSC), temperature-dependent infrared (IR) spectroscopy and small angle X-ray scattering (SAXS) are used to understand the structure–property relationships.
1 Introduction
Supramolecular chemistry has become a permanently growing field over the last decades and has gained more and more scientific interest. In the 1960s, supramolecular chemistry was synthetically at the very beginning, until Charles Pedersen invented the synthesis of crown ethers and has by that made dynamic host–guest systems accessible.1 The modern understanding and concept of supramolecular chemistry was introduced by Jean-Marie Lehn afterwards.2 He defined it as “the chemistry of molecular assemblies”.In polymer science, supramolecular chemistry has received increasing attention since, amongst others, Meijer et al. demonstrated the advantages and variety of well-defined polymeric supramolecular structures and materials, using associating end groups in reversibly self-assembling polymer systems.3,4 Especially the variety of available non-covalent bonds which can be used to form transient connections and therefore supramolecular polymers and networks is nowadays large. This broad variety of different interactions includes π–π stacking,5,6 metal–ligand interactions,7–10 hydrophobic forces,11,12 electrostatic effects,13,14 and hydrogen bonding.4,15–20 Not only the functionalization of the precursor building blocks (telechelic units) for the polymer chains and networks is today synthetically quite feasible,21,22 but also the post modification of a polymer along the chain. This offers the possibility to tune the properties of the polymer23–27 and thus widens the range of potential applications eminently.26,28–31 For instance, the combination of thermoplastic polystyrene and elastomeric polybutadiene provides thermoplastic elastomers (TPEs) with the advantage of a good and adjustable balance between elasticity and rigidity in the resulting material.32 Though, the uncrosslinked rubber exhibits a rather low strength and elasticity.33,34 Many rubber applications hence require a crosslinking to obtain the needed material properties, as for example in tire rubber. Those crosslinks can be achieved either physically or chemically, while the chemical crosslinks are covalent and therefore usually irreversible.35 On the other hand, physical crosslinks, some examples of which have been mentioned above, are non-covalent and reversible. For instance, hydrogen bonds show temperature-dependent behavior; i.e., at elevated temperatures, the hydrogen bonds dissociate36 and the resulting material exhibits a lower viscosity and therefore a better processability.37 Reimund Stadler's group carried out pioneering works in this research area. They introduced hydrogen bonding moieties into elastomers using click chemistry, namely the “en” reaction of functionalized triazolinediones with polydienes.18–20,24,36,38–40
In this work, we present a possibility to modify styrene–butadiene copolymers (S–S/B–S) by introducing hydrogen bonding motifs along the chains, which leads to the formation of transient networks (Fig. 1). Compared to formerly investigated homopolymer systems,18–20 our copolymer system exhibits markedly improved mechanical properties. The choice of styrene–butadiene copolymers additionally allows for the adjustment of the glass transition temperature and hence for the control of the mechanical properties of the polymer. Furthermore, we establish a modification route which avoids the preparation of triazolinediones and facilitates the use of quite easily accessible compounds in a simple “click reaction” step. The whole three-step modification route consists of an epoxidation of the butadiene units with subsequent hydrolysis, followed by an esterification of the created alcohol with an alkyne-containing carboxylic acid, and ending up with a copper(I)-catalyzed azide–alkyne cycloaddition (“click reaction”, CuAAC) of the alkyne with an azide-bearing benzoic acid derivative, as has been reported elsewhere in more detail.17
 | ||
| Fig. 1 Illustration of the temperature-dependent dynamically crosslinked styrene–butadiene copolymer (blue lines) network. The crosslinks consist of hydrogen bonds (thick red lines) at low temperatures (left side) which are opened at an increased temperature (right side). | ||
The hydrogen bonds formed by the benzoic acid moieties show a temperature-switchable behavior. The latter is investigated using differential scanning calorimetry (DSC), Fourier-transform infrared (FTIR) spectroscopy, dynamic mechanical analysis (DMA), and small angle X-ray scattering (SAXS). Particularly the DMA allows for the identification of transitions corresponding to increased segmental backbone motions above the glass transition temperature (Tg), but is also very sensitive to other molecular motions.41 However, it is rather rarely discussed in literature regarding the investigation of hydrogen bonded polymer networks.
DMA is often used to precisely determine the Tg of polymers analyzing the loss tangent (tan![[thin space (1/6-em)]](https://www.rsc.org/images/entities/char_2009.gif) δ), which is the ratio of the loss modulus (G′′) and the storage modulus (G′). This is possible because tanδ shows a pronounced maximum at the Tg of the polymer.41–43 In those experiments (stated as temperature sweeps), G′ and G′′ are measured over temperature at low constant shearing frequencies, i.e. in the linear viscoelastic regime. Besides just determining Tg, there is also the possibility to observe additional transitions, such as the β transition or the liquid–liquid (ll) transition, which Bershtein et al. have identified as major additional transitions.44 Nevertheless, several other transitions occurring at temperatures lower than the Tg are known and described.41,44 They are caused by local translational motions on different length scales as well as by bending and stretching patterns.38
δ), which is the ratio of the loss modulus (G′′) and the storage modulus (G′). This is possible because tanδ shows a pronounced maximum at the Tg of the polymer.41–43 In those experiments (stated as temperature sweeps), G′ and G′′ are measured over temperature at low constant shearing frequencies, i.e. in the linear viscoelastic regime. Besides just determining Tg, there is also the possibility to observe additional transitions, such as the β transition or the liquid–liquid (ll) transition, which Bershtein et al. have identified as major additional transitions.44 Nevertheless, several other transitions occurring at temperatures lower than the Tg are known and described.41,44 They are caused by local translational motions on different length scales as well as by bending and stretching patterns.38
Specifically in semicrystalline polymers, a melting transition can be observed at temperatures higher than the Tg. A melting can be related to large-scale motions like chain slippage.41 On the contrary, in completely amorphous uncrosslinked polymers, a translational diffusion of polymers is enabled above the Tg, if a stress is applied at low frequencies. In some amorphous polymers, moreover, a ll transition appears also inside the rubbery plateau.41,45 Bershtein et al. have proposed that this may be considered as the quasi-melting of stable segmental associates on heating and the formation of stable segmental associates on cooling, respectively.44
Such additional ll transition in the rubbery plateau and its dependence on the presence of hydrogen bonding motifs as physical crosslinks is investigated in the present work. The results illustrate the impact of hydrogen bonds on the thermomechanical properties of polymer networks. By FTIR, the temperature-dependent interactions in these materials are additionally monitored. Thus, this manuscript provides valuable insights into temperature-dependent dynamic interactions of physical polymer networks and their impact on mechanical properties.
2 Experimental section
2.1 Materials and methods
Styroflex 2G66 (S–S/B–S) is a triblock copolymer with styrene end blocks and a random styrene–butadiene middle block, with a number-average molecular weight (Mn) of 134000 g mol−1, a dispersity (Đ) of 1.2 (Mn and Đ were determined via size-exclusion chromatography (SEC) in tetrahydrofuran (THF), calibrated with polystyrene (PS) standards), and a polybutadiene content of 53 mol% (determined by 1H NMR). It was gratefully received from BASF, Ludwigshafen, Germany.
Buna SBR2300 (S/B) is a random styrene–butadiene copolymer, with an Mn of 180000 g mol−1, a Đ-value of 2.2, and a polybutadiene content of 82 mol% (determined by 1H NMR). It was gratefully received from Arlanxeo, Cologne, Germany.
The modification of the samples was performed as reported elsewhere (see also ESI†).17
2.2 Characterization
000 Å) with crosslinked styrene–divinylbenzene (SDV) as stationary phase, SECcurity auto injector and an isocratic SECcurity pump. Two detectors were used for analysis: a refractive index detector and a UV-Vis detector, working at a wavelength of 260 nm. THF with toluene as an internal standard was used as eluent. The system was operating with a flow rate of 1.0 mL min−1 at 30 °C. The injection volume of the polymer solution (c = 1 g L−1) was 100 μL. The system was calibrated with narrowly distributed PS standards.
The temperature in the rheological measurements was controlled by the lower Peltier plate and a constant nitrogen gas stream into the sample chamber. Strain sweep experiments at a constant angular frequency of 1 rad s−1 were performed to locate the linear viscoelastic regime. Afterwards, frequency sweeps at temperatures from 40 °C to 90 °C and in a wide range of angular frequencies from 0.01 rad s−1 to 100 rad s−1 with a shear deformation of 0.15% were conducted. Temperature-dependent rheological measurements covering a temperature range from 120 °C to 20 °C with a cooling rate of 0.84 °C min−1 were conducted with a shear deformation of 0.15% and at an angular frequency of 1 rad s−1.
3 Results and discussion
3.1 Modification of styrene–butadiene copolymer
The three-step modification of the S–S/B–S was performed as reported earlier17 (details regarding the synthesis are provided in the ESI†) and resulted in a random distribution of benzoic acid moieties along the styrene–butadiene middle block (Fig. 2). In the first reaction step, an epoxidation of the double bonds with meta-chloroperbenzoic acid (mCPBA) was followed by the opening of the epoxide ring with hydrochloric acid. Steglich esterification of the hydroxyl functions with 4-pentynoic acid led to alkyne-functionalized polymer side groups. Finally, the benzoic acid moiety was introduced into the polymer via CuAAC using commercially available 4-azidobenzoic acid. Via this route, polymers with three different degrees of modification were synthesized (4%, 7% and 15% modification relative to the overall number of repeating units in the polymer) to investigate the impact of the degree of modification on the materials’ properties. The apparently rather low degrees of modification were targeted to maintain the elastomeric properties of the TPEs. To elucidate the impact of the PS end blocks, a “pure” styrene–butadiene copolymer (S/B) was modified via the described route and investigated as well. | ||
| Fig. 2 Structure of the modified samples (a) and representative SEC curves over all reaction steps for S–S/B–S-4 (b). Given in green is the first modification step ending up with a hydroxyl group, the structure and SEC curve from the alkyne functionalized species is depicted in pale red, and given in blue is the resulting carboxylic acid modified polymer. The unmodified sample is shown in black. | ||
In Fig. 2, the principle structure of the modified polymers as well as SEC curves recorded after each reaction step are given exemplarily for S–S/B–S-4 (1H NMR spectra are given in the ESI†). In Table 1, the used and synthesized polymer samples, their characteristic SEC data as well as their degrees of modification are listed. It should be noticed, though, that Mn and Đ were determined via SEC with PS standards, and these values are therefore of relative rather than absolute nature. The reason is that the polarity of the polymer is increased significantly by the modification. Hence, column interactions of the polar side groups occur, which lead to a shift of the SEC trace to lower Mn and moreover causes higher Đ values. This becomes particularly significant for the highly modified sample S–S/B–S-15. It was therefore necessary to add 1.5 vol% acetic acid to the mobile phase THF to suppress these interactions as much as possible. Furthermore, the degree of modification is given in Table 1. It was determined by integrating the aromatic styrene peak as well as the occurring peak of the triazole proton.
| Sample | M n [kg mol−1] | Đ | Degree of modification [%] |
|---|---|---|---|
| a S–S/B–S-15 displayed significant column interactions. THF + 1.5 vol% acetic acid was therefore used as mobile phase to suppress these interactions as much as possible. | |||
| S–S/B–S | 134 | 1.2 | — |
| S–S/B–S-4 | 159 | 1.8 | 4 |
| S–S/B–S-7 | 158 | 1.9 | 7 |
| S–S/B–S-15a | 148 | 1.5 | 15 |
| S/B | 180 | 2.2 | — |
| S/B-8 | 180 | 2.8 | 8 |
3.2 DMA and DSC
DSC was conducted to locate the Tg of the polymers. In Fig. 3 and Table 2, it can be seen that the values of the glass transition temperatures of the random middle block are below 20 °C for all samples. This glass transition should therefore not interfere with the ll transition of interest in our DMA experiments. Such additional endothermic first-order transition is related to the opening of the introduced hydrogen bonds (quasi-melting) and therefore to the collapse of the supramolecular network.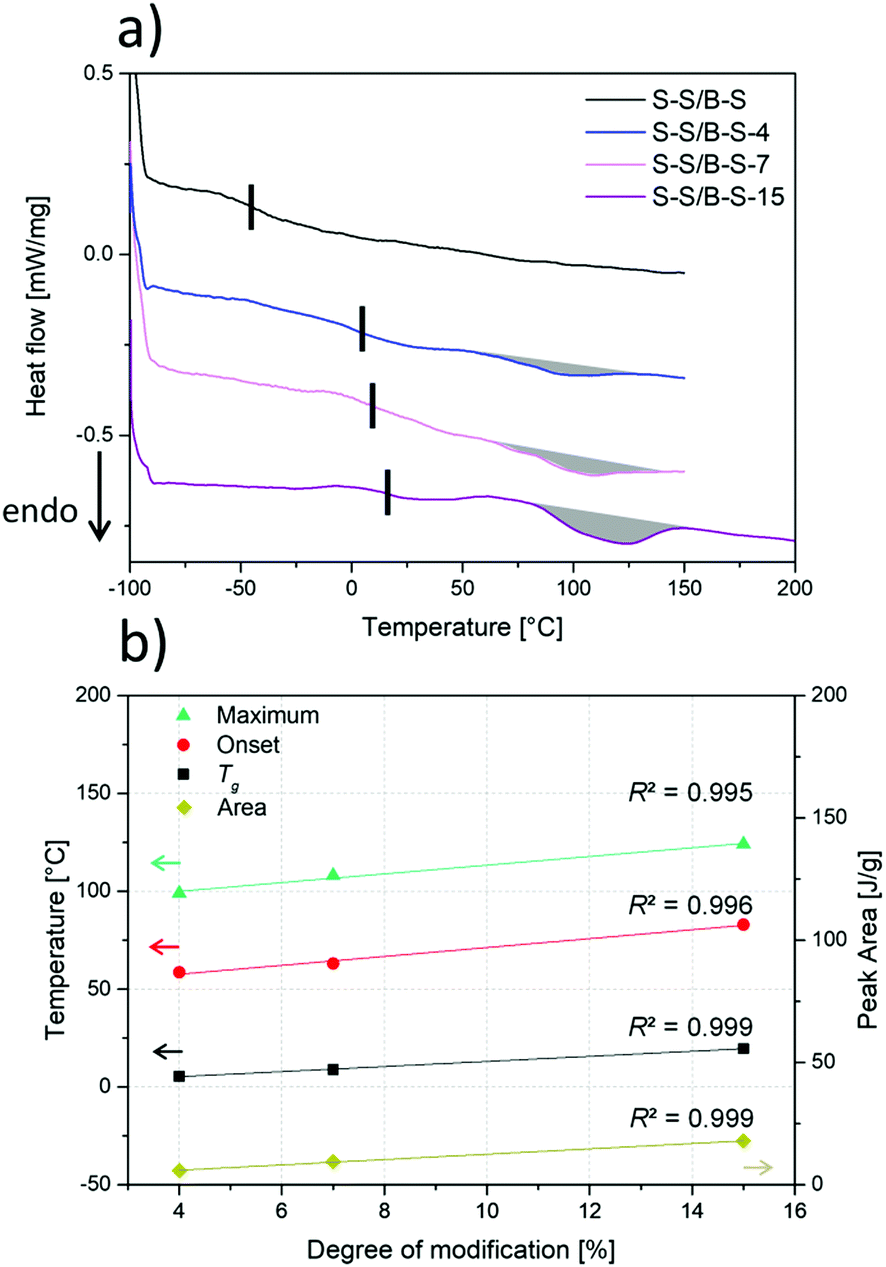 | ||
| Fig. 3 (a) DSC measurements of the polymers with different functionalization degrees are shown. The curves are vertically shifted. The vertical black lines mark the glass transition temperature on the left side, and the endothermic peak on the right is marked by grey shading. (b) Linear dependence of the glass transition temperature, of the onset of the endothermic peak, of its peak maximum as well as of the peak area on the degree of modification. The quality of the fits is indicated by the regression coefficient (R2). | ||
| Sample | Glass transition temperature [°C] | Onset peak [°C] | Peak maximum [°C] | Peak area [J g−1] |
|---|---|---|---|---|
| S–S/B–S | −44 | — | — | — |
| S–S/B–S-4 | 5 | 59 | 99 | 5.8 |
| S–S/B–S-7 | 9 | 63 | 108 | 9.4 |
| S–S/B–S-15 | 20 | 83 | 124 | 17.9 |
In former works,17,38 similar endothermic transitions have been reported and discussed, too. Since pristine S–S/B–S does not show this endothermic transition we can conclude that it is not related to a “real” melting of the polymer (i.e., to the dissociation of crystallites built by polymer segments) but to melting of aggregates of the carboxylic side chains by opening of the hydrogen bonds. We can additionally figure out that the pristine S–S/B–S exhibits only one glass transition temperature at −43.6 °C. No glass transition temperature of the polystyrene end blocks at about 100 °C48 is observed in our DSC measurements.
Fig. 3 depicts the linear dependence of the glass transition temperature of the modified samples, of the onset of the ll transition, as well as of its peak maximum and area on the degree of modification. Apparently, it is possible to adjust the glass transition temperature as well as the temperature at which the hydrogen bonds start to dissociate over a wide temperature range by the presented functionalization strategy. In addition to that, we found the slope of the Tg, peak onset, peak maximum as well as peak area to be almost identical.
DMA is an additional, very precise method for the identification of glass transition temperatures. However, also further transitions can be investigated. Temperature sweeps were conducted at a constant frequency of 1 rad s−1 and a shear strain of 0.15% (to be in the linear viscoelastic region, see below). All measurements were conducted in a temperature range higher than the Tg of the polymers (120–20 °C), they are depicted in Fig. 4. In the first column of Fig. 4, the storage modulus G′ and the loss modulus G′′ of each functionalized polymer are shown in comparison to the unmodified S–S/B–S or S/B, respectively. At low temperatures (ca. 20–60 °C), it can be clearly seen that a higher degree of modification results in a higher storage modulus as well as loss modulus. This indicates an increase in rigidity which can be related to the introduced hydrogen bonds replacing the double bonds of the butadiene units. It can also be observed that the storage modulus and the loss modulus strongly increase by cooling from ca. 100 °C to 20 °C. This behavior is more pronounced having more hydrogen bonds in the supramolecular network. Thus, the introduction of potential hydrogen bonding sites causes significantly greater values for the storage modulus G′ and the loss modulus G′′ at low temperatures (ca. 20–60 °C) and, the other way around, significantly lower values for the storage modulus G′ and the loss modulus G′′ at elevated temperatures (higher than 60 °C). By this, we can directly observe the opening of the hydrogen bonds and hydrogen bond formation, respectively, as a function of temperature. Similar results have for instance been reported by Qiu et al.49 for azido polyurethane elastomers. The second column of Fig. 4 displays tanδ as a function of temperature. Even at measurement temperatures exceeding the Tg of the analyzed polymers, the rheological experiments still reveal a prominent maximum in tanδ for the modified samples. This suggests the existence of an additional transition inside the rubbery plateau that is not associated to the Tg but to the introduced hydrogen bonds. This additional ll transition upon cooling is caused by the formation of stable associates which are in our case formed by hydrogen bonds.44 Also the unmodified S–S/B–S sample shows a maximum in the tanδ function at 80 °C, which is related to the α transition of the PS block. The overlay of the α transition of PS block with the ll transition of the modified random block caused by hydrogen bonds complicates the analysis. Therefore, a modified random styrene–butadiene copolymer (S/B-8) without any PS end blocks was investigated for comparison. The tanδ function of the unmodified S/B exhibits no prominent maximum in between 20 °C and 120 °C. In contrast to that, also the tanδ function of S/B-8 exhibits a clear maximum at ca. 60–90 °C which can be attributed to an ll transition. By this we can prove that the latter is independent from the (glass) transitions of the PS block.
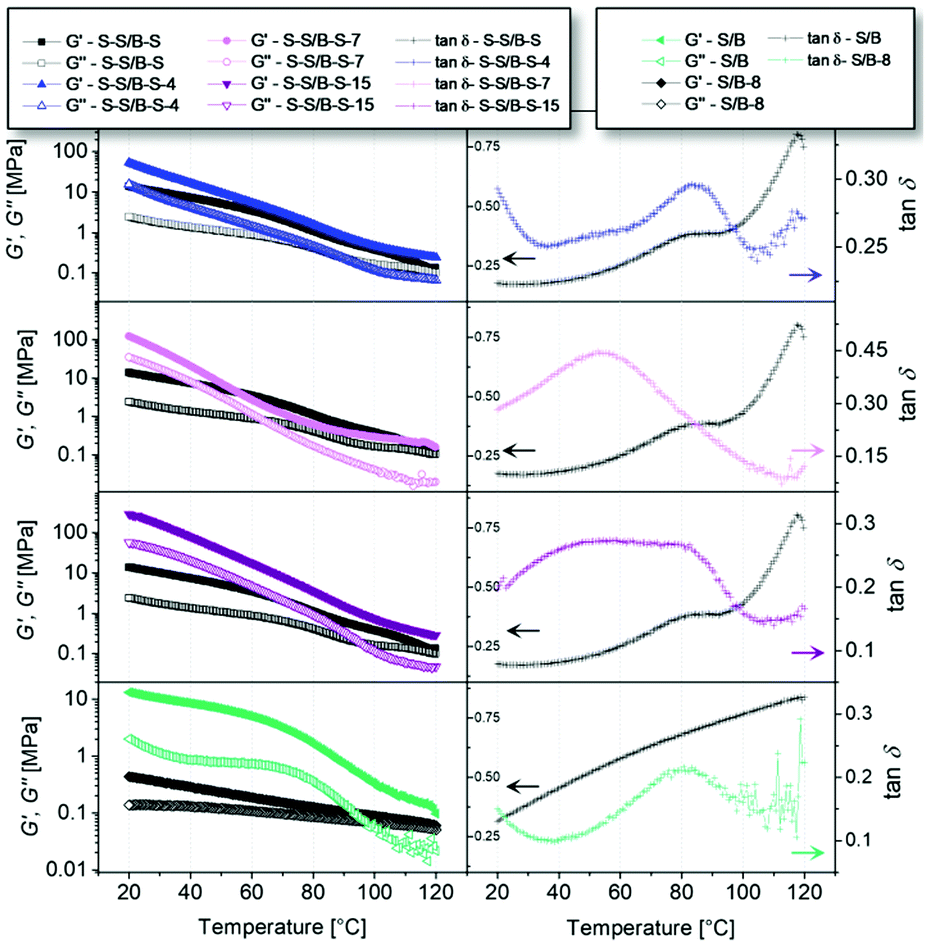 | ||
| Fig. 4 The first column shows the storage modulus as well as the loss modulus of the modified styrene–butadiene copolymers in comparison to the unfunctionalized ones. Black squares depict the results for the unfunctionalized S–S/B–S, blue triangles the ones for the 4% modified (top), pink circles for the 7% modified (2nd from top) and purple triangles for the 15% modified S–S/B–S (2nd from bottom). The diamonds represent the unmodified S/B, while the green horizontal triangles represent the 8% modified S/B (bottom). The filled symbols represent the storage moduli while the open symbols represent the loss moduli. In the second column, the corresponding tanδ is shown. Indicated in black are the values for the unfunctionalized S–S/B–S (top three images) and S/B (bottom), respectively, in blue the 4% modified (top), in pink the 7% modified (2nd from top), in purple the 15% modified sample (2nd from bottom) and in green the 8% modified S/B (bottom). All measurements were conducted at a frequency of 1 rad s−1 and at a shear strain of 0.15% (0.1% for the S/B-8). | ||
Besides the just discussed temperature sweeps, also frequency sweeps were conducted to investigate the impact of the hydrogen bonds. In contrast to temperature sweeps, frequency sweeps can be used to gain additional information about rubbery-elastic characteristics and the entanglement density. For that, it is essential to localize the linear viscoelastic regime. This is due to the fact that frequency sweeps are solely meaningful in regions where the viscoelastic properties are independent of imposed stress or strain levels. To locate the linear viscoelastic regime, dynamic oscillation measurements (“strain sweeps”) were carried out in which the level of shear strain was increased while the frequency was kept constant. In Fig. 5, those strain sweeps of the pristine S–S/B–S as well as of the modified samples are shown. Measurements were conducted at a constant frequency of 1 rad s−1 and at 40 °C (Fig. 5a) and 90 °C (Fig. 5b). These temperatures are chosen as representative temperatures at which the hydrogen bonding complex of the benzoic acid moieties and hence the dynamic network is intact (40 °C) or dissociated (90 °C). Making sure to be within the linear viscoelastic regime in the following frequency sweep measurements at both temperatures and for all samples, the limiting shear strain appears to be 0.15%. This can be seen in the strain sweep of the 15% modified S–S/B–S sample at 40 °C which exhibits a decreasing storage modulus at higher strains.
 | ||
| Fig. 5 Strain (γ) sweeps of the unfunctionalized S–S/B–S (black line), 4% modified (blue line), 7% modified (pink line) and 15% modified (purple line) S–S/B–S are presented. The solid lines represent the storage moduli and the dotted lines represent the loss moduli. Measurements were conducted at a constant frequency of 1 rad s−1 and at 40 °C (a) and 90 °C (b). | ||
In Fig. 6, the frequency sweeps of all samples are shown. The first column displays the results of the measurements at 40 °C, and the second column displays the ones of the measurements at 90 °C. Styroflex 2G66 is a high molecular weight (Mn ≈ 134 kg mol−1) styrene–butadiene copolymer, and therefore the almost horizontal data of the frequency sweeps at temperatures higher than the Tg of the random block correspond to its entanglement plateau. This is furthermore proven by the master curve of this polymer (ESI†). Over the whole frequency range and for both temperatures (40 °C and 90 °C), the storage modulus G′ is higher than the loss modulus G′′ which indicates a predominantly elastic behavior of the polymer samples even at low frequencies, where polymer chains tend to reptate usually causing an increasingly viscous behavior under these low-frequency conditions.50
 | ||
| Fig. 6 Rheological measurements of unfunctionalized S–S/B–S (black squares), 4% modified (blue triangles), 7% modified (pink circles) as well as 15% modified (purple triangles) S–S/B–S. The filled symbols represent the storage moduli (top), the open symbols display the loss moduli (bottom). In the first column, the experiments performed at 40 °C are shown, in the second column, the experiments performed at 90 °C are shown. All measurements were conducted at a shear strain of 0.15% (see Fig. 5). | ||
The values of G′ and G′′ continuously increase with the frequency for all samples over the whole frequency range. At 40 °C, moreover, G′ and also G′′ of the modified samples are significantly increased in comparison to Styroflex 2G66. This is a consequence of the hydrogen bond formation, resulting in the presence of an intact dynamic network and hence in an increased rigidity of the sample. This is supported by the DSC measurements in which the opening of the hydrogen bonds can be observed at temperatures higher than 60 °C.
At 90 °C, the values of G′ are comparable in between the unmodified S–S/B–S as well as the 4% and 7% modified sample. Only the G′ values for the 15% modified sample are significantly higher. This leads to the conclusion that at 90 °C the hydrogen bonds are mostly opened in the less modified samples, which is supported by the DSC and temperature-dependent IR measurements (see below). The higher amount of hydrogen bonds in the 15% modified sample results in a more entangled network which still lasts to a high extent even at 90 °C, giving higher values for G′ and G′′ in comparison to pristine Styroflex 2G66. Calculating the entanglement molecular weight Me51,52 at 90 °C provides support for this conclusion:
 | (1) |
δ function52 (see Fig. 7). Using eqn (1) to determine Me (of pristine S–S/B–S and 15% modified sample) at 90 °C results in Me (S–S/B–S) = 4000 g mol−1 and Me (S–S/B–S-15) = 1200 g mol−1. The value for the pristine S–S/B–S is quite reasonable considering that it is a butadiene-rich styrene–butadiene copolymer, since a typical value for Me (PS) is 17000 g mol−153 and for Me (polybutadiene) 2200 g mol−1.53 Also the calculation of the Me from the master curve of S–S/B–S (ESI†) provides a value of Me (S–S/B–S) = 4000 g mol−1, which is in very good agreement with the value found in the frequency sweep at 90 °C. From all this, we can see that the Me of 15% modified S–S/B–S is roughly by a factor of 3–4 lower than Me (S–S/B–S). Thus, between two entanglements the average molecular weight is much smaller for 15% modified S–S/B–S, and thus we can conclude that the network caused by hydrogen bonds is still intact to a high degree even at this high temperature. Also these results are supported by the DSC measurements. However, the values of G′ and G′′ for 4% as well as 7% modified samples are slightly below the ones of the pristine S–S/B–S. The entanglement molecular weight is, according to this, higher, which means that the polymer network is less entangled in S–S/B–S-4 and S–S/B–S-7 than the original S–S/B–S. The hydrogen bonding complexes are dissociated and the network is looser in these low-modified samples. An explanation for this phenomenon is the modification itself. The value of the plateau modulus G0N is related to the packing length of the polymer species which is higher for the modified units (which are comparable with polyvinylacetate) than polybutadiene. This leads to the fact that Me of the modified units is higher in comparison to the unmodified polybutadiene units. Thus, the observation of a slightly lower value of G0N for the modified species (S–S/B–S-4 and S–S/B–S-7) is related to the increased packing length and therefore the increased entanglement molecular weight.
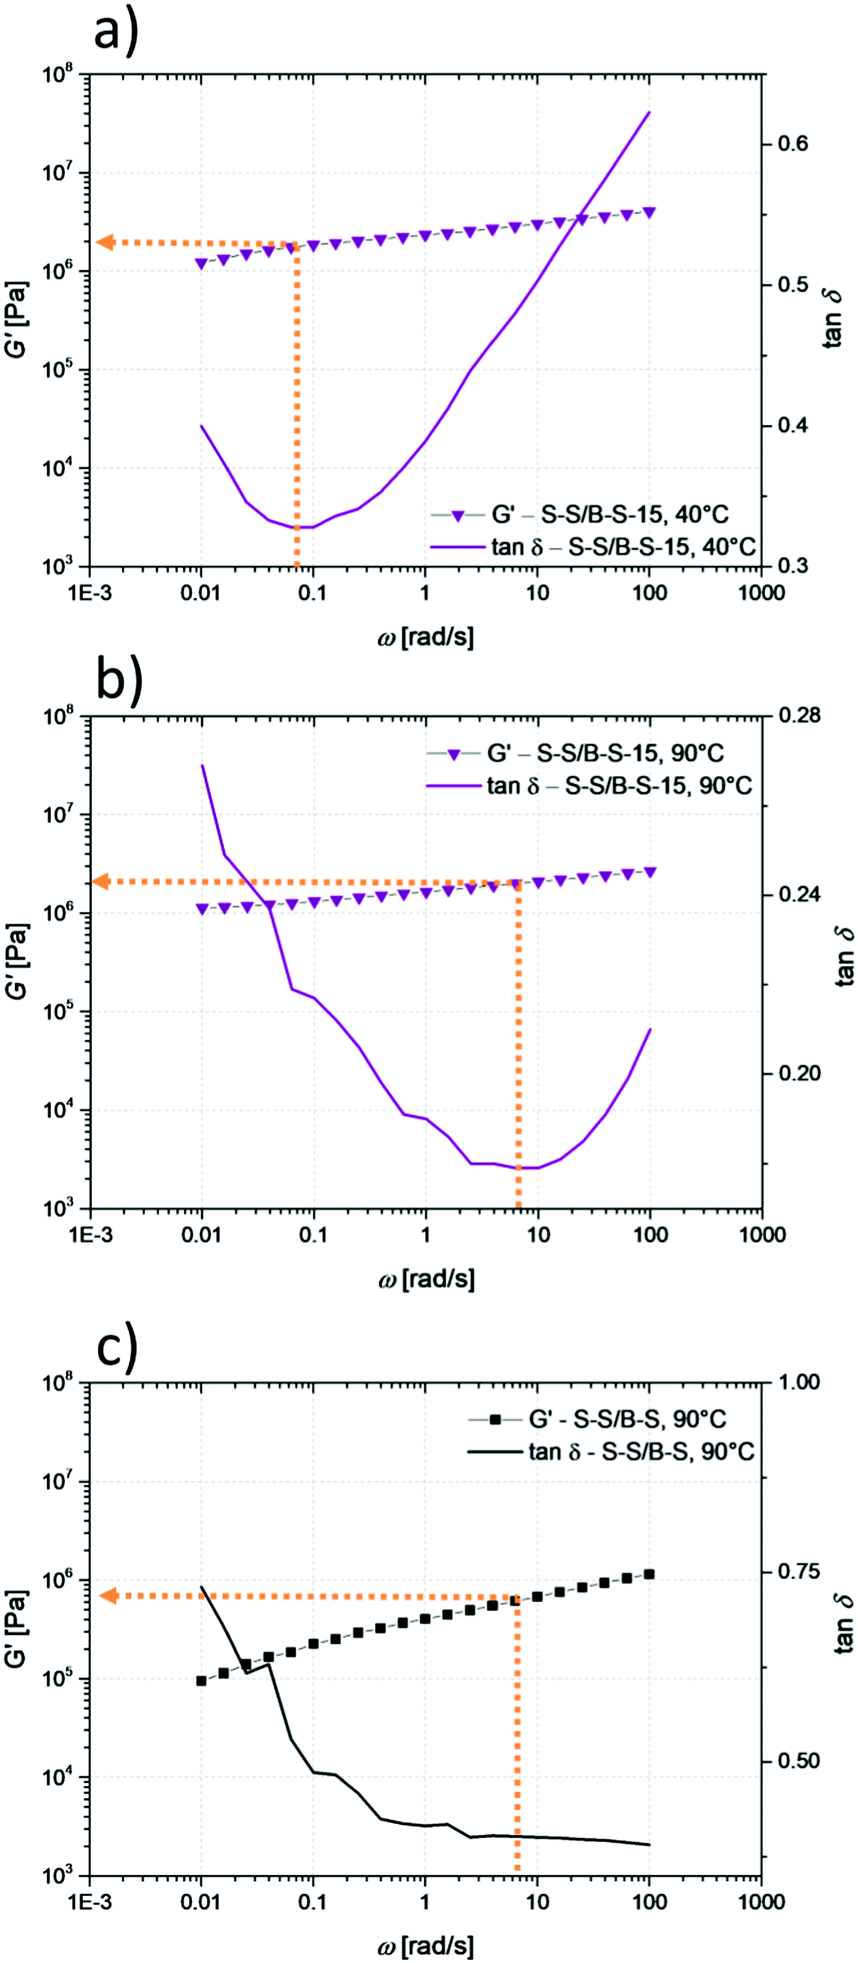 | ||
| Fig. 7 Determination of G0N as the G′ value at the frequency ω of the local minimum of the corresponding tanδ function for 15% modified S–S/B–S at 40 °C (a), at 90 °C (b) and for pristine S–S/B–S at 90 °C (c). | ||
Stimulated by Stadler's works, Leibler et al.54 developed a “sticky reptation model” to describe the increase of the plateau modulus by the formation of hydrogen bonds in dynamic polymer networks, both in height and in time. The hydrogen bonds therefore increase the reptation time of the polymer chains. When the hydrogen bonds are all opened (e.g. at high temperatures) or can relax the applied strain (e.g. on long time scales), the modulus of the modified and unmodified material is almost the same (as it is the case for our low-modified systems, see above). By applying Leibler's model, the fraction of closed, effective hydrogen bonds can be calculated from the difference of the polymer's modulus in the closed and opened state. Such calculation is presented in the ESI,† Section 2.1. According to this calculation, interestingly, it appears that with increasing modification degree the fraction of closed hydrogen bonds at 40 °C decreases from 60% for S–S/B–S-4 to 24% for S–S/B–S-15. However, the average total number of closed hydrogen bonds per chain still increases from 42 to 63 for the same samples, resulting in the higher plateau modulus of the latter. Also Stadler39 made the observation that with increasing modification degree the fraction of complexed units is less than predicted from thermodynamic calculations for low molecular weight systems. As a reasonable explanation, topological restrictions caused by the polymer chain itself were given. This suggests that there is a critical modification degree above which a further increase in modification degree has no additional strengthening effect. It might be worth to investigate this further in future works.
3.3 FTIR-spectra
As reported earlier,17,36,40 temperature-dependent FTIR spectroscopy is a powerful tool to investigate the hydrogen-bonding-related complexation processes of carboxylic acid groups. It has already been discussed above that hydrogen bonding complexes show temperature-dependent behavior, meaning the appearance of associated (‘complexed’) species at ambient temperatures and of dissociated (‘free’) species at elevated temperatures. In Fig. 8, the temperature-dependent FTIR measurements of two modified samples (S–S/B–S-7 and S–S/B–S-15) are shown. Upon investigation of the carbonyl stretching vibrations, three distinct signals can be identified. It can be clearly distinguished between the bands of the free species at 1738 cm−1 and the complexed species at 1700 cm−1 and 1685 cm−1.17,36 The signal at 1700 cm−1 is attributed to the dimeric complex whereas the signal at 1685 cm−1 is assigned to complex superstructures like trimers or even higher associates. The band at 1738 cm−1 originates from the ester group adjacent to the main chain (see Fig. 2) and overlaps with the vibration from the free carboxylic acid species. To circumvent this issue, the FTIR spectra were also recorded for the polymer after the second modification step (Steglich esterification, no carboxylic acid groups present) and the band of the ester group was afterwards subtracted from the overlapping band of the free species and the ester group.17 Therefore, the spectra were normalized to an unaffected band of the phenyl ring vibration at 700 cm−1.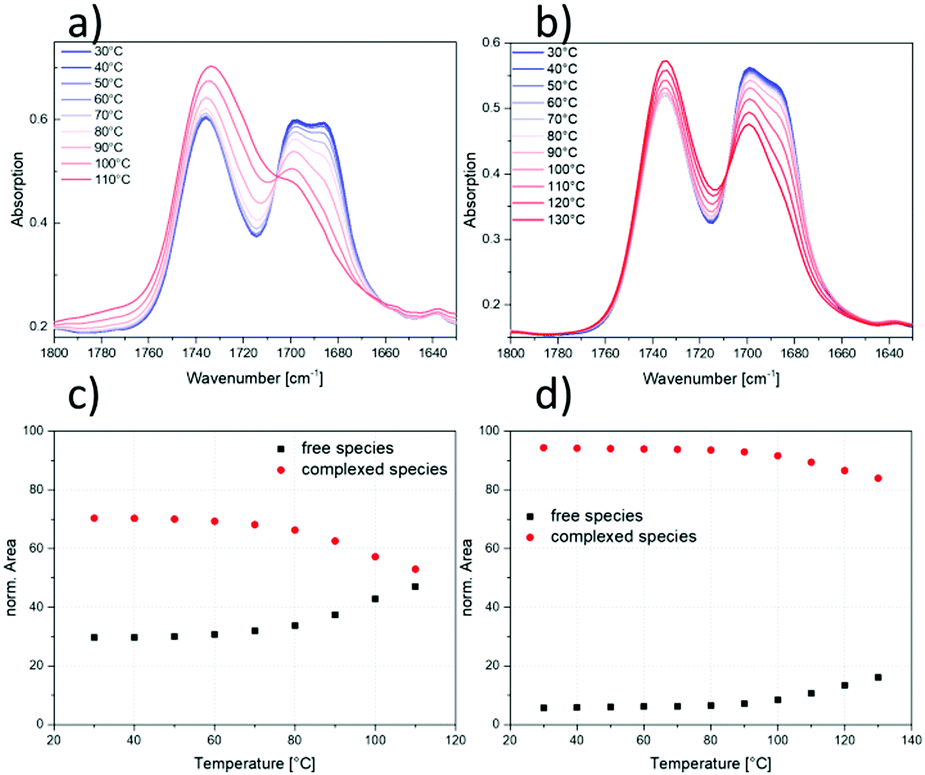 | ||
| Fig. 8 Zoom into the carbonyl vibration bands of the FTIR spectra of S–S/B–S-7 (a) and S–S/B–S-15 (b). The temperature dependence of the carbonyl stretching vibration is shown in a temperature range from 30 °C to 110 °C (a) and 30 °C to 130 °C (b), respectively. In both spectra, the isosbestic point at 1706 cm−1 and 1708 cm−1, respectively, can be determined clearly. Integrated and normalized peak areas after subtraction of the integral area of the ester group are plotted as a function of temperature for S–S/B–S-7 (c) and S–S/B–S-15 (d). The black squares show the increase of the peak area with temperature for the free species, while the red circles show the decrease of the peak area with temperature for the complexed species. | ||
In the shown spectra, the temperature dependence of the stretching vibrations can be seen very clearly. At ambient temperatures, the signal of the complexed species is generally more pronounced, which is in contrast to elevated temperatures at which this signal significantly decreases in favor of the signal of the free species. All of the modified samples exhibit an isosbestic point. This describes one particular spot in the overlapping bands that is independent of temperature. The presence of an isosbestic point suggests an equilibrium between two distinct states and also the validity of the Lambert–Beer's law.36,55 In this case, the equilibrium is established between the complexed and free benzoic acid species. In Fig. 8c and d, the integrated and normalized IR peak areas for the lower modified and the higher modified sample, respectively, are plotted as a function of temperature. Interestingly, the temperature at which the cleavage of the carboxylic acid dimers starts differs between the samples with lower and higher modification degrees. While for S–S/B–S-7 the signal for the complexed species is significantly reduced at the final temperature of 110 °C, it is still clearly visible for S–S/B–S-15 even at 130 °C. This, once more, indicates the strength of the networks in the latter. Moreover, the FTIR experiments indicate that the dissociation process already starts at 60–70 °C in sample S–S/B–S-7, while the dissociation onset occurs about 20 °C higher in the more modified sample S–S/B–S-15. These observations are in good agreement to those found in the DSC and DMA measurements discussed above. The comparison of the plateau modulus G0N of S–S/B–S-15 at 40 °C and 90 °C (see Fig. 7) reveals an almost uninfluenced value of Me ≈ 1200 g mol−1 by the temperature increase. Accordingly, the network of the higher modified sample appears stable also at 90 °C which is found in the FTIR measurements as well while the lower modified S–S/B–S-7 is significantly influenced at 90 °C which results in a more opened up structure and therefore a looser network.
3.4 SAXS measurements
The above described temperature-dependent effects are also studied by SAXS measurements. In Fig. 9, the obtained SAXS data at ambient temperatures for all modification degrees are depicted. Two effects can be directly observed in the measurements conducted at ambient temperature: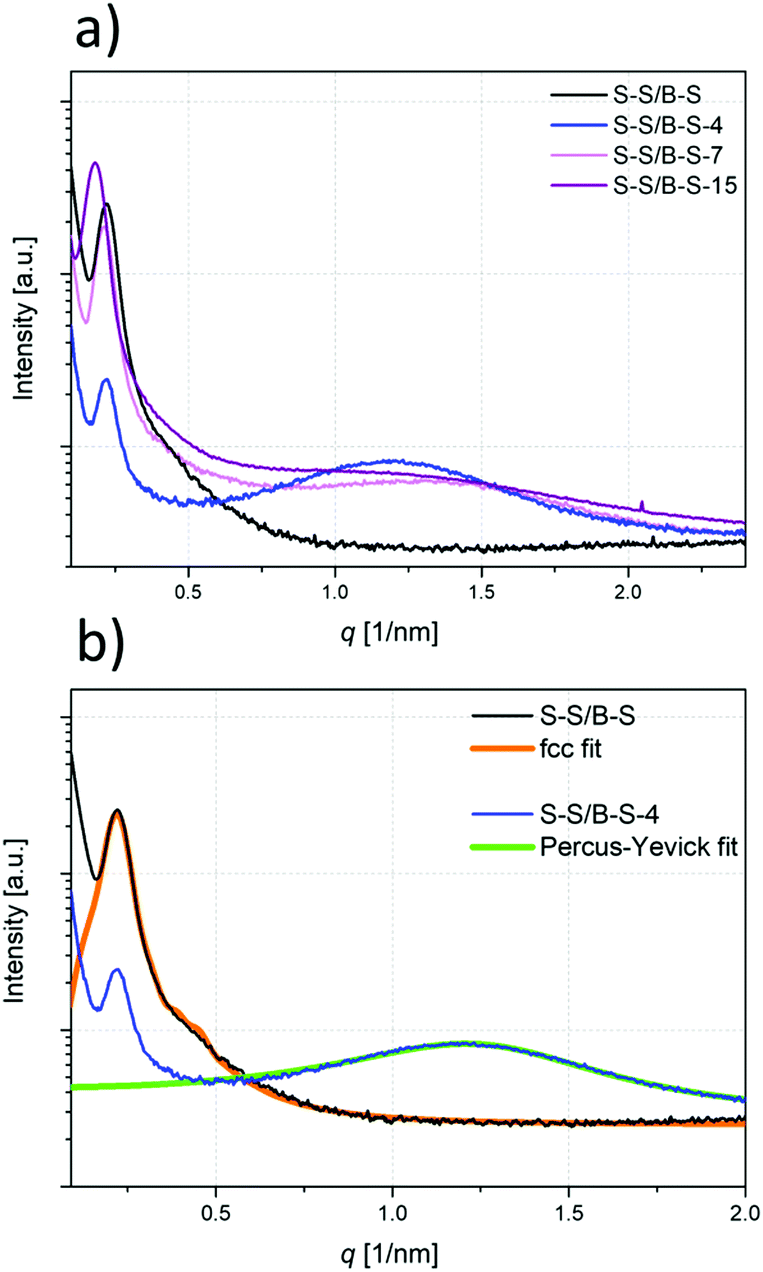 | ||
| Fig. 9 SAXS measurements at 30 °C for pristine S–S/B–S and the modified samples are shown in (a), and the fcc fit function of the curve of the pristine S–S/B–S and the Percus–Yevick fit function of the curve of S–S/B–S-4 are shown in (b). | ||
As known from literature,56,57 S–S/B–S tends to phase separate and depicts a spherical morphology in which the random styrene–butadiene middle block forms the matrix and the short PS end blocks form spheres. In the SAXS measurements, the primary scattering peak maximum originating from these PS spheres is located at q = 0.22 nm−1, and a higher order scattering peak appears as a shoulder (see Fig. 9). The presence of the higher order peak indicates a relatively well-ordered microphase separation. Using the fcc (Fm3m) model to fit the obtained data in good agreement leads to the conclusion that the polystyrene spheres are about 20–30 nm in diameter and have an average centre-to-centre distance of about 32 nm.
Besides the spherical morphology, an additional scattering maximum at higher q values appears in the curves of the modified samples which indicate some further kind of microphase separation with very small dimensions (Fig. 9a). This additional regular structure can be attributed to polar domains within the nonpolar styrene–butadiene matrix caused by the modification. Such additional scattering maximum can be well-described by the Percus–Yevick58 sphere model assuming a nearly spherical shape for the polar domains (Fig. 9b). Depending on the degree of modification, the centre-to-centre distance ranges from 4.6 nm for S–S/B–S-4 to 3.2 nm for S–S/B–S-15, while the radius of the domain is just increasing slightly with degree of modification from 1.7 nm for S–S/B–S-4 to 2.1 nm for S–S/B–S-15. At first glance, the radius of the polar domain of S–S/B–S-15 (2.1 nm) is in contrast to the centre-to-centre distance of 3.2 nm. Due to the high degree of modification the domains start to overlap which means a loss of the regular structure. This can be clearly observed by the decrease of the second scattering maximum at higher degrees of modification. In total, the radius of the domains is in very good agreement with the calculated value assuming that one side group constitutes the radius of the spherical domain. The calculated radius of such polar domain is about 1.52 nm using the presumably thermodynamically favored conformation of the side chain (ESI†). Not included in this calculation is the distance between two carboxylic acid groups building the complex, which is about 0.27 nm.59 Half the distance must therefore be added to the calculated radius of the side group. Thus, the calculated radius of the polar domain is r = 1.66 nm, which is in very good agreement to the found radii of roughly 2 nm.
In addition to the measurements at ambient temperatures, also temperature-dependent measurements were performed (Fig. 10). With increasing temperature, a decrease of both scattering maxima occurs. Similar effects have already been described and discussed by Hilger et al.20 and other groups.60–62 The presence of hydrogen bonding complexes at ambient temperatures and the disappearance of these complexes at elevated temperatures is a very reasonable explanation for this trend. Intact complexes between the polar side groups favor phase separation which is lost upon the opening of these complexes. Accompanying the decrease of the scattering maximum caused by the polar domains with temperature, the peak maximum furthermore shifts to smaller q values indicating an increase in sphere size. In contrast, the centre-to-centre distance is decreasing with temperature (see Table 3). This suggests that the hydrogen bonds inside the polar domains are lengthened with temperature, which is a result of the fact that they become weaker. Also the primary scattering peak maximum decreases with temperature which goes back to the decreasing tendency of the system to phase separate, as the system approaches the order–disorder transition. That is to say, the PS spheres are no longer present at elevated temperatures but the PS blocks are blended with the styrene–butadiene matrix.
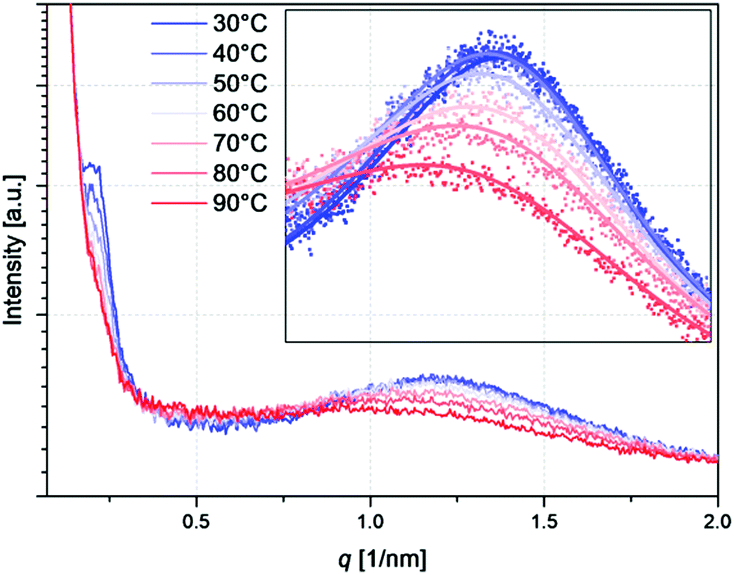 | ||
| Fig. 10 Temperature-dependent SAXS measurements of S–S/B–S-4. As an inlay, the measured data points are shown together with the corresponding fits obtained via the Percus–Yevick model. | ||
| Temperature [°C] | Centre-to-centre distance of polar domains [nm] | Radius of polar domains [nm] |
|---|---|---|
| 30 | 4.48 | 1.43 |
| 40 | 4.50 | 1.45 |
| 50 | 4.48 | 1.46 |
| 60 | 4.44 | 1.47 |
| 70 | 4.32 | 1.49 |
| 80 | 4.24 | 1.52 |
| 90 | 4.22 | 1.53 |
4 Conclusions
The (rather slight) modification of styrene–butadiene copolymers with relatively simple hydrogen bonding motifs results in significantly enhanced mechanical properties of the obtained polymers. These motifs consist of benzoic acid functions, forming dimers at low temperatures which are dissociated upon a temperature increase. In particular, the temperature-dependent storage and loss modulus of the polymer are influenced substantially by those modifications, even at overall modification degrees of only 15% (that is to say, the enhanced mechanical properties can be achieved at a quite low expense of material and hence at rather low costs).An additional ll transition inside the rubbery plateau was found by performing dynamic mechanical analyses. This additional transition is caused by inter- and intrachain hydrogen bonds and shows the formation of stable associates upon cooling below the hydrogen bond dissociation temperature. The analysis of frequency sweeps leads to the conclusion that the hydrogen bonding complexes build up a transient network at temperatures below ca. 60 °C, while at 90 °C the hydrogen bonding complexes are dissociated for relatively low degrees of modification (4% and 7%), almost reverting the mechanical properties to the ones of the initial, unmodified elastomeric material. The dissociation results in a slightly looser network for the low-modified styrene–butadiene copolymer samples in comparison to the pristine styrene–butadiene copolymer at high temperatures, while both storage and loss modulus are increased if hydrogen bonds are formed at low temperatures. In case of a higher degree of modification (15%), the network is still intact even at 90 °C which leads to a higher value of the storage modulus G′ and loss modulus G′′ compared to the original material up to temperatures above 100 °C. These findings are supported by DSC and temperature-dependent FTIR measurements in which cleavage temperatures are found to be at 60 °C as well as 90 °C. Theoretical calculations, using the model developed by Leibler et al.,54 lead to the conclusion that the fraction of closed hydrogen bonds decreases with the modification degree while the total number of complexes still increases. These results are also in agreement with considerations by Stadler39 on topological restrictions occurring in long polymer chains functionalized with thermoreversibly interacting functional groups. In SAXS measurements, the cleavage of the hydrogen bond complex can be observed by the disappearance of spherical polar domains.
The investigated modified TPEs exhibit beneficial materials properties regarding an either increased or decreased rigidity in comparison to the original polymers, depending on the applied temperature. This can be a useful feature for applications that require thermoplastic elastomeric behavior and temperature-switchable properties at the same time.
Conflicts of interest
There are no conflicts to declare.Acknowledgements
V. A. expresses his deep thanks to Reimund Stadler for many discussions on stickers in elastomers during the years in Freiburg and Mainz. The authors thank Claudia Carvalho de Almeida and Marcel Kröger (University of Hamburg) for performing syntheses. We gratefully acknowledge financial support from the German Research Foundation (DFG) via SFB986 ‘‘M3”, project A2. S. E. acknowledges financial support of the Fonds der Chemischen Industrie (FCI).Notes and references
- C. J. Pedersen, J. Am. Chem. Soc., 1967, 89, 2495–2496 CrossRef CAS.
- J.-M. Lehn, Pure Appl. Chem., 1978, 50, 871–892 CrossRef CAS.
- T. Aida, E. W. Meijer and S. I. Stupp, Science, 2012, 335, 813–817 CrossRef CAS PubMed.
- R. P. Sijbesma, F. H. Beijer, L. Brunsveld, B. J. B. Folmer, J. H. K. K. Hirschberg, R. F. M. Lange, J. K. L. Lowe and E. W. Meijer, Science, 1997, 278, 1601–1604 CrossRef CAS PubMed.
- S. Burattini, B. W. G. Greenland, D. H. M. Merino, W. W. Weng, J. Seppala, H. M. Colquhoun, W. Hayes, M. E. Mackay, I. W. Hamley and S. J. Rowan, J. Am. Chem. Soc., 2010, 132, 12051–12058 CrossRef CAS PubMed.
- S. Burattini, B. W. Greenland, W. Hayes, M. E. Mackay, S. J. Rowan and H. M. Colquhoun, Chem. Mater., 2011, 23, 6–8 CrossRef CAS.
- S. C. Grindy, R. Learsch, D. Mozhdehi, J. Cheng, D. G. Barrett, Z. Guan, P. B. Messersmith and N. Holten-Andersen, Nat. Mater., 2015, 14, 1210–1217 CrossRef CAS PubMed.
- Y. Kobayashi, Y. Takashima, A. Hashidzume, H. Yamaguchi and A. Harada, Sci. Rep., 2013, 3, 1–4 Search PubMed.
- R. Dobrawa and F. Würthner, J. Polym. Sci., Part A: Polym. Chem., 2005, 43, 4981–4995 CrossRef CAS.
- H. Hofmeier and U. S. Schubert, Chem. Soc. Rev., 2004, 33, 373–399 RSC.
- G. Bellapadrona and M. Elbaum, Nano Lett., 2016, 16, 6231–6235 CrossRef CAS PubMed.
- Y. Gao, J. Hao, J. Wu, X. Zhang, J. Hu and Y. Ju, Nanoscale, 2015, 7, 13568–13575 RSC.
- G. V. Oshovsky, D. N. Reinhoudt and W. Verboom, J. Org. Chem., 2006, 71, 7441–7448 CrossRef CAS PubMed.
- A. Duarte, M. Slutsky, G. Hanrahan, C. M. Mello and G. C. Bazan, Chemistry, 2012, 18, 756–759 CrossRef CAS PubMed.
- T. Mes, M. M. E. Koenigs, V. F. Scalfani, T. S. Bailey, E. W. Meijer and A. R. A. Palmans, ACS Macro Lett., 2012, 1, 105–109 CrossRef CAS.
- W. Binder and R. Zirbs, Hydrogen Bonded Polymers, Springer-Verlag, Heidelberg, 2007 Search PubMed.
- E. Wittenberg and V. Abetz, Polymer, 2017, 121, 304–311 CrossRef CAS.
- C. Hilger and R. Stadler, Makromol. Chem., 1991, 192, 805–817 CrossRef CAS.
- C. Hilger and R. Stadler, Polymer, 1991, 32, 3244–3249 CrossRef CAS.
- C. Hilger and R. Stadler, Macromolecules, 1992, 25, 6670–6680 CrossRef CAS.
- T. Yan, K. Schroter, F. Herbst, W. H. Binder and T. Thurn-Albrecht, Sci. Rep., 2016, 6, 32356 CrossRef PubMed.
- T. Yan, K. Schröter, F. Herbst, W. H. Binder and T. Thurn-Albrecht, Macromolecules, 2014, 47, 2122–2130 CrossRef CAS.
- U. Seidel, J. Hellman, D. Schollmeyer, C. Hilger and R. Stadler, Supramol. Sci., 1995, 2, 45–50 CrossRef CAS.
- R. Stadler, M. M. Jacobi and W. Gronski, Makromol. Chem., Rapid Commun., 1983, 4, 129–135 CrossRef CAS.
- J. Yuan, N. ten Brummelhuis, M. Junginger, Z. Xie, Y. Lu, A. Taubert and H. Schlaad, Macromol. Rapid Commun., 2011, 32, 1157–1162 CrossRef CAS PubMed.
- L. Wu, H. Ma, Q. Wang, L. Li, Y. Wang and Y. Li, J. Mater. Sci., 2014, 49, 5171–5181 CrossRef CAS.
- R. Tanaka, Y. Kasai, M. Shinzawa, Z. Cai, Y. Nakayama and T. Shiono, Macromol. Chem. Phys., 2014, 215, 888–892 CrossRef CAS.
- S. van der Heijden, K. De Bruycker, R. Simal, F. Du Prez and K. De Clerck, Macromolecules, 2015, 48, 6474–6481 CrossRef CAS.
- J. Albuerne, A. B.-d. Fierro, C. Abetz, D. Fierro and V. Abetz, Adv. Eng. Mater., 2011, 13, 803–810 CrossRef CAS.
- S. Ribeiro, P. Costa, C. Ribeiro, V. Sencadas, G. Botelho and S. Lanceros-Méndez, Composites, Part B, 2014, 67, 30–38 CrossRef CAS.
- S. Chernyy, S. Ullah, G. Jomaas, R. R. Leisted, P. A. Mindykowski, J. B. Ravnsbæk, S. W. Tordrup and K. Almdal, Eur. Polym. J., 2015, 70, 136–146 CrossRef CAS.
- P. Sonntag, P. Hoerner, A. Cheymol, G. Argy, G. Riess and G. Reiter, Nat. Mater., 2004, 3, 311–315 CrossRef CAS PubMed.
- Y. Shangguan, J. Yang and Q. Zheng, RSC Adv., 2017, 7, 15978–15985 RSC.
- P. Cordier, F. Tournilhac, C. Soulie-Ziakovic and L. Leibler, Nature, 2008, 451, 977–980 CrossRef CAS PubMed.
- P. Michael, D. Döhler and W. H. Binder, Polymer, 2015, 69, 216–227 CrossRef CAS.
- L. d. L. Freitas, C. Auschra, V. Abetz and R. Stadler, Colloid Polym. Sci., 1991, 259, 566–575 Search PubMed.
- F. Herbst, D. Dohler, P. Michael and W. H. Binder, Macromol. Rapid Commun., 2013, 34, 203–220 CrossRef CAS PubMed.
- C. Hilger and R. Stadler, Makromol. Chem., 1990, 191, 1347–1361 CrossRef CAS.
- R. Stadler, Macromolecules, 1988, 21, 121–126 CrossRef CAS.
- R. Stadler and L. d. L. Freitas, Polym. Bull., 1986, 15, 173–179 CrossRef CAS.
- K. P. Menard, Dynamic mechanical analysis – a practical introduction, CRC Press LLC, Florida, 1999 Search PubMed.
- K. Xu, F. Zhang, X. Zhang, Q. Hu, H. Wu and S. Guo, J. Mater. Chem. A, 2014, 2, 8545–8556 CAS.
- C.-C. Peng and V. Abetz, Macromolecules, 2005, 38, 5575–5580 CrossRef CAS.
- V. A. Bershtein, V. M. Egorov, L. M. Egorova and V. A. Ryzhov, Thermochim. Acta, 1994, 238, 41–73 CrossRef CAS.
- A. M. Lobanov and S. Y. Frenkel, Polym. Sci. USSR, 1979, 22, 1150–1163 CrossRef.
- S. Förster, L. Apostol and W. Bras, J. Appl. Crystallogr., 2010, 43, 639–646 CrossRef.
- S. Förster, A. Timmann, M. Konrad, C. Schellbach, A. Meyer, S. S. Funari, P. Mulvaney and R. Knott, J. Phys. Chem. B, 2005, 109, 1347–1360 CrossRef PubMed.
- J. Rieger, J. Therm. Anal., 1996, 46, 965–972 CrossRef CAS.
- S. Qiu, X. Gan, C. Gao, X. Zheng, H. Yu and H. Fan, J. Polym. Sci., Part B: Polym. Phys., 2006, 44, 2841–2851 CrossRef CAS.
- C. Otto, U. A. Handge, P. Georgopanos, O. Aschenbrenner, J. Kerwitz, C. Abetz, A.-L. Metze and V. Abetz, Macromol. Mater. Eng., 2017, 302, 1600405 CrossRef.
- Y. Lv, Y. Lin, F. Cheg, F. Li, Y. Shangguan and Q. Zheng, RSC Adv., 2015, 5, 44800–44811 RSC.
- C. Liu, J. He, E. v. Ruymbeke, R. Keunings and C. Bailly, Polymer, 2006, 47, 4461–4479 CrossRef CAS.
- L. J. Fetters, D. J. Lohse, D. Richter, T. A. Witten and A. Zirkel, Macromolecules, 1994, 27, 4639–4647 CrossRef CAS.
- Ludwik Leibler, Michael Rubinstein and R. H. Colby, Macromolecules, 1991, 24, 4701–4707 CrossRef CAS.
- H. L. Schlafer and O. Kling, Angew. Chem., 1956, 68, 667–670 CrossRef CAS.
- K. Knoll and N. Nießner, Macromol. Symp., 1998, 132, 231–243 CrossRef CAS.
- R. Lach, R. Adhikari, R. Weidisch, T. A. Huy, G. H. Michler, W. Grellmann and K. Knoll, J. Mater. Sci., 2004, 39, 1283–1295 CrossRef CAS.
- J. K. Percus and G. J. Yevick, Phys. Rev., 1958, 110, 1–13 CrossRef CAS.
- C. Emmeluth, M. A. Suhm and D. Luckhaus, J. Chem. Phys., 2003, 118, 2242–2255 CrossRef CAS.
- C.-C. Cheng, J.-H. Wang, W.-T. Chuang, Z.-S. Liao, J.-J. Huang, S.-Y. Huang, W.-L. Fan and D.-J. Lee, Polym. Chem., 2017, 8, 3294–3299 RSC.
- A. Noro, M. Hayashi and Y. Matsushita, Soft Matter, 2012, 8, 6416 RSC.
- M. E. Seitz, W. R. Burghardt, K. T. Faber and K. R. Shull, Macromolecules, 2007, 40, 1218–1226 CrossRef CAS.
Footnote |
| † Electronic supplementary information (ESI) available: Synthesis details, 1H NMR spectra, master curves, calculation of closed fraction, calculation of linker length. See DOI: 10.1039/c8sm00296g |
| This journal is © The Royal Society of Chemistry 2018 |