 Open Access Article
Creative Commons Attribution 3.0 Unported Licence
Microfluidic solvent extraction of poly(vinyl alcohol) droplets: effect of polymer structure on particle and capsule formation†
W. N.
Sharratt
 a,
A.
Brooker
b,
E. S. J.
Robles
 b and
J. T.
Cabral
 *a
*a
aDepartment of Chemical Engineering, Imperial College London, London SW7 2AZ, UK. E-mail: j.cabral@imperial.ac.uk
bProcter & Gamble, Newcastle Innovation Centre, Newcastle-Upon-Tyne, NE 12 9TS, UK
First published on 26th April 2018
Abstract
We investigate the formation of poly(vinyl alcohol) microparticles by the selective extraction of aqueous polymer solution droplets, templated by microfluidics and subsequently immersed in a non-solvent bath. The role of polymer molecular mass (18–105 kg mol−1), degree of hydrolysis (88–99%) and thus solubility, and initial solution concentration (0.01–10% w/w) are quantified. Monodisperse droplets with radii ranging from 50 to 500 μm were produced at a flow-focusing junction with carrier phase hexadecane and extracted into ethyl acetate. Solvent exchange and extraction result in droplet shrinkage, demixing, coarsening and phase-inversion, yielding polymer microparticles with well-defined dimensions and internal microstructure. Polymer concentration, varied from below the overlap concentration c* to above the concentrated crossover c**, as estimated by viscosity measurements, was found to have the largest impact on the final particle size and extraction timescale, while polymer mass and hydrolysis played a secondary role. These results are consistent with the observation that the average polymer concentration upon solidification greatly exceeds c**, and that the internal microparticle porosity is largely unchanged. However, reducing the initial polymer concentration to well below c* (approximately 100×) and increasing droplet size yields thin-walled (100's of nm) capsules which controllably crumple upon extraction. The symmetry of the process can be readily broken by imposing extraction conditions at an impermeable surface, yielding large, buckled, cavity morphologies. Based on these results, we establish robust design criteria for polymer capsules and particles, demonstrated here for poly(vinyl alcohol), with well-defined shape, dimensions and internal microstructure.
Introduction
Polymeric particles and capsules are versatile functional materials with applications ranging from cosmetics and personal care to coatings,1–4 photonics and drug delivery.5–8 Generally, these are formed by templating liquid droplets in emulsions or suspensions and subsequent polymerization of monomers,9via a plethora of routes, or by physically or chemically inducing a liquid–solid transition in droplets of pre-formed polymer solutions, as for instance in spray drying.10 The rapid development of microfluidic techniques,11 has opened attractive routes for precise and reproducible emulsification, including multiple and hierarchical emulsions.12,13 In turn, these have led to a multitude of novel approaches for particle formation: including by UV polymerisation and lithography,14,15 interfacial polymerisation,16 complexation,17–19 gelation,16,20 and supramolecular assembly,21 detailed in a comprehensive book and numerous reviews.12,22–26 Amongst these, solvent extraction and phase inversion of polymer solutions within droplets provides a facile, versatile, and high-throughput approach for particle and capsule formation. In short, polymer solution droplets are initially suspended within an immiscible carrier phase, and subsequently extracted by immersion in a selective solvent. This extraction (or ‘solvent displacement’) removes solvent from the droplet, leading to a concentration of the polymer ‘solute’ and eventual particle or capsule formation.Despite its simplicity, the process provides remarkable control of particle size and internal microstructure, but also shape and encapsulation and release properties. This control is, however, predicated on the thermodynamics of the ternary (or quaternary) system, comprising the polymer, solvent, extraction solvent (and carrier), and a range of transport and demixing processes.
Solvent extraction and phase inversion are extensively employed in the manufacture of polymeric membrane sheets,27,28 and the process shares many features with droplet extraction, in terms of demixing, coarsening and directional solidification in a ternary (or higher) system comprising a polymer, solvent and non-solvent.29 Droplet extraction is also reminiscent of the rapid precipitation of polymer solutions by ‘flash nanoprecipitation’ whereby opposing jets of a dilute polymer solution and non-solvent impinge at high Reynolds number, yielding rapid (turbulent) mixing and precipitation of nanoparticles (typically 10s–100s nm) of polymer, copolymers and composites,30–32 within ms timescales. By contrast, templating polymer solutions in droplets prior to extraction results in typical solidification timescales of seconds to minutes (and even hours), depending primarily on the partial miscibility of solvent and non-solvent system, and initial droplet size and concentration. Typical particle sizes are 10s to 100s of μm and exhibit a smooth polymer-rich skin. Their internal microstructure is largely controlled by the Péclet number, describing the relative timescales of shrinkage of the droplet interface and diffusion of solute(s) within, as well as internal convection and recirculation, and demixing and coarsening processes. The latter are triggered by the ingress of non-solvent and concentration of solute during droplet shrinkage. External flow has been shown to spatially modulate the rate of solvent extraction process causing droplets to depart from sphericity and form a range of anisotropic, dimpled and toroidal structures.33,34 Droplet extraction provides thus a powerful and versatile platform for the precise fabrication of polymeric particles and capsules.
We have previously examined the role of droplet size, polymer solution concentration and non-solvent extraction medium, during the investigation of the formation of porous polyelectrolyte microparticles,35,36 and proposed a justification for the resulting internal microstructure by a demixing pathway. Scaling relationships between the initial droplet size and polymer concentration and the resulting extraction timescales, particle dimensions and internal porosity were obtained, and a descriptive model introduced. Tuning the relative timescales for kinetic arrest and internal demixing, with concentration and non-solvent quality, was shown to provide effective control over the particle internal porosity. Recently, we have reported the formation polymer-colloid capsules with a variety of morphologies, controlled primarily by the respective component concentrations. We demonstrated that when dissolved, capsules with bicontinuous structures, accessed via a spinodal pathway, afforded a pulsed release profile of colloidal clusters over tuneable timescales.
The purpose of current paper is to investigate, for the first time, the role of polymer molecular mass (Mw) and solubility, given by the degree of hydrolysis, as well as droplet solution viscosity in the particle and capsule formation process. We select poly(vinyl alcohol) (PVA) as a model system for this study, since it is a water-soluble, biodegradable,37 neutral polymer, and extensively used as a barrier, coating and packaging material. Three PVA Mw and two degrees of hydrolysis are examined. Their overlap c* and concentrated crossovers c** are determined from viscometry to define a range of representative polymer concentrations and viscosities of interest. We map the dependence of extraction timescales and resulting particle dimensions on polymer structure, initial concentration and droplet size.
Materials and methods
Materials
Hexadecane (ReagentPlus, ≥99%), toluene (anhydrous, 99.8%), octadecyltrichlorosilane (≥90%), ethyl acetate (anhydrous, 99.8%), and sorbitan mono-oleate (Span®80) were obtained from Merck. Acetone, ethanol, and isopropyl alcohol (all AnalaR, Normapur®) were obtained from VWR International and NOA 81 (thiolene-based photoresist) was purchased from Norland Products, USA. All reagents were used as received. Poly(vinyl alcohol) (PVA) with average Mw = 18, 40 and 105 kg mol−1 and degree of hydrolysis = 87–89 and 99% was used as received (Sigma Aldrich no. 363170, 348406, 363073, 363138, 363081 and 363146). Deionized water was obtained from a Centra ELGA filtration system.Sample preparation
Aqueous PVA solutions were prepared at 80 °C and 95 °C for, respectively 88% and 99% degree of hydrolysis, until full dissolution (up to 24 h, for the highest Mw and degree of hydrolysis) under constant agitation. Water evaporation during dissolution was measured and accounted for in the final solution concentration. All samples were used within 24 h, to minimise well-known ageing phenomena.38–41Viscosity
Polymer solution viscosity was measured with a Brookfield DV-I prime viscometer, fitted with LV spindles and UL adapter, in a Couette geometry, at 25.0 ± 0.5 °C. Readings were taken after equilibration for 3 minutes and at spindle speeds between 0.3 and 60 RPM – corresponding to shear rates of 0.2 to 73.4 s−1. Except for high concentration samples (>15% w/w), all solutions exhibited Newtonian behaviour. Specific viscosities were calculated as ηsp = ηsolution/ηH2O − 1. The overlap concentration (c*)42 was estimated empirically by ηsp(c*) = 1. This has been shown to yield values commensurate with values determined experimentally by dilute solution specific viscosities measurements fitted with the Huggins relation.43,44 The transition from the semi-dilute regime, characterised by the viscosity scaling law ηsp ∝ c1.3, to the concentrated regime, with ηsp ∝ c3.9–4.2, was determined by intersection of fits to the data with these scaling laws. Uncertainties in c* and c** were estimated by concentrations compatible with maximum and minimum power law fits to the data within the relevant concentration regime (retaining a coefficient of variation R2 > 0.9).Microfluidics
Microfluidic devices were fabricated by thiol–ene closed-face photopolymerization as previously described,45 placing optical adhesive NOA81 between two glass slides followed by UV-A exposure.46 The channels were treated with a solution (10% v/v) of OTS in toluene and rinsed with toluene, isopropanol, ethanol and air dried before use. A flow-focussing geometry was used for emulsion droplet generation with microchannel dimensions: 400 μm height, 450 μm outlet channel width and a constriction width of 200 μm. The fluids were injected via syringe pumps (Harvard Apparatus PHD2000) with flow rates ranging from 1–100 μL min−1. Water in oil (W/O) droplets and plugs were generated with 100–500 μm radii by controlling dispersed and continuous phase flow rates. The dispersed phase consisted of an aqueous PVA solution (≈0.01–10% w/w) whilst the continuous phase comprised non-ionic surfactant Span®80 (up to 2.5% v/v) in hexadecane, to prevent droplet coalescence at collection. Tubing attached to the outlet channel immersed the droplets produced into a large bath (25 mL) of non-solvent ethyl acetate.Imaging and characterisation
The microdevice was mounted on a motorised XY stage (Prior Scientific) of an inverted microscope (Olympus IX71) fitted with a CCD camera (Allied Vision, Manta G-235). Images were acquired at frame rates between 0.02 and 45 s−1, calibrated with a stage micrometer (Olympus, 0.01 mm OBX) and analysed using open source software (ImageJ). Selected particles and capsules were also imaged by Scanning Electron Microscopy (SEM) using a JEOL (JSM 6010LA) and Zeiss (Gemini Sigma300) microscopes in secondary electron imaging mode. Particles were dried for 24 h, both intact and sectioned, and coated with a 10 nm chromium layer prior to imaging.Results and discussion
Microfluidic droplet generation and ex situ extraction
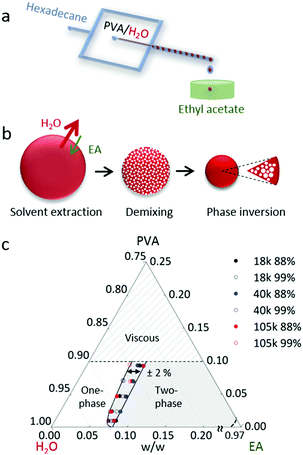
A schematic of the formation of aqueous PVA solution droplets within a hydrocarbon carrier phase, hexadecane (HD), is depicted in Fig. 1a. Ethyl acetate (EA) was used as the extraction solvent due to its partial miscibility with water, full miscibility with the carrier phase and its non-solvency for the polymer. Initial solution viscosities ranged from 1 to 1800 mPa s and, at the higher viscosities (>100 mPa s), droplet generation was found to depart from the ‘squeezing’ regime,47 which resulted in higher dispersity. For the droplet sizes and polymer concentrations investigated, the timescales of extraction were significantly longer (up to several min) than typical residence times in our linear microchannels (≤5 s) at these flow rates and we thus opted to carry out droplet extraction ex situ, by immersion into a large non-solvent bath. The volume of the bath exceeded the total droplet volume by approximately 1000 times, thus preventing non-solvent saturation with water, and in turn inadvertent deviations of mutual solvent diffusion at the interface affecting drop shrinkage.48The particle formation pathway is illustrated in Fig. 1b. This mechanism is expected to be general to ternary (or quaternary) systems, comprising polymer, solvent and selective solvent (and carrier), which fit the following criteria: the ‘solvent’ and ‘selective’ (or extraction) solvent are partially miscible, whilst the polymer is soluble in the ‘solvent’ but not in the ‘selective’ solvent, and the selective solvent is completely miscible with the carrier. For the PVA/H2O/EA/(HD) system investigated here, once the aqueous PVA solution droplets are immersed into EA, the selective extraction solvent, the droplet shrinks and thus the polymer concentration increases. However, these solvents are partially miscible and whilst the flux of water exiting the droplet dominates, EA is also exchanged at the interface. This non-solvent ingress induces demixing and phase coarsening within the polymer solution droplet. The ternary phase behaviour of mixtures of PVA, H2O and EA is shown in Fig. 1c. As shown in the phase diagram, droplet shrinkage alone (along the PVA-H2O composition line) does not cross the two-phase boundary. The simultaneous extraction of solvent and phase separation results in a series of demixing steps, in a cascade along the stability line. Eventually, as only the solvent is removed from the droplet, the polymer-rich phase becomes majority and phase inversion takes place. This phase preferentially enriches the droplet interface leading to skin formation and kinetic arrest, upon further water removal. Droplets with appropriate polymer concentration (quantified below) thus yield polymer particles with a smooth surface and microporous internal structure. For the PVA samples investigated here, with Mw ranging from 18 to 105 kg mol−1 and 88–99% hydrolysis, the phase boundary remains largely invariant, within ±2% w/w of solvent composition for all samples measured, indicating that solvent/non-solvent interaction dominate phase stability. At room temperature, the solubility of EA in water is ≈9% and the solubility of water in EA is ≈3% w/w.49
A representative time series of the droplet extraction process upon immersion into non-solvent, measured by optical microscopy, is shown in Fig. 2. The top row shows the gradual reduction in droplet radius over time, R(t), and evolution of refractive index contrast until a polymer particle is formed, at extraction time τ. The bottom row provides higher magnification images of the internal droplet structure during extraction, resolving the demixing and coarsening processes induced by the ingress of non-solvent. Nucleation and growth is the dominant demixing process for the conditions studied, evidenced by the gradual appearance of small droplets which undergo internal convection and coarsening within the large droplet, as extraction proceeds. While resolving the extraction pathway is complex, since it involves two phases within the droplet and the external medium, as well as spatio-temporally evolving concentration profiles, the droplet evidently undergoes a cascade of demixing and extraction steps, expected to take place along the phase boundary and thus nucleation should be the favoured mechanism. The characteristic size of a late-stage demixed structure in liquid droplets, estimated by microscopy, and that of a dried microparticle, observed by SEM (Fig. S1, ESI†), agree well; yielding ≈3 μm for a ≈200 μm radius particle, shown here. Our observations with PVA solutions qualitatively agree with previous work on NaPSS and nanoparticle composites.50
PVA solution viscosity
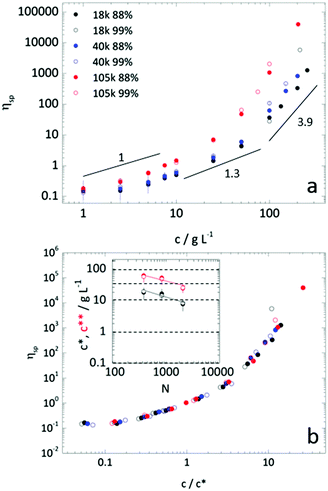
In addition to solution thermodynamics, one might expect droplet extraction to depend on the polymer structure (Mw and hydrolysis). We have therefore measured the dynamic viscosities for all six samples, as a function of concentration, and removed the contribution of solvent to the viscosity to afford specific viscosity values, as shown in Fig. 3a. The crossovers between dilute and semi-dilute, c*, and then concentrated regimes, c**, were estimated by the changing power laws of the viscosity dependence on concentration, as discussed above. The behaviour is compatible with scaling predictions for neutral polymers in a good solvent.42 Evidently, increasing concentration and polymer Mw increases solution viscosity. Increasing degree of hydrolysis, from 88 and 99%, also increases PVA solution viscosity,51 up to a factor of 2, in particular for the higher Mw and above c**. For this narrow hydrolysis range, c* and c** were unchanged, within measurement uncertainty, in agreement with previous work.52,53 Likely due to sample polydispersity, c** was found to be approximately 3–4 greater than c*, below the factor ≈10 expected.44 Specific viscosity data are plotted by rescaled concentration (c/c*) in a master curve in Fig. 3b, and the dependence of c* and c** with degree of polymerization N are shown in inset. Representative polymer solution concentrations, indicated by the horizontal dashed lines at 100, 40, 1, 0.1 and 0.01 g L−1, were then selected for droplet extraction to examine the possible impact of solution regimes and relation to c* and c** in particle or capsule formation.Parameterisation of the extraction process
Fully modelling the droplet radius–time R(t) relation is a complex moving boundary reaction–diffusion problem.54,55 While the classical Epstein–Plesset theory of droplet dissolution assumes Fickian diffusion and expects R ∼ t1/2,56 and the Hixson–Cromwell model for solid particle dissolution yields linear kinetics,57 larger powers can also occur (in superdiffusion processes). In droplet extraction, in addition to dissolution, internal convection, phase separation and inversion, interfacial tension and polymer enrichment at the surface are all expected to play a role in the shrinkage profile. We therefore employ a minimal descriptive model, introduced previously,35,36,50 to parameterise droplet shrinkage and particle formation: | (1) |
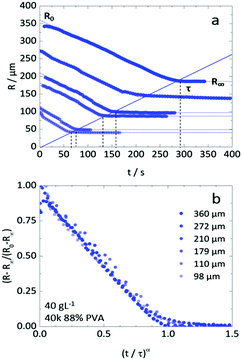 | ||
Fig. 4 (a) Droplet radius plotted as a function of extraction time for representative 40 g L−1 PVA (40k 88%) solution droplets of various initial size. A descriptive model (eqn (1)) was fitted to the data to parametrise the extraction process. The initial droplet radius (R0), final particle radius (R∞) and extraction time (τ) are indicated for the largest droplet. The solid line indicates a linear dependence of τ on initial droplet size given by τ ≈ (0.77 ± 0.01)R0. (b) Rescaled data plotted  against against  , as expected from eqn (1). , as expected from eqn (1). | ||
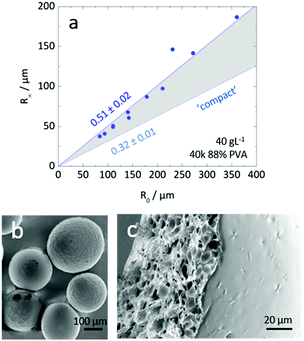
Inspection of final particle sizes and available polymer mass (of known density)60 in the initial solution indicates that the resulting particles are not compact and must contain void volume. Fig. 5a presents the dependence of the final particle radius R∞ on initial droplet radius R0 for 40k 88% PVA solutions. The expectation of particle size based on mass is also given, indicating that particles contain approximately 1 − (0.3/0.5)3 ≈ 75% void volume. Fig. 5b shows the relatively smooth external polymer layer of the particles, while Fig. 5c shows an image of a dried cross-sectioned particle, exhibiting considerable internal porosity. As depicted in Fig. 1b, this internal microstructure arises due to the ingress of non-solvent and consequent demixing, coarsening and kinetic arrest of the phase-separated structure. Under the conditions employed, the particles exhibit a smooth polymer skin, which is compatible with an effective Péclet number for the extraction process,  , stemming from the accumulation of polymer at the receding front (where the polymer diffusion coefficient is approximated by Stokes–Einstein in water and up to c*). While the formation of a skin is expected from the rapid extraction process, the thickness of the skin layer is expected to be set by the overall polymer concentration, R0, and the coarsening timescale. Overall, we find that the structure of the resulting particles is spatially heterogeneous, with a smooth polymer skin and a microporous internal structure. SEM imaging suggests that for initial PVA concentrations above ≥0.1 g L−1, the overall particle shape remains spherical, and the microstructure is largely uniform, likely due to convection before kinetic arrest.
Initial droplet concentration (and R0) determines R∞
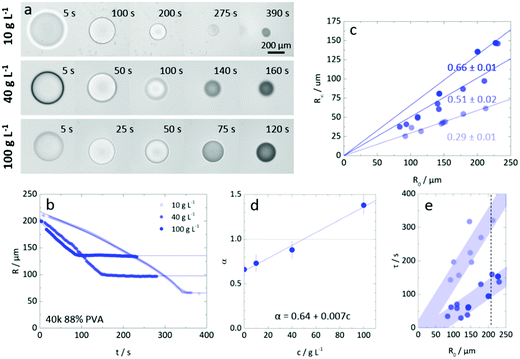
Fig. 6a compares the extraction of droplets of similar initial size (R0 ≈ 200 μm) and PVA concentration varying from 10 to 100 g L−1, corresponding to approximately 1 to 10% polymer by mass. The extraction profiles R(t) are shown in Fig. 6b, establishing that droplets of lower polymer concentration take longer time and yield smaller particles, as could be expected. Within this concentration range, no surface buckling is observed, and the particles are largely spherical. The dependence of R∞ on R0 is shown in Fig. 6c and which is found to be linear, with a concentration dependent slope, following from the observations above. The hyperbolicity parameter α is shown in Fig. 6d, accounting for the curvature of the extraction profile, and ranged from 0.64 to 1.4 respectively for pure water and the highest PVA concentration. Finally, Fig. 6e establishes the extraction timescale, defined as shown in Fig. 4a, for the three PVA concentrations. The relative scatter in the data is thought to arise from the presence of the carrier phase and droplet crowding, which may modulate the (ternary) solvent concentration profile surrounding the droplets. Nevertheless, the τ(R0) dependence is found to be linear in all cases, as previously found for NaPSS,35,36 and the data for initial polymer c > c* is found to overlap within measurement uncertainty. Droplets with initial PVA concentration of 10 g L−1 (<c*) take comparatively 3–4 times longer to form particles.We note that the extraction timescales τ presented in the main paper were obtained under quiescent conditions, i.e. for stationary droplets in the absence of external flow, and are thus solely diffusive. Additional stirring of the extraction medium can trivially expedite the removal of the solvent from the vicinity of the droplet, adding a convective term, and thus result in shorter τ (as detailed in Fig. S2, ESI†).
One might have expected longer τ to enable further coarsening within the demixed droplet. However, cross-sectional SEM measurements revealed that, within the concentration range 10–100 g L−1, PVA particles exhibited similar internal porosity, as shown in Fig. S3 (ESI†). We interpret this observation as a result of the kinetic arrest taking place at (average) polymer concentrations which are consistently above c**. Similar conclusions have been drawn for observed the porosity of non-solvent induced precipitation of poly(styrene) particles.61 At sufficiently low initial concentrations, however, this trend no longer applies, and only a thin polymer skin is formed, as discussed below. Overall, these results combined enable the predictive design of microporous PVA particles with controlled dimensions (R∞) and timescales (τ), across various concentrations of a given Mw polymer.
Limited effect of Mw and degree of hydrolysis
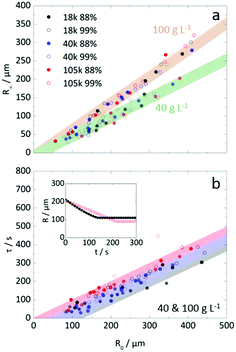
Fig. 7a extends the analysis of the dependence of R∞ on R0 to examine the effect of Mw and degree of hydrolysis at two representative concentrations (40 and 100 g L−1). For the range investigated, we find that the particle formation process does not depend on chain length and hydrolysis, within measurement uncertainty. Instead, initial droplet concentration is found to define the proportionality between R∞ and R0. We attribute this insensitivity to the fact that solidification (as defined by τ) is reached at droplet concentrations well above c** and that, therefore, overall polymer dimensions become unimportant. Insensitivity to the degree of hydrolysis is potentially attractive, as polymer dissolution depends strongly on it and may provide facile access to tunable release properties. Detailed calculations of the evolution of (average) polymer concentration from initial droplet to final particle are shown in Fig. S4a (ESI†). For both initial concentrations examined, all PVA solutions were above c* at 40 g L−1 and all were above c** at 100 g L−1, as shown in inset of Fig. 4b. We do not observe a common (average) polymer concentration at solidification, nor a single criterion for the (average) viscosity upon particle formation (Fig. S4b, ESI†). Instead a range of concentrations above c** are found, as expected since the particles are internally heterogeneous, due to demixing and skin formation.The τ(R0) dependence on Mw is shown in Fig. 7b. In first approximation, given the (intrinsic) scatter in the data, extraction times appear to depend only on R0 and not on Mw, degree of hydrolysis nor concentration (for this range). Closer inspection of the data reveals, on average, that increasing Mw correlates with marginally longer τ as illustrated by the gradient band encompassing the data. The inset of Fig. 7b, illustrates this variation of τ for two droplets of the same initial size and concentration, for which the lower Mw droplet forms a particle earlier. The scatter in the data likely originates from some (minor) variability of the diffusion profile around each droplet, and can be affected by crowding, proximity to surfaces, and remnant carrier phase. Decreasing concentrations ≤10 g L−1 results in significant increases in τ at constant R0, (Fig. S5, ESI†), so this approximate insensitivity holds for c > c*. At lower concentrations, solvent exchange occurs for longer times before the droplet concentration reaches the phase boundary and demixes, forming a polymer-rich phase. A subsequent section examines these conditions in more detail.
Does concentration or viscosity fix the timescale and size?
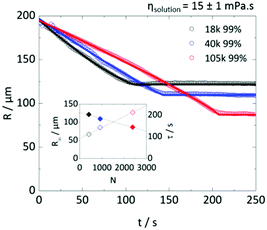
Fig. 8 examines the possibility that droplet solution viscosity alone controls the time scale of extraction, before solidification takes place. A fixed solution viscosity was selected (15 ± 1 mPa s) and, from Fig. 3a, a suitable combination of Mw and polymer concentration (all above c**) to satisfy that requirement. The extraction of droplets of R0 ≈ 200 μm droplets yields decreasing R∞ and increasing τ with increasing Mw (and thus reducing polymer concentration to maintain ηsolution). Droplet concentration (and not initial viscosity) emerges as the main parameter to tune particle size R∞ and timescale τ (which are closely linked as shown in Fig. 6e and 7b). Despite the difference in R(t) profiles, the final average concentration of polymer within the particles was found to reside within ±5% of each other, despite the concentration varying by more than a factor of 2 between the lowest and highest Mw of PVA droplets. These results are consistent with our previous analysis of polymer content in the particles, where we found, within experimental uncertainty, no significant trends with Mw or degree of hydrolysis. Estimations of the viscosity within the droplet at the onset of solidification, shown in Fig. S4b (ESI†), provide further evidence for the concentration, not viscosity, controlling particle size.Anisotropic extraction and particle deformation
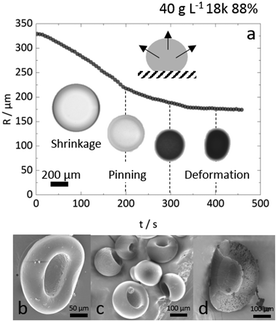
In the data presented so far, droplet crowding, hindered diffusion, solvent exchange near walls or surfaces, and partial wetting of the substrate, were carefully avoided (or data known to be affected were excluded from analysis). We emphasise, however, that most droplet extraction experiments will be otherwise inadvertently affected by these factors. For instance, upright optical microscopy will generally suggest the formation of a spherical particle, and a side view of the droplet is needed to resolve its 3-dimensional shape and evolution during extraction, in particular on or near a surface. We next discuss these effects and their impact on droplet extraction and resulting particle shape. The main indicators of such non-ideal effects are (i) non-monotonic decreases in R(t),35 and (ii) poor repeatability of dR(t)/dt between measurements (generally the steepest slopes, related to solvent mutual diffusion, are most reliable). Further to this, differences are most pronounced for higher R0 (>300 μm) and experimentally found to coincide with droplet-to-particle deformation away from sphericity, yielding cavities and/or ellipsoids to accommodate volume reduction. These effects are illustrated in Fig. 9a for the extraction or a relatively large droplet partly wetting the substrate during extraction. The R(t) profile exhibits several “kinks” (discontinuities in slope) which can be mapped onto contact line pinning and deformation events by optical microscopy. The formation of cavities and deformation of particles were consistently observed in instances where the substrate was inhomogeneously coated with OTS. Anisotropic solvent exchange and removal, hindered by the impermeable substrate, is the likely cause for cavity formation under the conditions examined. Under conditions of constant contact diameter drying,62,63 and polymer deposition and adhesion on the substrate, pinning of the three-phase line leads to simultaneously contact angle and volume reduction. Representative particles are shown in Fig. 9b and c. The projected area observed by microscopy is thus no longer representative of a shrinking spherical droplet and particle. Further, hindered diffusion near the surface delays skin formation, breaks symmetry and thus facilitates a buckling transition at the boundary.64,65 Similar effects have been previously observed in the gastrulation of sea-urchin embryos,66 a model system for morphogenesis, but also in the formation of polymer particles by solvent extraction under flow,31 or in evaporation from a supramolecularly cross-linked polymer-skin.33,67,68 Asymmetry in the removal of solvent, arising from stagnation points upon flow or stratification at the air–liquid interface was found to yield buckled or, in the most extreme cases, toroidal structures.In our measurements, droplet deformation and cavity formation were mitigated for smaller R0 and higher Mw, as shown in Fig. S6 (ESI†). Fig. 9c shows that cavity formation did not disrupt the expected internal microstructure, suggesting that demixing and buckling or deformation are largely decoupled. A systematic examination of the role of sessile droplet size and polymer concentration on droplet shape, substrate wettability, and consequences for extraction kinetics is provided in Fig. S7–S9 (ESI†).
These results show that, overall, the isotropy of solvent extraction can be trivially disturbed by the presence of an impermeable surface and, in addition to flow (with respect to the droplet), provides a facile way to create dimpled particles.
Towards the limit of low polymer concentration
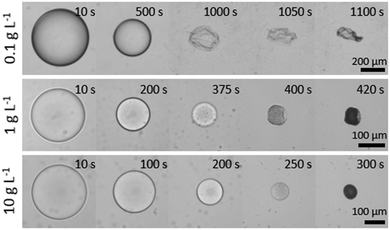
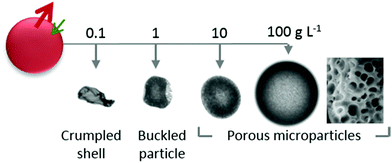
We next consider the effect of decreasing the initial polymer concentration well below c*, to examine the feasibility of capsule generation with ultrathin polymer membranes. Fig. 10 illustrates droplet extraction as initial polymer concentration is decreased by up to a factor of 1000 with respect to the data shown so far. At the lowest concentration (0.1 g L−1) and largest droplet radius (700 μm) examined, the extraction time becomes extremely long (≈20 min) and yields a polymer capsule with a thin (≈300 nm) polymer-rich skin (a “balloon”), which eventually collapses upon further extraction. The hyperbolicity parameter α is slightly larger than that for pure water, as expected for hindered diffusion. Upon increasing concentration by one order of magnitude, to 1 g L−1, the particle skin was evidently substantial enough to prevent crumpling, but nonetheless buckles to accommodate the final volume reduction. As per our previous data, at and above 10 g L−1 (approximately 1% w/w) particles become predominately spherical and internally microporous.Conclusions
The role of polymer architecture (Mw and hydrolysis), concentration and droplet radius were examined in the formation of PVA microparticles by droplet extraction. Aqueous PVA solution droplets were formed in a planar flow-focussing device, with a carrier phase (hexadecane, HD), and extracted by immersion into a selective solvent (ethyl acetate, EA), which is partially miscible with H2O, fully miscible with HD and immiscible with PVA. By mapping the phase behaviour of ternary mixtures of PVA/EA/H2O and the viscosity of PVA solutions, as a function of polymer mass and backbone hydrolysis, the extraction pathway can be estimated. The particle formation mechanism can be rationalised in terms of a series of steps: (i) solvent exchange and droplet shrinkage, (ii) demixing caused by non-solvent ingress, (iii) internal coarsening and convection, (iv) interfacial enrichment of the polymer-rich phase, creating a smooth polymer skin, and eventual (v) phase inversion and kinetic arrest. Demixing and droplet shrinkage occur simultaneously, and the relative rate of these processes is thought to determine the internal porosity of the templated PVA microparticles. From viscosity measurements, c* and c** for the PVA samples of various Mw and hydrolysis were determined. Representative concentrations below, within and above these values were selected to assess their possible impact into particle formation. We find that, for the range investigated, initial polymer solution concentration primarily determined the final particle size, for the same initial droplet size, while variations Mw and degree of hydrolysis had a minor effect. Initial concentrations below c* resulted in longer extraction times, while above c* or c**, small variations in extraction time were observed. For initial polymer concentrations above c*, the average polymer concentrations at the onset of skin formation and in the final particle vastly exceed c**. We rationalise the relative insensitivity of particle formation to Mw by fact that in the concentrated regime, overall polymer dimensions become unimportant. We could rule out the initial viscosity affecting the solvent extraction process by matching initial viscosity above c** and adjusting polymer concentration for droplets of differing Mw. These results supported our hypothesis that concentration was the major determining factor in the extraction process.In selected experiments, droplet radius was found to decrease non-monotonically during the extraction, and result in the formation of particles with a cavity and deformed shapes. This effect is observed for anisotropic extractions near solvent-impermeable surfaces and is exacerbated by the partial substrate wetting. Shape deformation and cavity formation take place to accommodate the particle volume reduction under pinning condition, and we found this effect to be most pronounced at low Mw and large R0. Buckled and toroidal particles have also been reported to form under prescribed flow conditions,33,34,67,68 and collectively these methods provide a number of facile routes for the fabrication of anisotropic particles.
Reducing polymer concentration to well below c*, led to an increase in extraction timescales and the formation of capsules with a thin (∼100s nm) polymer-skin, and crumpled and buckled structures. As illustrated in Fig. 11, this work establishes robust design principles and scaling relations for the precise generation of PVA microparticle and capsules, with potential applications in coatings, consumer goods and agrichemicals.
Conflicts of interest
There are no conflicts to declare.Acknowledgements
We thank the EPSRC and Procter and Gamble for financial support, and Carlos G. Lopez for discussions on rheology and scaling of polymer solutions. We also thank Dr Mahmoud Ardakani for training and use of the electron microscopy facility at Imperial College.Notes and references
- X. Fei, H. Zhao, B. Zhang, L. Cao, M. Yu, J. Zhou and L. Yu, Colloids Surf., A, 2015, 469, 300–306 CrossRef CAS.
- R. Tekin, N. Bac and H. Erdogmus, Macromol. Symp., 2013, 333, 35–40 CrossRef CAS.
- S. K. Ghosh, Functional Coatings, Wiley-VCH Verlag GmbH & Co. KGaA, 2006, pp. 187–220 DOI:10.1002/3527608478.ch6.
- I. van Driessche and S. Hoste, Functional Coatings, Wiley-VCH Verlag GmbH & Co. KGaA, 2006, pp. 259–296 DOI:10.1002/3527608478.ch8.
- S. De Koker, R. Hoogenboom and B. G. De Geest, Chem. Soc. Rev., 2012, 41, 2867–2884 RSC.
- A. Kumari, S. K. Yadav and S. C. Yadav, Colloids Surf., B, 2010, 75, 1–18 CrossRef CAS PubMed.
- X.-L. Yang, X.-J. Ju, X.-T. Mu, W. Wang, R. Xie, Z. Liu and L.-Y. Chu, ACS Appl. Mater. Interfaces, 2016, 8, 10524–10534 CAS.
- J. M. Weissman, H. B. Sunkara, A. S. Tse and S. A. Asher, Science, 1996, 274, 959–963 CrossRef CAS PubMed.
- W. Qun, F. Shoukuan and Y. Tongyin, Prog. Polym. Sci., 1994, 19, 703–753 CrossRef.
- J. A. Straub, D. E. Chickering, C. C. Church, B. Shah, T. Hanlon and H. Bernstein, J. Controlled Release, 2005, 108, 21–32 CrossRef CAS PubMed.
- G. M. Whitesides, Nature, 2006, 442, 368–373 CrossRef CAS PubMed.
- T. Y. Lee, T. M. Choi, T. S. Shim, R. A. M. Frijns and S.-H. Kim, Lab Chip, 2016, 16, 3415–3440 RSC.
- L. Y. Chu, A. S. Utada, R. K. Shah, J. W. Kim and D. A. Weitz, Angew. Chem., 2007, 119, 9128–9132 CrossRef.
- Z. Nie, S. Xu, M. Seo, P. C. Lewis and E. Kumacheva, J. Am. Chem. Soc., 2005, 127, 8058–8063 CrossRef CAS PubMed.
- D. Dendukuri and P. S. Doyle, Adv. Mater., 2009, 21, 4071–4086 CrossRef CAS.
- S. Takeuchi, P. Garstecki, D. B. Weibel and G. M. Whitesides, Adv. Mater., 2005, 17, 1067–1072 CrossRef CAS.
- G. Kaufman, R. Boltyanskiy, S. Nejati, A. R. Thiam, M. Loewenberg, E. R. Dufresne and C. O. Osuji, Lab Chip, 2014, 14, 3494–3497 RSC.
- M. Kim, S. J. Yeo, C. B. Highley, J. A. Burdick, P. J. Yoo, J. Doh and D. Lee, ACS Nano, 2015, 9, 8269–8278 CrossRef CAS PubMed.
- Q. Ma, Y. Song, J. W. Kim, H. S. Choi and H. C. Shum, ACS Macro Lett., 2016, 5, 666–670 CrossRef CAS.
- H. Zhang, E. Tumarkin, R. M. A. Sullan, G. C. Walker and E. Kumacheva, Macromol. Rapid Commun., 2007, 28, 527–538 CrossRef CAS.
- J. Zhang, R. J. Coulston, S. T. Jones, J. Geng, O. A. Scherman and C. Abell, Science, 2012, 335, 690 CrossRef CAS PubMed.
- E. Kumacheva and P. Garstecki, Microfluidic Reactors for Polymer Particles, John Wiley & Sons, Ltd, 2011, pp. 109–145 DOI:10.1002/9780470979228.ch7.
- W. J. Duncanson, T. Lin, A. R. Abate, S. Seiffert, R. K. Shah and D. A. Weitz, Lab Chip, 2012, 12, 2135–2145 RSC.
- T. S. Shim, S.-H. Kim and S.-M. Yang, Part. Part. Syst. Charact., 2013, 30, 9–45 CrossRef CAS.
- J.-T. Wang, J. Wang and J.-J. Han, Small, 2011, 7, 1728–1754 CrossRef CAS PubMed.
- W. Wang, M.-J. Zhang and L.-Y. Chu, Acc. Chem. Res., 2014, 47, 373–384 CrossRef CAS PubMed.
- G. R. Guillen, Y. Pan, M. Li and E. M. V. Hoek, Ind. Eng. Chem. Res., 2011, 50, 3798–3817 CrossRef CAS.
- D.-M. Wang and J.-Y. Lai, Curr. Opin. Chem. Eng., 2013, 2, 229–237 CrossRef.
- P. van de Witte, P. J. Dijkstra, J. W. A. van den Berg and J. Feijen, J. Membr. Sci., 1996, 117, 1–31 CrossRef CAS.
- B. K. Johnson and R. K. Prud'homme, Aust. J. Chem., 2003, 56, 1021–1024 CrossRef CAS.
- V. E. Lee, C. Sosa, R. Liu, R. K. Prud’homme and R. D. Priestley, Langmuir, 2017, 33, 3444–3449 CrossRef CAS PubMed.
- C. Zhang, V. J. Pansare, R. K. Prud'homme and R. D. Priestley, Soft Matter, 2012, 8, 86–93 RSC.
- B. Wang, H. C. Shum and D. A. Weitz, ChemPhysChem, 2009, 10, 641–645 CrossRef CAS PubMed.
- J. R. Millman, K. H. Bhatt, B. G. Prevo and O. D. Velev, Nat. Mater., 2004, 4, 98 CrossRef PubMed.
- T. Watanabe, C. G. Lopez, J. F. Douglas, T. Ono and J. T. Cabral, Langmuir, 2014, 30, 2470–2479 CrossRef CAS PubMed.
- C. E. Udoh, V. Garbin and J. T. Cabral, Langmuir, 2016, 32, 8131–8140 CrossRef CAS PubMed.
- E. Chiellini, A. Corti, S. D'Antone and R. Solaro, Prog. Polym. Sci., 2003, 28, 963–1014 CrossRef CAS.
- E. Prokopová, P. Štern and O. Quadrat, Colloid Polym. Sci., 1985, 263, 899–904 Search PubMed.
- E. Prokopová, P. Štern and O. Quadrat, Colloid Polym. Sci., 1987, 265, 903–907 Search PubMed.
- P. Štern, E. Prokopová and Q. Quadrat, Colloid Polym. Sci., 1987, 265, 234–238 Search PubMed.
- P. Štern, E. Prokopová and O. Quadrat, Colloid Polym. Sci., 1992, 270, 1066–1068 Search PubMed.
- P.-G. d. Gennes, Scaling Concepts in Polymer Physics, Cornell University Press, Ithaca, New York, USA, 1st edn, 1979 Search PubMed.
- D. C. Boris and R. H. Colby, Macromolecules, 1998, 31, 5746–5755 CrossRef CAS.
- R. H. Colby, Rheol. Acta, 2010, 49, 425–442 CrossRef CAS.
- C. Harrison, J. T. Cabral, C. M. Stafford, A. Karim and E. J. Amis, J. Micromech. Micromach., 2004, 14, 153 CrossRef.
- J. T. Cabral, S. D. Hudson, C. Harrison and J. F. Douglas, Langmuir, 2004, 20, 10020–10029 CrossRef CAS PubMed.
- W. Lee, L. M. Walker and S. L. Anna, Phys. Fluids, 2009, 21, 032103 CrossRef.
- D. L. Bitterfield, A. Utoft and D. Needham, Langmuir, 2016, 32, 12749–12759 CrossRef CAS PubMed.
- R. Stephenson and J. Stuart, J. Chem. Eng. Data, 1986, 31, 56–70 CrossRef CAS.
- C. E. Udoh, J. T. Cabral and V. Garbin, Sci. Adv., 2017, 3, eaao3353 CrossRef PubMed.
- B. Briscoe, P. Luckham and S. Zhu, Polymer, 2000, 41, 3851–3860 CrossRef CAS.
- J. N. Mohanty, P. L. Nayak and S. Lenka, Colloid Polym. Sci., 1987, 265, 982–985 CAS.
- A. Salabat and A. Mehrdad, J. Mol. Liq., 2010, 157, 57–60 CrossRef CAS.
- M. Cable and J. R. Frade, J. Mater. Sci., 1987, 22, 919–924 CrossRef CAS.
- D. W. Readey and A. R. Copper, Chem. Eng. Sci., 1966, 21, 917–922 CrossRef CAS.
- P. S. Epstein and M. S. Plesset, J. Chem. Phys., 1950, 18, 1505–1509 CrossRef CAS.
- A. W. Hixson and J. H. Crowell, Ind. Eng. Chem., 1931, 23, 923–931 CrossRef CAS.
- P. B. Duncan and D. Needham, Langmuir, 2006, 22, 4190–4197 CrossRef CAS PubMed.
- J. T. Su and D. Needham, Langmuir, 2013, 29, 13339–13345 CrossRef CAS PubMed.
- M. Leeds, Kirk-Othmer Encyclopedia of Chemical Technology, Wiley-Interscience, New York, 2nd edn, 1963 Search PubMed.
- A. Bianco, S. L. Burg, A. J. Parnell, C. M. Fernyhough, A. L. Washington, C. J. Hill, P. J. Smith, D. M. Whittaker, O. O. Mykhaylyk and J. P. A. Fairclough, Langmuir, 2017, 33, 13303–13314 CrossRef CAS PubMed.
- R. G. Picknett and R. Bexon, J. Colloid Interface Sci., 1977, 61, 336–350 CrossRef CAS.
- C. Bourges-Monnier and M. E. R. Shanahan, Langmuir, 1995, 11, 2820–2829 CrossRef CAS.
- L. Pauchard and C. Allain, Europhys. Lett., 2003, 62, 897 CrossRef CAS.
- L. Pauchard and Y. Couder, Europhys. Lett., 2004, 66, 667 CrossRef CAS.
- T. Kominami and H. Takata, Dev., Growth Differ., 2004, 46, 309–326 Search PubMed.
- Y. He, S. Battat, J. Fan, A. Abbaspourrad and D. A. Weitz, Chem. Eng. J., 2017, 320, 144–150 CrossRef CAS.
- A. R. Salmon, R. M. Parker, A. S. Groombridge, A. Maestro, R. J. Coulston, J. Hegemann, J. Kierfeld, O. A. Scherman and C. Abell, Langmuir, 2016, 32, 10987–10994 CrossRef CAS PubMed.
Footnote |
| † Electronic supplementary information (ESI) available. See DOI: 10.1039/c7sm02488f |
| This journal is © The Royal Society of Chemistry 2018 |

