 Open Access Article
Creative Commons Attribution 3.0 Unported Licence
Unravelling cationic cellulose nanofibril hydrogel structure: NMR spectroscopy and small angle neutron scattering analyses†‡
James C.
Courtenay
 ab,
Susana M.
Ramalhete
c,
William J.
Skuze
b,
Rhea
Soni
c,
Yaroslav Z.
Khimyak
 c,
Karen J.
Edler
 ab and
Janet L.
Scott
 *ab
*ab
aCentre for Sustainable Chemical Technologies, University of Bath, Bath BA2 7AY, UK. E-mail: j.l.scott@bath.ac.uk
bDepartment of Chemistry, University of Bath, Bath BA2 7AY, UK
cSchool of Pharmacy, University of East Anglia, Norwich Research Park, Norwich, NR4 7TG, UK
First published on 11th December 2017
Abstract
Stiff, elastic, viscous shear thinning aqueous gels are formed upon dispersion of low weight percent concentrations of cationically modified cellulose nanofibrils (CCNF) in water. CCNF hydrogels produced from cellulose modified with glycidyltrimethylammonium chloride, with degree of substitution (DS) in the range 10.6(3)–23.0(9)%, were characterised using NMR spectroscopy, rheology and small angle neutron scattering (SANS) to probe the fundamental form and dimensions of the CCNF and to reveal interfibrillar interactions leading to gelation. As DS increased CCNF became more rigid as evidenced by longer Kuhn lengths, 18–30 nm, derived from fitting of SANS data to an elliptical cross-section, cylinder model. Furthermore, apparent changes in CCNF cross-section dimensions suggested an “unravelling” of initially twisted fibrils into more flattened ribbon-like forms. Increases in elastic modulus (7.9–62.5 Pa) were detected with increased DS and 1H solution-state NMR T1 relaxation times of the introduced surface –N+(CH3)3 groups were found to be longer in hydrogels with lower DS, reflecting the greater flexibility of the low DS CCNF. This is the first time that such correlation between DS and fibrillar form and stiffness has been reported for these potentially useful rheology modifiers derived from renewable cellulose.
Introduction
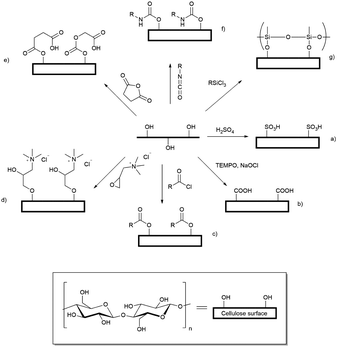
Cellulose fibres can be processed into an array of nanoparticles including nanocrystals, nanowhiskers, and micro- and nanofibrils.1 An array of mechanical nanofibrillation methods, enzymatic pretreatments and chemical modifications have been applied to yield so-called ‘nanofibrillated’ cellulose, as summarised in the comprehensive review by Kalia et al.2 First described by Rånby in 1951,3 cellulose nanocrystals and nanowhiskers are usually prepared by strong acid hydrolysis of cellulose fibres to yield stiff rod-like, crystalline cellulose nanoparticles with diameters ranging from 2 to 20 nm.4–6 These nanoparticles have an axial elastic modulus greater than that of Kevlar, and thus are of interest in the composite materials industry,7 however, up to 80% of the cellulose mass is lost during the hydrolysis process. As an alternative method to produce nanoparticulate cellulose Saito et al. demonstrated that oxidation, followed by relatively gentle shear, led to aqueous dispersions of oxidised cellulose nanofibrils with a cross-section of 3–5 nm.8,9 This method results in conversion of between 80 and 90% of the input cellulose into the product nanofibrils.Well dispersed cellulose nanocrystals and nanofibrils have been widely used to form hydrogels,10,11 which are cross-linked by physical interactions (van der Waals forces), chain entanglement, hydrogen bonds, and hydrophobic and electrostatic interactions. In addition to the significantly enhanced yields of cellulose nanofibrils (CNF) achieved by dispersion following chemical modification, such as oxidation, hydrogels can be formed by dispersion of small quantities of CNF in water. As the nanofibrils have a very large aspect ratio and retain a degree of fibril flexibility, these can be induced to form gels at low weight percent inclusion.12 Many reports have appeared of chemical modification of hydroxyl groups exposed on the surface of cellulose materials, leading to new applications for cellulose as a biomaterial,13 drug delivery vehicle14 or water purifying agent15 and there is a wide array of chemistry that can be applied to derivatisation of exposed hydroxyl groups including: oxidation,16 grafting of cationic tetralkylammonium groups,17 sulfonation,18 silylation,19 acylation,20 grafting of a range of substituents through ester linkages21 (generated by reaction with acid anhydrides,22 or chlorides23), and formation of polyurethane linkages by reaction with isocyanates24 (Scheme 1). Modification of the surface exposed hydroxyl groups leads to disruption of the non-covalent interactions between bundled cellulose fibrils, allowing dispersion of the individualised CNF in water leading to formation of hydrogels.25 The driving force for the formation of modified cellulose hydrogels is the molecular self-assembly of nanofibrils through electrostatic repulsion of charged functional groups, hydrophobic interactions and hydrogen bonds.26
Two simple to execute and easily scaled up reactions allow production of charged cellulose fibrils: derivatisation with GTMAC17,27 or TEMPO-mediated oxidation8,9,28 provide positively charged tetra-alkylammonium groups and potentially negatively charged carboxylate groups, respectively. Both modifications enhance the dispersibility of the functionalised CNF in water. For brevity these modified CNF are henceforth referred to as cationic cellulose nanofibrils (CCNF) and oxidised cellulose nanofibrils (OCNF).
A wide range of techniques has been used to characterise the surface modification of these nanofibrils: infrared (IR) spectroscopy and zeta-potential measurements are commonly used to identify the new functional groups present and determine whether the surface charge has changed.17,29–31 The degree of derivatisation (oxidation or substitution) is determined through an acid–base titration for oxidised cellulose and conductometric titration with AgNO3 for cationic cellulose.16,27,32 Recently, Kono & Kusumoto demonstrated that the degree of substitution (DS) on CCNFs could be calculated through quantitative 13C solid-state NMR studies, thus supporting conductometric measurements.33 Furthermore, small angle neutron scattering can be used to determine the cross-section shape and dimensions of the nanofibrils as well the structure of hydrogels.34,35
While the structure of OCNF and hydrogels formed from OCNF dispersions have been extensively probed,8,9,20,28,36,37 CCNF based hydrogels are less well described. These would not be predicted to be interchangeable; CCNF bear fixed positive charges in the form of tetra-alkylammonium groups, while the carboxylate moieties on OCNF may be protonated, or coordinated with a range of metal ions. In spite of the body of research into the characterisation of cationic cellulose nanofibrils, e.g. quantifying DS and effect of DS on gelation and CCNF dimensions,17,27,38 there is little understanding, at the molecular level, of CCNF surfaces and inter-nanofibril interactions. Herein we describe the influence of DS on physical interactions of CCNF probed using a combination of NMR spectroscopy, rheology and small angle neutron scattering to provide greater understanding of these nanoparticle surfaces and interactions.
Materials and methods
α-Cellulose powder (C8002), sodium hydroxide pellets (≥98%), glycidyltrimethylammonium chloride (≥90%), 0.1 M AgNO3 aqueous solution (≥95%), and HCl (reagent grade) were purchased from Sigma-Aldrich UK and used as received. Aqueous solutions of AgNO3, NaOH and HCl were made up to the required concentrations with deionised (DI) water. Sodium polyethylene sulfonate (1 mM, average Mw 9000–11![[thin space (1/6-em)]](https://www.rsc.org/images/entities/char_2009.gif) 000 g mol−1) solution was supplied by Carisbrooke. Deuterium oxide (D2O) was purchased from Goss Scientific.
000 g mol−1) solution was supplied by Carisbrooke. Deuterium oxide (D2O) was purchased from Goss Scientific.
Surface modification by derivatisation
![[thin space (1/6-em)]](https://www.rsc.org/images/entities/char_2009.gif) :
:![[thin space (1/6-em)]](https://www.rsc.org/images/entities/char_2009.gif) GTMAC molar ratios of 3
GTMAC molar ratios of 3![[thin space (1/6-em)]](https://www.rsc.org/images/entities/char_2009.gif) :
:![[thin space (1/6-em)]](https://www.rsc.org/images/entities/char_2009.gif) 1, 2
1, 2![[thin space (1/6-em)]](https://www.rsc.org/images/entities/char_2009.gif) :
:![[thin space (1/6-em)]](https://www.rsc.org/images/entities/char_2009.gif) 1, 1
1, 1![[thin space (1/6-em)]](https://www.rsc.org/images/entities/char_2009.gif) :
:![[thin space (1/6-em)]](https://www.rsc.org/images/entities/char_2009.gif) 1, 1
1, 1![[thin space (1/6-em)]](https://www.rsc.org/images/entities/char_2009.gif) :
:![[thin space (1/6-em)]](https://www.rsc.org/images/entities/char_2009.gif) 2 and 1
2 and 1![[thin space (1/6-em)]](https://www.rsc.org/images/entities/char_2009.gif) :
:![[thin space (1/6-em)]](https://www.rsc.org/images/entities/char_2009.gif) 3) was added dropwise to the mixture, the paste was kneaded to homogenise the reactants and reacted at 65 °C for 75 min followed by purification by dialysis (Mw cut-off 12
3) was added dropwise to the mixture, the paste was kneaded to homogenise the reactants and reacted at 65 °C for 75 min followed by purification by dialysis (Mw cut-off 12![[thin space (1/6-em)]](https://www.rsc.org/images/entities/char_2009.gif) 400 g mol−1) against copious quantities of DI water (refreshed regularly) for 72 h. The product was concentrated by centrifugation, the supernatant discarded and a sample freeze dried and accurately weighed to determine solids content.
400 g mol−1) against copious quantities of DI water (refreshed regularly) for 72 h. The product was concentrated by centrifugation, the supernatant discarded and a sample freeze dried and accurately weighed to determine solids content.
Titre volume (Vt), titrant concentration (Ct), molar mass of AGU (Mc = 162.15 g mol−1), molar mass of substituent group (Ms = 151.63 g mol−1), cationic cellulose suspension volume (Vc), suspension concentration (Cc) from the Mütek titration and TGA water content values (Tw) were used to determine the DS of the sample. Substituent mole equivalent per g (Seq g−1) was determined from plotting molar charge equivalent (eq.) against weight of cellulose (g) with the gradient as eq. g−1. The degree of substitution can be calculated using eqn (1):
 | (1) |
Transmission electron microscope (TEM) images of CCNF were obtained on a JEOL JEM-2100Plus instrument with an operating voltage of 200 kV. Before image acquisition, samples were deposited on copper grid and negatively stained with uranyl acetate.
CCNF stabilised hydrogels
![[thin space (1/6-em)]](https://www.rsc.org/images/entities/char_2009.gif) 500 rpm for 15 min. Dispersion to form hydrogels was completed by sonication using a VibraCell ultrasonicator (Sonics and Materials) at a power output of 45 W cm−2 using 1 s on/off pulses for 2 min. Dispersions were stored at 4 °C until required.
500 rpm for 15 min. Dispersion to form hydrogels was completed by sonication using a VibraCell ultrasonicator (Sonics and Materials) at a power output of 45 W cm−2 using 1 s on/off pulses for 2 min. Dispersions were stored at 4 °C until required.
Cationic cellulose nanofibril characterisation
 | (2) |
 | (3) |
High-resolution magic angle spinning (HR-MAS) NMR experiments were conducted using a Bruker Avance III spectrometer operating at a 1H frequency of 800.23 MHz equipped with a 4 mm probe, using Kel-F inserts as above. 1H HR-MAS NMR spectra were acquired using a recycle delay of 5 s and MAS rates ranging from 2 to 10 kHz. 1H longitudinal relaxation times (T1) experiments were performed using an inversion recovery pulse sequence with a recycle delay of 10 s. Sixteen points were recorded at variable time delays ranging from 0.1 to 20 s. 1H T1 times were calculated from fitting the evolution of intensities to the mono-exponential function, eqn (4):
 | (4) |
Solution-state NMR experiments were carried out using a Bruker Avance I spectrometer operating at a 1H frequency of 499.69 MHz equipped with a 5 mm triple resonance probe. Samples of hydrogels (500 μL) were transferred into NMR tubes using a needle and syringe. Variable temperature experiments were carried out in the range between 5 and 45 °C. 1H T1 relaxation times were measured using an inversion recovery pulse sequence with a recycle delay of 10 s. Sixteen points were recorded at variable time delays ranging from 0.1 to 20 s.
 | (5) |
![[thin space (1/6-em)]](https://www.rsc.org/images/entities/char_2009.gif) 000 Å (full fitting parameters, Table S1, ESI‡).
000 Å (full fitting parameters, Table S1, ESI‡).
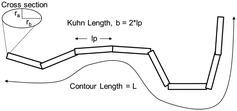 | ||
| Fig. 1 Schematic of the flexible, ellipsoidal cylinder model as applied to CCNF. The Kuhn length was used to describe the stiffness of the nanofibrils dispersed in the hydrogel.45 | ||
Results
Surface modification and characterisation
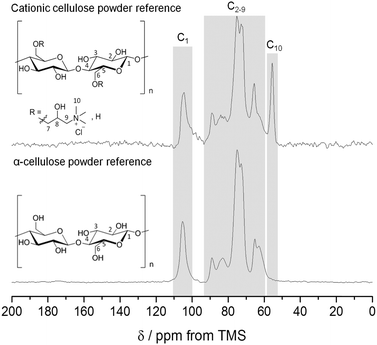
The nucleophilic substitution of alkali activated primary alcohol groups exposed on the cellulose surface with GTMAC resulted in cationisation of the nanofibrils, leading to a positive surface charge (Scheme 1, reaction d). Increasing molar ratio of GTMAC:AGU resulted in proportionally higher DS (from 10.6% at 0.5 mole eq. GTMAC to 23.0% at 3 mole eq. GTMAC). A yield of 88%, based on cellulose dry mass, was achieved for the cationisation process at the highest DS. The degree of surface modification was controlled by modulating the quantity of GTMAC and the DS of cellulose nanofibrils assessed using FTIR and conductometric titration (Fig. S1–S3, ESI‡). Solid-state NMR spectroscopy was used to confirm the presence of the –N+(CH3)3 groups, introduced by reaction with GTMAC, on the surface of the nanofibrils (carbon C10 in Fig. 2). Moreover, a very good agreement was found between the DS calculated from conductometric and NMR spectroscopy experiments (Fig. 3). The CCNF zeta-potential increased upon cationisation from 38.8 to 50.3 mV as the –N+(CH3)3 groups graft to the surface (Fig. 3). Additionally, comparison of 13C-NMR signals, arising from C4, in crystalline and amorphous forms, revealed no discernable change in crystallinity upon cationisation46 (crystallinity index = 0.38) (Fig. S4, ESI‡).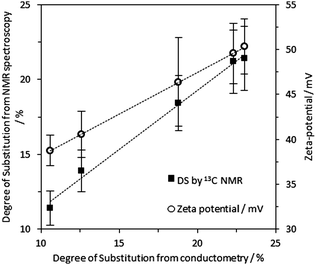 | ||
| Fig. 3 Black squares: DS determined from 13C solid state NMR spectra according to eqn (3) is in good agreement with the DS determined by conductometry (trend line R2 = 0.99). White circles: zeta-potential for dispersed CCNF in DI H2O as DS increases (trend line R2 = 0.99 and gradient = 0.93). | ||
Characterisation of functionalised nanofibrils
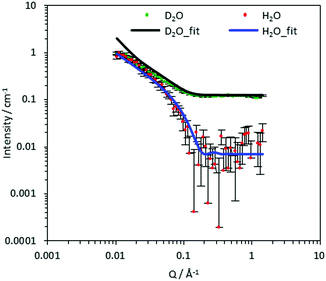
To compare the effect of DS of the CCNF on the structure of the dispersed CCNF gel, SANS with contrast matching was employed. This is a non-invasive technique used to obtain structural information from the samples in situ, based on SLD differences. For each CCNF hydrogel system, the H2O/D2O contrasts were plotted and the model simultaneously fitted to both sets of SANS data (Fig. 4 and Fig. S6–S9, ESI‡). The resultant ellipsoidal cross-section flexible cylinder model provided information pertaining to CCNF cross section and fibril stiffness, Table 1.| DS/% | Radius/Å | Axis ratio | Kuhn length/Å |
|---|---|---|---|
a Parameters held constant were: background, contour length (10![[thin space (1/6-em)]](https://www.rsc.org/images/entities/char_2009.gif) 000 Å), sldCyl (1.75 × 10⁻⁶ Å−2) and sldSolv (D2O = 6.34 × 10⁻⁶ and H2O = −5.61 × 10⁻⁷ Å−2). 000 Å), sldCyl (1.75 × 10⁻⁶ Å−2) and sldSolv (D2O = 6.34 × 10⁻⁶ and H2O = −5.61 × 10⁻⁷ Å−2).
|
|||
| 10.6(3) | 14(1) | 2.1(3) | 175(8) |
| 12.6(1) | 11.6(8) | 3.2(6) | 230(14) |
| 18.8(2) | 6.7(8) | 8.4(2) | 303(22) |
| 23.0(9) | 6.3(8) | 6.6(1) | 296(21) |
The CCNF cross-section dimensions were observed to change with increasing DS. The minor radius, ra, derived from the model changes from 1.4 nm to 0.6 nm and the axis ratio, rb/ra, from 2.1 to 6.6, giving fibril cross-section dimensions of 2.8 × 5.9 nm for CCNF with DS = 10.6% and 1.2 × 8.3 nm for CCNF with DS = 23.0%. These dimensions are in broad agreement with previous reports38 and the changes imply that the fibrils become wider and flatter as surface derivatisation increased. An increase in the Kuhn length from 18 to 30 nm (Table 1 and Fig. 5) was observed with increasing DS, ascribed to “stiffening” of the fibrils arising from charge repulsion as the density of surface –N+(CH3)3 groups increased. We return to discussion of the implication of the apparent flattening discerned from SANS measurements later.
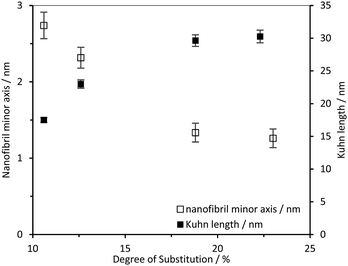 | ||
| Fig. 5 CCNF dimensions determined from the simultaneously fitted D2O/H2O data to the model nanofibril diameter and nanofibril Kuhn length. | ||
CCNF hydrogel rheology
The rheological properties of the hydrogels formed by dispersion and sonication of CCNF in water were measured as a function of varying DS using both oscillatory sweep and thixotropic loop experiments. It was apparent that, as the CCNF DS increased, the hydrogels became stiffer (Fig. 6a). Furthermore, a relationship between hydrogel elastic storage modulus and Kuhn length was observed, (Fig. 6b), pointing to a change in the nature of the hydrogel associated with changes in shape and stiffness of the CCNF.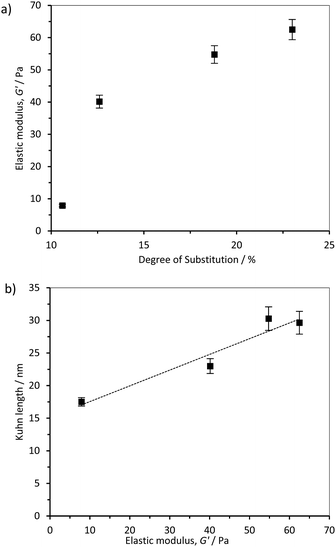 | ||
| Fig. 6 (a) Influence of cationic cellulose nanofibril DS on the elastic storage modulus and (b) Kuhn length of the 2 wt% cationised cellulose hydrogels, R2 = 0.9306. | ||
Complex modulus increased for hydrogels formed from CCNF with greater DS, while phase angle decreased (Table 2 and Fig. S10–13, ESI‡), i.e. gels became more elastic.
| DS/% | G*/Pa | δ/° | G′/Pa | G′′/Pa | η/Pas | τ 0/Pa |
|---|---|---|---|---|---|---|
| 10.6 | 8.3 | 18.6 | 7.9 | 2.7 | 0.1 | 3.8 |
| 12.6 | 40.8 | 10.1 | 40.4 | 7.2 | 0.3 | 38.1 |
| 18.8 | 55.3 | 7.4 | 54.8 | 7.1 | 0.3 | 49.5 |
| 23.0 | 63.4 | 9.5 | 62.5 | 10.5 | 0.4 | 53.3 |
Probing local mobility of surface functional groups using 1H NMR relaxation measurements
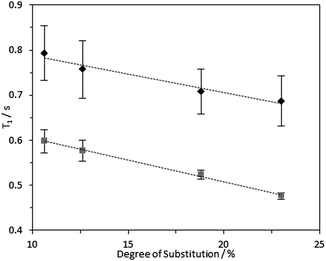
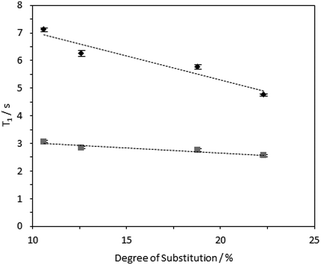
1H longitudinal relaxation times (T1) of the hydrogels formed were measured as a function of varying DS, using solution-state and HR-MAS NMR experiments. Signals arising from the 1Hs of the –N+(CH3)3 moiety were used for quantification as these were distinct, while other signals were overlapped (Fig. S14–16, ESI‡). Relaxation profiles of these 1Hs are affected by molecular motions and are thus a suitable probe for the effect of DS on local viscosity. To investigate the dependence of 1H longitudinal relaxation times on the mobility of the cationic groups, the hydrogel with a DS of 23.0% was subjected to varying temperatures. In the temperature range employed, 1H solution-state NMR T1 times for the –N+(CH3)3 and water protons increased with temperature (Table S2, ESI‡), indicating that these hydrogels are in the “slow tumbling regime”.47 The slower relaxation profiles observed at higher temperatures reflected increased motional freedom. Comparing fibrils with variable DS: longer 1H T1 values were recorded in hydrogels with a lower DS (10.6%) in comparison with hydrogels with higher DS (23.0%) (Fig. 7 and 8). Therefore, it was possible to conclude that the quaternary ammonium groups and water molecules were more mobile in hydrogels with lower DS, showing that the local mobility of the grafted quaternary ammonium group depends on the DS.Interestingly, an inverse relationship was found between DS and 1H HR-MAS T1 values of –N+(CH3)3 and water acquired with different MAS rates (Fig. 9 and Fig. S17, ESI‡). While the spectra did not change dramatically (Fig. S17, ESI‡), the 1H T1 times increased when all the samples were subjected to higher spinning speeds, possibly reflecting shear thinning behaviour in these CCNF hydrogels. This effect was more evident for hydrogels with lower DS (10.6%). The shear force produced by the spinning rates used was significantly greater than that required to “break” the gels (as evidenced by the rheology data presented in Table 2 and Fig. S9–S12, ESI‡), so it is hypothesised that there are multiple levels of CCNF interaction. When monitoring 1H T1 times of the –N+(CH3)3 group we are only assessing the local mobility of the groups grafted onto the surface of the fibres. During rheology studies these local environments do not change significantly, as it is the macrostructure and mesostructure of the gel that are most affected by the external stress. The 1H relaxation time measurements suggest that, along with the changes at mesoscale reflected by the rheological properties, local mobilities of both water and grafted –N+(CH3)3 groups on the CCNF are reduced with increased strength of the hydrogels.
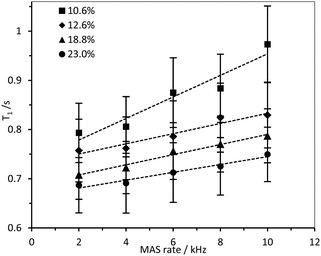 | ||
| Fig. 9 1H HR-MAS T1 times for –N+(CH3)3 group in 4 wt% CCNF hydrogels with increasing DS, acquired with MAS rates between 2 and 10 kHz. | ||
Discussion
Stable hydrogels were formed upon the dispersion of cationically surface modified cellulose nanofibrils in water. The physical interactions of the surfaces of CCNF were investigated using NMR, SANS and rheology to reveal the fundamental form of the particles and structuring in the hydrogels.The presence of tetra-alkylammonium moieties arising from grafting with GTMAC was confirmed by 1H–13C CP/MAS solid-state NMR (Fig. 2), which revealed a peak at 55.5 ppm, corresponding to the three methyl group carbon atoms of the quaternary ammonium moiety. Very good agreement was obtained for the values of DS obtained from conductometric titration measurements (versus AgNO3, or sodium polyethylene sulfonate solutions) and quantitative NMR analysis (Fig. 3).
As previously reported,38 the modified nanofibrils were much more dispersible in DI water than the α-cellulose precursor, but remained largely water insoluble (DS was limited to <25% to minimise formation of soluble CCNF48). Moreover, while all CCNF prepared formed stable hydrogels in water following dispersion by sonication, nanofibrils with higher DS were more readily dispersed and formed stiffer and more elastic gels. The linear relationship, with gradient close to unity, between DS and zeta-potential (Fig. 3) suggested that the etherification to install cationic groups was largely limited to the nanofibril surfaces. The maximum theoretical DS achievable for surface functionalisation, calculated following Habibi et al.,16,36 was ca. 32%, thus the CCNF produced here may not reflect full nanofibrillar surface saturation. Further, the unchanging crystallinity index suggested that the bulk structure of the elemental nanofibril remained untouched by the modification (Fig. S4, ESI‡).
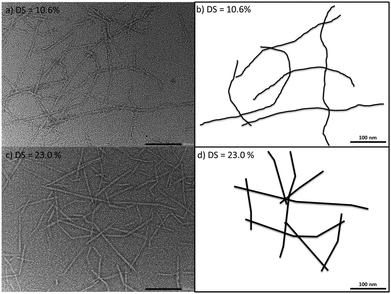
SANS was used to probe the CCNF cross-section and to elucidate the gel structure and nanofibril interactions. The reduced scattering data was fitted to a flexible ellipsoidal cylinder model, which describes the CCNF as a fibril with somewhat flattened cross-section and varying degrees of flexibility. Further, results suggest that charge repulsion between the positively charged nanofibril surfaces serve to facilitate defibrillation, producing individualised fibrils, which become stiffer with increasing DS, as evidenced by an increase in Kuhn length (Fig. 5) and supported by TEM images (Fig. 10), showing flexed fibrils in samples with low DS and distinctly straighter fibrils in high DS materials. As with oxidised cellulose nanofibrils, the very high fibrillar aspect ratio44 provides a particulate network, forming hydrogels. The nanofibrillar cross-section dimensions measured are consistent with values reported for cationic cellulose nanofibrils, determined by AFM and Cryo-TEM38 and the theoretical range of unmodified cellulose crystallites of 1.5–2 nm by 3–5 nm, based on the 36-glucan-chain elementary model of the cellulose Iβ structure,49 although the 24-glucan chain elementary fibril postulated by Fernandes et al.50 could lead to thinner forms.
The level of surface modification present on the dispersed nanofibrils influenced the rheology of the resultant hydrogels. CCNF with higher DS formed stiffer hydrogels reflected in higher elastic storage moduli (Fig. 6a and Table 2). As this change in rheological behaviour was also mirrored in the increased stiffness of the dispersed nanofibrils (Kuhn length) and a change in apparent cross-section, it is postulated that this change in hydrogel structure arises from:
1. Increased charge repulsion with increased DS leading to loss of flexibility and straightening and stiffening of fibrils along their length – reflected in longer Kuhn lengths and decreased mobility of surface –N+(CH3)3 groups, and
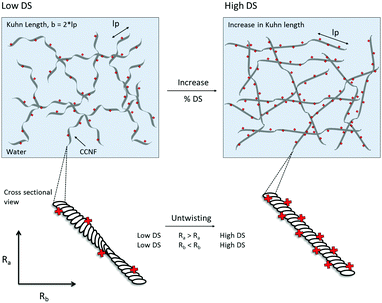
2. Untwisting, or unravelling, of CCNF to form flatter, more ribbon-like structures at higher DS, reflected in changes in cross-section shape and diameter – surface charge repulsion caused CCNF to untwist into flattened ribbon-like fibrils as DS increased.
The changes in rheological behaviour of CCNF hydrogels with different DS can be correlated with the changes in local mobility of grafted quaternary ammonium groups and water molecules monitored by 1H T1 relaxation times. Thus, low DS CCNF gels result from entanglement of long twisted flexible fibrils, which become less twisted and more rigid as DS increases (Fig. 10). Entanglement of these stiffer units leads to stiffer, more elastic hydrogels.
It is well documented that cellulose nanofibrils possess a twist along the AGU chain axis: computational modelling (molecular dynamics) has been used to demonstrate that cellulose nanofibrils adopt a half twist every 3–4 nm along the chain axis;51–53 this twisting has also been observed by AFM and TEM analyses and is especially apparent in well-dispersed ribbon-shaped bacterial cellulose.54,55 We suggest that the introduction of a positive surface onto the cellulose causes nanofibrils to untwist due to charge repulsion along the surface (Fig. 11). Furthermore the values for Kuhn length (18–30 nm) are similar to those previously reported for cellulose ∼10–20 nm (using a similar model)56 and ∼50–60 nm for oxidised cellulose nanofibrils (determined from peak force quantitative nanomechanical mapping).57
This hypothesis for the apparent change in CCNF structure is supported by the rise in hydrogel elastic moduli of 7.9–62.5 Pa. These hydrogels are highly thixotropic as the viscosity decreases rapidly as the shear rate increases. Increasing the oscillation frequency gave increased complex modulus and decreased phase angle values, associated with increasing elastic behaviour with decreasing perturbation time. As the DS increased, both the elastic and viscous moduli values increased, but the elastic modulus, already much higher, increased to a greater extent, which is a good indication of structuring within the hydrogel.
Conclusions
Combining results from neutron scattering experiments, rheological measurements and analysis of 1H NMR T1 relaxation times of the water and grafted –N+(CH3)3 groups, changes in the form of cationised cellulose nanofibrils and structuring in hydrogels formed therefrom is revealed.With increased degree of reaction with GTMAC, the density of positively charged moieties on the surface of the CCNF increases, leading to charge repulsion and stiffening of the fibrils. Physical entanglement of these stiffer CCNF results in stiffer, but more fragile, gels. Changes in the apparent cross-section dimensions of the individualised fibrils, derived from fitting of SANS data, are postulated to reflect untwisting of the fibrils. Thus, low DS CCNF are characterised by fibrils that are twisted and flexed, and which entangle to form weak hydrogels, while higher DS CCNF fibrils are more rigid, flatter, ribbon-like structures that result in stiff, elastic viscous shear thinning hydrogels.
Conflicts of interest
The authors declare no conflicts of interest.Acknowledgements
We acknowledge ISIS for the provision of beamtime for the SANS experiments (experiment number RB1520375) and Dr Richard K. Heenan for their assistance in setting up the SANS2D instrument during the experiment. S. M. R. thanks the University of East Anglia for her postgraduate studentship. Y. Z. K., K. J. E. and J. L. S. acknowledge financial support from the EPRSC and Innovate UK – from the grants EP/N033337/1 and EP/N033310/1. TEM images were obtained at the Microscopy and Analysis Suite in Bath University with the assistance of Ursula Potter. J. C. C. thanks Vincenzo Calabrese for his assistance with rheology analysis. This research was partly supported by funding from the EPSRC Centre for Doctoral Training in Sustainable Chemical Technology (EP/L016354/1), in the form of a PhD studentship for J. C. C. Additional research data supporting this publication are available as electronic supplementary files at the DOI: 10.1039/c7sm02113e.References
- D. Klemm, F. Kramer, S. Moritz, T. Lindström, M. Ankerfors, D. Gray and A. Dorris, Angew. Chem., Int. Ed., 2011, 50, 5438–5466 CrossRef CAS PubMed.
- S. Kalia, S. Boufi, A. Celli and S. Kango, Colloid Polym. Sci., 2014, 292, 5–31 CAS.
- B. G. Rånby, Discuss. Faraday Soc., 1951, 11, 158–164 RSC.
- F. Alloin, A. Dufresne and M. A. S. A. Samir, Biomacromolecules, 2005, 6, 612–626 CrossRef PubMed.
- Y. Habibi, L. A. Lucia and O. J. Rojas, Chem. Rev., 2010, 110, 3479–3500 CrossRef CAS PubMed.
- G. Siqueira, J. Bras and A. Dufresne, Polymers, 2010, 2, 728–765 Search PubMed.
- R. J. Moon, A. Martini, J. Nairn, J. Simonsen and J. Youngblood, Chem. Soc. Rev., 2011, 40, 3941–3994 RSC.
- T. Saito, S. Kimura, Y. Nishiyama and A. Isogai, Biomacromolecules, 2007, 8, 2485–2491 CrossRef CAS PubMed.
- T. Saito, Y. Nishiyama, J. L. Putaux, M. Vignon and A. Isogai, Biomacromolecules, 2006, 7, 1687–1691 CrossRef CAS PubMed.
- T. Saito, T. Uematsu, S. Kimura, T. Enomae and A. Isogai, Soft Matter, 2011, 7, 8804 RSC.
- X. Shen, J. L. Shamshina, P. Berton, G. Gurau and R. D. Rogers, Green Chem., 2015, 18, 53–75 RSC.
- R. J. Crawford, K. J. Edler, S. Lindhoud, J. L. Scott and G. Unali, Green Chem., 2012, 14, 300–303 RSC.
- J. C. Courtenay, M. A. Johns, F. Galembeck, C. Deneke, E. M. Lanzoni, C. A. Costa, J. L. Scott and R. I. Sharma, Cellulose, 2017, 24, 253–267 CrossRef CAS.
- J. You, J. Cao, Y. Zhao, L. Zhang, J. Zhou and Y. Chen, Biomacromolecules, 2016, 17, 2839–2848 CrossRef CAS PubMed.
- A. Pei, N. Butchosa, L. A. Berglund and Q. Zhou, Soft Matter, 2013, 9, 2047 RSC.
- T. Saito and A. Isogai, Biomacromolecules, 2004, 5, 1983–1989 CrossRef CAS PubMed.
- M. Zaman, H. Xiao, F. Chibante and Y. Ni, Carbohydr. Polym., 2012, 89, 163–170 CrossRef CAS PubMed.
- Y. Habibi, Chem. Soc. Rev., 2014, 43, 1519–1542 RSC.
- C. Goussé, H. Chanzy, G. Excoffier, L. Soubeyrand and E. Fleury, J. Polym., 2002, 43, 2645–2651 CrossRef.
- J. F. Sassi and H. Chanzy, Cellulose, 1995, 2, 111–127 CrossRef CAS.
- Y. Habibi, A.-L. Goffin, N. Schiltz, E. Duquesne, P. Dubois and A. Dufresne, J. Mater. Chem., 2008, 18, 5002–5010 RSC.
- J. K. Pandey, W. S. Chu, C. S. Kim, C. S. Lee and S. H. Ahn, Composites, Part B, 2009, 40, 676–680 CrossRef.
- A. Junior de Menezes, G. Siqueira, A. A. S. Curvelo and A. Dufresne, J. Polym., 2009, 50, 4552–4563 CrossRef.
- G. Siaueira, J. Bras and A. Dufresne, Biomacromolecules, 2009, 10, 425–432 CrossRef PubMed.
- S. P. Akhlaghi, R. C. Berry and K. C. Tam, Cellulose, 2013, 20, 1747–1764 CrossRef CAS.
- C. Chang and L. Zhang, Carbohydr. Polym., 2011, 84, 40–53 CrossRef CAS.
- M. Hasani, E. D. Cranston, G. Westman and D. G. Gray, Soft Matter, 2008, 4, 2238–2244 RSC.
- A. Isogai, T. Saito and H. Fukuzumi, Nanoscale, 2011, 3, 71–85 RSC.
- M. Hasani, E. D. Cranston, G. Westman and D. G. Gray, Soft Matter, 2008, 4, 2238–2244 RSC.
- J. L. Ren, R. C. Sun, C. F. Liu, Z. Y. Chao and W. Luo, Polym. Degrad. Stab., 2006, 91, 2579–2587 CrossRef CAS.
- A. Isogai, T. Saito and H. Fukuzumi, Nanoscale, 2011, 3, 71–85 RSC.
- D. da Silva Perez, S. Montanari and M. R. Vignon, Biomacromolecules, 2003, 4, 1417–1425 CrossRef CAS PubMed.
- H. Kono, K. Ogasawara, R. Kusumoto, K. Oshima, H. Hashimoto and Y. Shimizu, Carbohydr. Polym., 2016, 152, 170–180 CrossRef CAS PubMed.
- R. J. Crawford, K. J. Edler, S. Lindhoud, J. L. Scott and G. Unali, Green Chem., 2012, 14, 300–303 RSC.
- K. Edler, D. Celebi, Y. Jin and J. Scott, Acta Crystallogr., Sect. A: Found. Adv., 2014, 70, C1320 Search PubMed.
- Y. Habibi, H. Chanzy and M. R. Vignon, Cellulose, 2006, 13, 679–687 CrossRef CAS.
- N. Masruchin, B.-D. Park, V. Causin and I. C. Um, Cellulose, 2015, 22, 1993–2010 CrossRef CAS.
- A. Olszewska, P. Eronen, L.-S. Johansson, J.-M. Malho, M. Ankerfors, T. Lindström, J. Ruokolainen, J. Laine and M. Österberg, Cellulose, 2011, 18, 1213–1226 CrossRef CAS.
- R. Pelton, B. Cabane, Y. Cui and H. Ketelson, Anal. Chem., 2007, 79, 8114–8117 CrossRef CAS PubMed.
- W. Kolodziejski and J. Klinowski, Chem. Rev., 2002, 102, 613–628 CrossRef CAS PubMed.
- R. K. Heenan, S. M. King, D. S. Turner and J. R. Treadgold, 17th Meeting of the International Collaboration on Advanced Neutron Sources, 2005, pp. 1–6.
- W. Chen, P. D. Butler and L. J. Magid, Langmuir, 2006, 22, 6539–6548 CrossRef CAS PubMed.
- C. A. Dreiss, Soft Matter, 2007, 3, 956 RSC.
- Q. Li and S. Renneckar, Cellulose, 2009, 16, 1025–1032 CrossRef CAS.
- T. Strey, Description of the Model Functions, http://danse.chem.utk.edu/downloads/ModelfuncDocs.pdf, accessed 25 August 2015.
- R. H. Newman, Holzforschung, 2004, 58, 91 CrossRef CAS.
- C. L. Cooper, T. Cosgrove, J. S. van Duijneveldt, M. Murray and S. W. Prescott, Soft Matter, 2013, 9, 7211–7228 RSC.
- L. Yan, H. Tao and P. R. Bangal, Clean: Soil, Air, Water, 2009, 37, 39–44 CrossRef CAS.
- S.-Y. Ding and M. E. Himmel, J. Agric. Food Chem., 2006, 54, 597–606 CrossRef CAS PubMed.
- A. N. Fernandes, L. H. Thomas, C. M. Altaner, P. Callow, V. T. Forsyth, D. C. Apperley, C. J. Kennedy and M. C. Jarvis, Proc. Natl. Acad. Sci. U. S. A., 2011, 108, 1195–1203 CrossRef PubMed.
- K. Conley, L. Godbout, M. A. Whitehead and T. G. M. Van De Ven, Carbohydr. Polym., 2016, 135, 285–299 CrossRef CAS PubMed.
- S. Paavilainen, T. Róg and I. Vattulainen, J. Phys. Chem. B, 2011, 115, 3747–3755 CrossRef CAS PubMed.
- Z. Zhao, O. E. Shklyaev, A. Nili, M. Naseer, A. Mohamed, J. D. Kubicki, V. H. Crespi and L. Zhong, J. Phys. Chem. A, 2013, 117, 2580–2589 CrossRef CAS PubMed.
- S. Elazzouzi-hafraoui, Y. Nishiyama, L. Heux, F. Dubreuil, C. Rochas and J. Putaux, Biomacromolecules, 2008, 9, 57–65 CrossRef CAS PubMed.
- S. Hanley, J.-F. Revol, L. Godbout and D. Gray, Cellulose, 1997, 4, 209–220 CrossRef CAS.
- C. G. Lopez, S. E. Rogers, R. H. Colby, P. Graham and J. T. Cabral, J. Polym. Sci., Part B: Polym. Phys., 2015, 53, 492–501 CrossRef CAS PubMed.
- I. Usov, G. Nyström, J. Adamcik, S. Handschin, C. Schütz, A. Fall, L. Bergström and R. Mezzenga, Nat. Commun., 2015, 6, 7564 CrossRef PubMed.
Footnotes |
| † Experimental work was conducted by JCC (CCNF synthesis and characterisation; conductometry, NMR, SANS and TEM) with the support of WJS (conductometry and rheology). SMR lead the NMR studies with the support of RS and JCC. |
| ‡ Electronic supplementary information (ESI) available: Material characterisation, SANS fitting parameter information and NMR analyses. See DOI: 10.1039/c7sm02113e |
| This journal is © The Royal Society of Chemistry 2018 |

