 Open Access Article
Creative Commons Attribution 3.0 Unported Licence
Control of collagen gel mechanical properties through manipulation of gelation conditions near the sol–gel transition
A. J.
Holder
a,
N.
Badiei
ab,
K.
Hawkins
 bc,
C.
Wright
ab,
P. R.
Williams
ab and
D. J.
Curtis
 *ab
*ab
aComplex Fluids Research Group, College of Engineering, Swansea University, SA1 8EN. E-mail: d.j.curtis@swansea.ac.uk
bCentre for Nanohealth, Swansea University, SA2 8PP
cCollege of Medicine, Swansea University, SA2 8PP
First published on 15th January 2018
Abstract
The ability to control the mechanical properties of cell culture environments is known to influence cell morphology, motility, invasion and differentiation. The present work shows that it is possible to control the mechanical properties of collagen gels by manipulating gelation conditions near the sol gel transition. This manipulation is accomplished by performing gelation in two stages at different temperatures. The mechanical properties of the gel are found to be strongly dependent on the duration and temperature of the first stage. In the second stage the system is quickly depleted of free collagen which self assembles into a highly branched network characteristic of gelation at the higher temperature (37 °C). An important aspect of the present work is the use of advanced rheometric techniques to assess the transition point between viscoelastic liquid and viscoelastic solid behaviour which occurs upon establishment of a sample spanning network at the gel point. The gel time at the stage I temperature is found to indicate the minimum time that the gelling collagen sample must spend under stage I conditions before the two stage gelation procedure generates an enhancement of mechanical properties. Further, the Fractional Maxwell Model is found to provide an excellent description of the time-dependent mechanical properties of the mature collagen gels.
1 Introduction
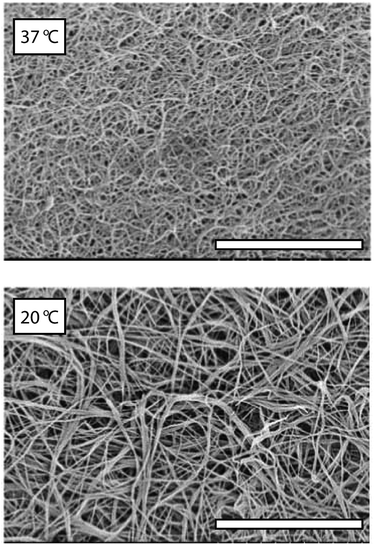
Type I collagen is the most abundant of the collagen proteins and is the primary structural biopolymer of bone and cartilage.1 The material also has inherent biocompatibility which makes it an attractive tissue engineering substrate. Upon neutralisation of acid solubilised collagen a gelation process ensues involving the formation of a branched fiber network, the morphology of which is known to be dependent on (amongst other parameters) the gelation temperature. Sub-physiological temperature (20 °C) gelation generates networks displaying a high degree of fiber bundling and large pore spaces,2 conversely, gelation at physiological temperature generates networks with small pore sizes and minimal fiber bundling (Fig. 1 shows SEM micrographs of network microstructures formed at 37 °C and 20 °C, respectively). Gel network morphology and elasticity have been shown to influence cell morphology, motility, invasion and differentiation3–6 and hence the ability to control the microstructural and mechanical properties of collagen gel networks is of significant scientific value.The mechanical properties are among the most sensitive measures of developing gel network microstructures7 and hence studies of microstructural changes associated with gelation are often performed using rheological experiments. The development of the gel network is a key event in gel formation and recent studies of fibrin gelation (which also results in the formation of a branched fiber network similar to that displayed by collagen gels) have shown that the mechanical/morphological properties of an incipient gel network (i.e. the first sample spanning network that appears) are a predictor of mature gel structure.8
The rheometrical study of gelation phenomena, which requires the frequency dependence of the rheological properties of the material under investigation to be measured as a function of time, can be achieved using a technique known as small amplitude oscillatory shear (SAOS).9 This technique involves the application of a small amplitude sinusoidal deformation (of angular frequency ω) to a material. The response of the material (i.e. a sinusoidal stress) is recorded and analysed to determine the complex modulus, G*(ω)(=G′ + iG′′), where the real and imaginary parts, G′ and G′′, are termed the storage and loss moduli, respectively.9,10 The former indicates the magnitude of energy storage during each complete cycle whilst the latter indicates the magnitude of energy dissipation (i.e. viscous losses) during each cycle. A fourth parameter, the loss tangent, tan![[thin space (1/6-em)]](https://www.rsc.org/images/entities/char_2009.gif) δ, defined as tan
δ, defined as tan![[thin space (1/6-em)]](https://www.rsc.org/images/entities/char_2009.gif) δ = G′′/G′, denotes the ratio of elastic energy storage and viscous energy dissipation occurring within each cycle with δ = 90° (i.e. tan
δ = G′′/G′, denotes the ratio of elastic energy storage and viscous energy dissipation occurring within each cycle with δ = 90° (i.e. tan![[thin space (1/6-em)]](https://www.rsc.org/images/entities/char_2009.gif) δ = ∞) and δ = 0° (i.e. tan
δ = ∞) and δ = 0° (i.e. tan![[thin space (1/6-em)]](https://www.rsc.org/images/entities/char_2009.gif) δ = 0) indicating purely viscous and purely elastic behaviour, respectively. For viscoelastic materials, i.e. materials that display a combination of viscous and elastic behaviour; the phase angle can take any value between these limits. However, classification of a material as a viscoelastic liquid, VEL, or viscoelastic solid, VES, (or a critical gel, CG, a distinct viscoelastic state intermediate between VEL and VES states11 and which is associated with the establishment of the incipient gel network) requires that G* and/or tan
δ = 0) indicating purely viscous and purely elastic behaviour, respectively. For viscoelastic materials, i.e. materials that display a combination of viscous and elastic behaviour; the phase angle can take any value between these limits. However, classification of a material as a viscoelastic liquid, VEL, or viscoelastic solid, VES, (or a critical gel, CG, a distinct viscoelastic state intermediate between VEL and VES states11 and which is associated with the establishment of the incipient gel network) requires that G* and/or tan![[thin space (1/6-em)]](https://www.rsc.org/images/entities/char_2009.gif) δ be determined over a range of frequency.
δ be determined over a range of frequency.
Fig. 2 illustrates the linear viscoelastic response of a material undergoing gelation. Initially, the material behaves as a VEL with tan![[thin space (1/6-em)]](https://www.rsc.org/images/entities/char_2009.gif) δ decreasing with increasing frequency, upon establishment of a sample spanning network at the gel point, GP, where the value of tan
δ decreasing with increasing frequency, upon establishment of a sample spanning network at the gel point, GP, where the value of tan![[thin space (1/6-em)]](https://www.rsc.org/images/entities/char_2009.gif) δ is momentarily independent of frequency (characteristic of the CG state). Post-GP the material displays VES behaviour with tan
δ is momentarily independent of frequency (characteristic of the CG state). Post-GP the material displays VES behaviour with tan![[thin space (1/6-em)]](https://www.rsc.org/images/entities/char_2009.gif) δ increasing with increasing frequency. The concept of the GP is often exploited in industrial applications and has recently been used in healthcare technologies.12 Previous attempts at characterising the GP of collagen gels have resulted in contradictory results, however, the rheometric methodologies employed in such studies relied on either data at a single frequency13 (which provides insufficient data to accurately determine the GP) or the combination of data obtained from duplicate samples probed at different frequencies.14
δ increasing with increasing frequency. The concept of the GP is often exploited in industrial applications and has recently been used in healthcare technologies.12 Previous attempts at characterising the GP of collagen gels have resulted in contradictory results, however, the rheometric methodologies employed in such studies relied on either data at a single frequency13 (which provides insufficient data to accurately determine the GP) or the combination of data obtained from duplicate samples probed at different frequencies.14
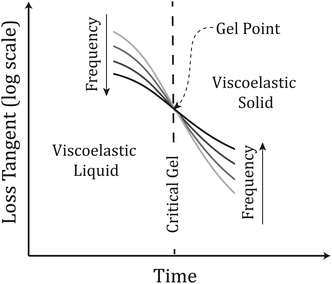 | ||
| Fig. 2 Profile of rheometric parameters during gelation. Before the Gel Point, the material displays VEL behaviour whilst after the GP the material displays VES behaviour. | ||
In the present work, advanced rheometric techniques which adhere to the rheometrical constraints of the gelation process (see Section 2) are employed to probe the evolving rheological properties of gelling collagen samples. The techniques allow this characterisation to be performed at multiple frequencies simultaneously and permit accurate identification of the GP for individual samples. It is hypothesised that informed manipulation of the gelation conditions around the GP may afford enhanced control over the mechanical and structural properties of the collagen gel network thus providing an enhanced degree of control over tissue engineering scaffold design.
2 Materials & methods
2.1 Collagen gel preparation
Acid solubilised Type I Rat Tail collagen (RTC) (First Link Ltd, UK) was aliquoted under sterile conditions and stored at 4 °C until required. A neutralisation solution was prepared using appropriate volumes of 10× Dulbecco's Modified Eagle's Medium (DMEM) (Gibco), 0.25 M NaOH (Fluka), sterile water, Feotal Bovine Serum (Gibco) and 1× DMEM (Gibco) such that upon mixing the required volumes of RTC and the neutralisation solution a pH 7.4 sample containing collagen (at the desired concentration) in αMEM was obtained. All reagents were kept on ice during sample preparation and the rheometers temperature control system was set to 5 °C before the appropriate amount of sample was loaded to the rheometer plate; polymerisation was initiated by bringing the sample to the desired temperature using the rheometers temperature control system. A minimal amount of 10 mPa s silicone oil (Brookfield) was added to the free surface of the sample to prevent evaporation.2.2 Frequency sweep based gel point measurement
A frequency sweep, FS, approach to GP determination was employed. This technique requires that a repeating sequence of discrete frequency waveforms be applied to the material as it undergoes gelation.15 A TA Instruments AR-G2 rheometer fitted with a 60 mm diameter aluminium parallel plate geometry (with a gap of 380 μm) was used to measure the GP of collagen gels at 1.5 mg ml−1. The gelation process was studied at temperatures between 16 °C and 24 °C with sample mutation artefacts (associated with the rapidity of gelation15) precluding GP acquisition at temperatures exceeding 24 °C. A repeating sequence of sinusoidal waveforms (with f = [0.4 Hz, 0.8 Hz, 1.6 Hz, 2.0 Hz] at a torque amplitude of 6.5 μN m) was applied to the material throughout gelation. The third harmonic content of the response waveforms was monitored as a measure of linearity16 and was found to remain less than 0.001 throughout. The absence of a third harmonic contribution in the response waveforms also confirmed that the measurements were free of slip artefacts.172.3 FTMS based gel point measurement
Whilst the FS approach does not require data obtained on duplicate samples to be merged in order to determine the GP, it does require that the sample microstructure be developing sufficiently slowly for the material to be assumed quasi-stable around the GP.15 A more advanced rheometric technique, Fourier Transform Mechanical Spectroscopy, FTMS, has also been used to determine the gel time for collagen gels undergoing gelation where the rate of gelation precludes the use of FS rheometry (i.e. at temperatures T > 24 °C). The FTMS technique utilises a multi-frequency waveform, generated by summation of a sinusoidal waveform at a base frequency and several of its harmonic waveforms,18 to simultaneously probe the frequency dependent linear viscoelastic properties of the sample at multiple frequencies. A Fourier transform routine is then used to extract data at each of the component frequencies thus allowing the viscoelastic state of a sample to be determined at any given time.A TA Instruments ARES-G2 rheometer fitted with a 50 mm titanium parallel plate geometry was used to measure the GP of collagen gels at 3 mg ml−1; instrument resolution limits prevented the measurements being performed at lower concentrations. The gelation process was studied at temperatures between 16 °C and 28 °C with sample mutation artefacts precluding GP acquisition at temperatures exceeding 28 °C. A Fourier Transform Mechanical Spectroscopy time sweep was performed using a fundamental frequency of 0.5 Hz and harmonic components at 1 Hz, 1.5 Hz, 2.5 Hz and 5 Hz. It is not appropriate to use the 3rd harmonics content of the FTMS waveform as a measure of linearity (as for FS measurements16), however, preliminary tests, in which the 3rd harmonic contribution of a single frequency (1 Hz) time sweep was monitored confirmed that the tests could be maintained within the linear viscoelastic range during gelation by decreasing the strain amplitude when a maximum torque of 5 μN m was exceeded, as such the strain amplitude at the GP was typically 8%, absence of the third harmonic component in these results also confirmed the absence of slip artefacts.17
2.4 Mature gel rheological characterisation
Following identification of the GP using the FS approach, gelation was allowed to proceed until the appearance of a plateau in G′ (which was monitored at 1 Hz during maturation). The temperature was then raised to 37 °C for 2 hours before a creep experiment was undertaken. The creep experiment monitored the evolution of the samples compliance (J = γ(t)/σ0) for 3600 s following imposition of a step shear stress (σ = 0.05 Pa). In order to study the effect of a step change in gelation conditions on the mechanical properties of collagen gels, in a second set of experiments, samples were held at 20 °C (T1) for an interval Δ (0 s ≤ Δ ≤ 1200 s) before the temperature was rapidly ramped to 37 °C (T2). The gel was then allowed to mature at 37 °C for 2 hours before the creep test was performed at 37 °C.2.5 Scanning electron miscroscopy
Collagen gels were formed under the required temperature profile in a rheometer geometry covered in polyethylene film (to facilitate removal of the intact gel). Rheological measurements were not performed during these runs (i.e. no stress or deformation was applied to the material). After being carefully removed from the plate, the collagen gel was washed 3 times with 50 mM sodium cacodylate–HCl buffer solution (pH 7.2–7.4, SPI supplies) at 10 to 20 minute intervals. The collagen gel was then fixed overnight using 2% glutaraldehyde before being dehydrated using a series of ethanol concentrations (30% to 100%). The sample was then rinsed once in 50% hexamethyldisilazone solution (HDMS) in ethanol (10 minutes) and three times in 100% HDMS for 15 minutes in a fume hood before being left to dry overnight. The sample was then sputter coated with approximately 15 nm of gold before being imaged by SEM (Hitachi 4800).3 Results & discussion
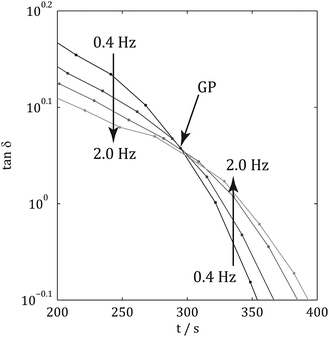
Fig. 3 and 4 show the evolution of tan![[thin space (1/6-em)]](https://www.rsc.org/images/entities/char_2009.gif) δ(ω) for a typical collagen sample undergoing gelation (at 20 °C) and the relationship between gel time, tg, and gelation temperature, T, respectively (at a collagen concentration of 1.5 mg ml−1). Increasing temperature can be seen to progressively reduce gelation time and at temperatures greater than 24 °C the acquisition of GP data using the FS procedure was not possible; this limit marking the onset of sample mutation effects15,18 associated with rapid gelation at these temperatures. The use of the FTMS technique allowed data acquisition to be extended as high as 28 °C (with tg = 53 ± 6 s) at 3 mg ml−1 (the increase in concentration being required to generate a resolvable torque signal for analysis). A recent study of collagen gelation using an alternative multi-frequency rheometric technique (Optimal Fourier Rheometery, OFR) reported the same limiting temperature.19 Interestingly, little difference was observed between tg at 1.5 mg ml−1 (acquired using the FS technique) and 3 mg ml−1 (acquired using the FTMS technique) for samples gelled at 20 °C and 24 °C, however, at lower temperatures the higher concentration gel formed more rapidly. These results are summarised in Table 1 and suggest a transition between two gelation mechanisms.
δ(ω) for a typical collagen sample undergoing gelation (at 20 °C) and the relationship between gel time, tg, and gelation temperature, T, respectively (at a collagen concentration of 1.5 mg ml−1). Increasing temperature can be seen to progressively reduce gelation time and at temperatures greater than 24 °C the acquisition of GP data using the FS procedure was not possible; this limit marking the onset of sample mutation effects15,18 associated with rapid gelation at these temperatures. The use of the FTMS technique allowed data acquisition to be extended as high as 28 °C (with tg = 53 ± 6 s) at 3 mg ml−1 (the increase in concentration being required to generate a resolvable torque signal for analysis). A recent study of collagen gelation using an alternative multi-frequency rheometric technique (Optimal Fourier Rheometery, OFR) reported the same limiting temperature.19 Interestingly, little difference was observed between tg at 1.5 mg ml−1 (acquired using the FS technique) and 3 mg ml−1 (acquired using the FTMS technique) for samples gelled at 20 °C and 24 °C, however, at lower temperatures the higher concentration gel formed more rapidly. These results are summarised in Table 1 and suggest a transition between two gelation mechanisms.
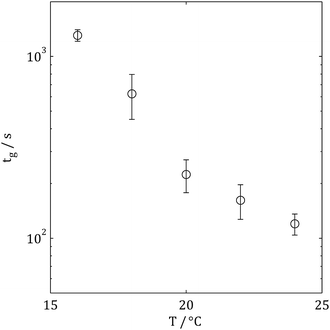 | ||
| Fig. 4 Gelation time as a function of temperature at c = 1.5 mg ml−1 as measured using the FS rheometric approach, error bars represent standard deviation (with N = 3). | ||
| Gelation temperature | Gel time/s | |
|---|---|---|
| c = 1.5 mg ml−1 (FS) | c = 3 mg ml−1 (FTMS) | |
| 28 °C | NA | 53 ± 6 |
| 24 °C | 120 ± 16 | 120 ± 13 |
| 20 °C | 223 ± 46 | 219 ± 17 |
| 16 °C | 1306 ± 95 | 675 ± 129 |
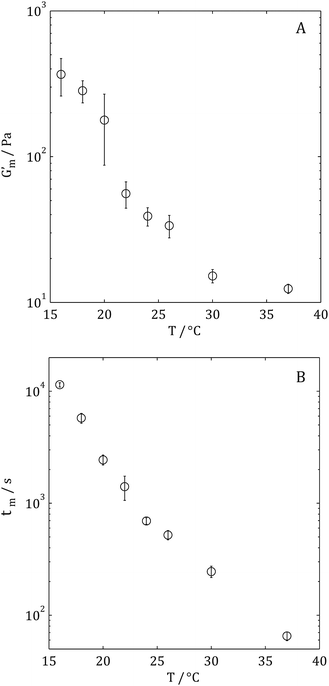
Following measurement of the GP, samples were allowed to mature between the rheometer plates (until a plateau value of G′ at 1 Hz was observed, denoted Gm′ herein). Fig. 5A shows Gm′ of gels formed using single temperature gelation conditions (note that all measurements of Gm′ were performed at 37 °C regardless of gelation condition in order to negate the temperature dependence of the moduli). Fig. 5B shows the temperature dependence of the maturation time, tm, under single temperature gelation conditions. Whilst measurement of tg was not possible where gelation occurred at T > 28 °C, it was possible to measure both Gm′ and tm under such conditions; Gm′ being achieved in less than 60 s.
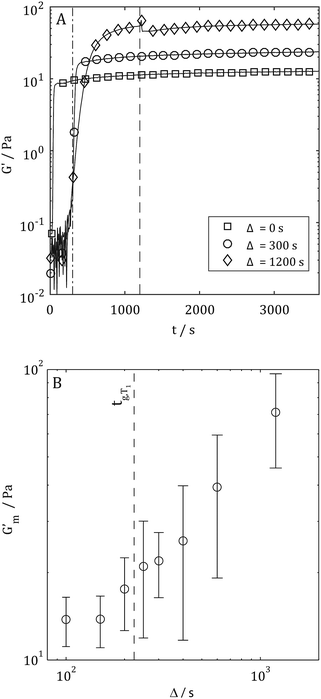
Having characterised the temperature dependence of tg, Gm′, and tm, it was hypothesised that an alternative procedure for generating collagen scaffolds with a bespoke Gm′ involved the use of multiple temperature gelation conditions. In such an experiment, the gel time at the initial temperature, tg,T1, i.e. the time required to establish a sample spanning network, would provide essential information concerning optimisation of gelation conditions. Fig. 6A shows representative G′(t) profiles during gelation for Δ = 0 s, 300 s and 1200 s whilst Fig. 6B shows Gm′ achieved by performing gelation at 20 °C for Δ seconds (the hold time) before the temperature was increased to 37 °C. A gradual increase in Gm′ with increasing Δ is clearly evident in Fig. 6 with the first enhancement of Gm′ occurring where Δ ≃ tg,T1 (marked with a dashed line). Fig. 7 shows an SEM micrograph of a mature gel formed at 20 °C for Δ = 300 s followed by maturation at 37 °C. The presence of two distinct microstructures is clearly evident with characteristics of networks formed at both sub-physiological temperature (course network with fiber bundling, see Fig. 1) and physiological temperature (fine network with minimal bundling, see Fig. 1). Raising the gelation temperature to 37 °C appears to lead to rapid gelation of free collagen at the time of transition from T1 to T2. This rapid gelation results in a 'fine' network around the partially formed ‘coarse’ network characteristic of gelation at T1. The presence of the partially formed course network provides enhancement of the mechanical properties over those characteristic of single condition gelation at T2.
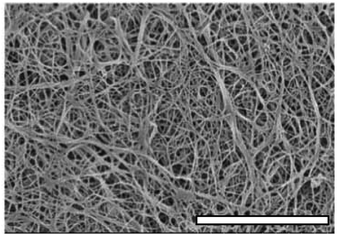 | ||
| Fig. 7 SEM of a collagen gel network formed under a two stage temperature profile, the gelation temperature was held at 20 °C for 200 s before being raised to 37 °C. Scale bars is 5 μm. | ||
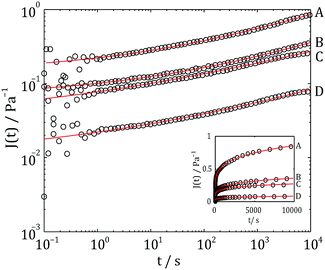
Having shown that the microstructure of a collagen gel network can be controlled by manipulating the gelation conditions near the gel point, the research focused on characterising the time dependent rheological properties of the mature collagen network formed under such conditions. Long time scale relaxation/retardation processes are often best characterised using creep measurements. Fig. 9 shows the creep response of gels formed under single temperature conditions at (A) 37 °C and (D) 20 °C and two step gelation conditions, 20 °C for (B) 200 s and (C) 300 s, 37 °C thereafter. It is evident from Fig. 9 that the time-dependent rheological properties of the gel formed under two step conditions are intermediate between those of gels formed under single temperature gelation at T1 and T2, respectively.
The Fractional Maxwell Model (FMM) has been previously reported to accurately describe the time dependent viscoelastic behaviour of other gel systems.20 Whilst the use of fractional calculus to describe the rheological properties of biomaterials is currently a rapidly developing field, its use was first suggested by Scott-Blair in 1942.21,22 Indeed, the use of ‘power equations’ in the absence of a general equation for describing collagenous tissues was reported in 1964.23,24 The FMM makes use of a hypothetical mechanical element with properties intermediate between those of the classical dashpot and spring that is termed a spring-pot. The constitutive equation for such an element can be written as
 | (1) |
The FMM connects two spring-pot elements in series (Fig. 8). Stress is assumed constant throughout the assembly whilst strains are additive thus leading to the following equation which describes creep in FMM materials:20
 | (2) |
![[Doublestruck V]](https://www.rsc.org/images/entities/char_e179.gif) and
and ![[Doublestruck G]](https://www.rsc.org/images/entities/char_e16a.gif) quasi-properties of the spring-pots with units of Pa sα and Pa sβ, respectively. A precise physical meaning cannot be assigned to the parameters
quasi-properties of the spring-pots with units of Pa sα and Pa sβ, respectively. A precise physical meaning cannot be assigned to the parameters ![[Doublestruck V]](https://www.rsc.org/images/entities/char_e179.gif) and
and ![[Doublestruck G]](https://www.rsc.org/images/entities/char_e16a.gif) without recourse to the values of the exponents α and β; where α = 1 and β = 0 the FMM reduces to the Newtonian fluid whilst if α = β = 1 the model represents a standard Hookean solid. In the more general case where 0 < β < α < β the parameters
without recourse to the values of the exponents α and β; where α = 1 and β = 0 the FMM reduces to the Newtonian fluid whilst if α = β = 1 the model represents a standard Hookean solid. In the more general case where 0 < β < α < β the parameters ![[Doublestruck V]](https://www.rsc.org/images/entities/char_e179.gif) and
and ![[Doublestruck G]](https://www.rsc.org/images/entities/char_e16a.gif) can only be termed quasi-properties with stress relaxation properties intermediate between those of the Newtonian Liquid and the Hookean solid.
can only be termed quasi-properties with stress relaxation properties intermediate between those of the Newtonian Liquid and the Hookean solid.
 | ||
| Fig. 8 Fractional Maxwell Model consisting of two spring pots intermediate between the Hookean spring and the Newtonian dashpot. | ||
Interestingly the data presented herein can be fitted exceptionally well using eqn (2) (Fig. 9), however, since the parameters ![[Doublestruck V]](https://www.rsc.org/images/entities/char_e179.gif) and
and ![[Doublestruck G]](https://www.rsc.org/images/entities/char_e16a.gif) have units dependent on α and β, respectively, it is difficult to draw meaningful conclusions based on a comparison of their values. It was noted that the values of α and β lay within narrow ranges of 0.29 ± 0.04 and 0.05 ± 0.03, respectively. Hence, in order to permit a comparison of the time dependent rheological properties of the materials, the values of α and β were fixed at α = 0.3 and β = 0.05. It is important to note that the choice of these values of α and β was arbitrary and did not impact on the quality of the resulting curve fitting. Values of
have units dependent on α and β, respectively, it is difficult to draw meaningful conclusions based on a comparison of their values. It was noted that the values of α and β lay within narrow ranges of 0.29 ± 0.04 and 0.05 ± 0.03, respectively. Hence, in order to permit a comparison of the time dependent rheological properties of the materials, the values of α and β were fixed at α = 0.3 and β = 0.05. It is important to note that the choice of these values of α and β was arbitrary and did not impact on the quality of the resulting curve fitting. Values of ![[Doublestruck V]](https://www.rsc.org/images/entities/char_e179.gif) and
and ![[Doublestruck G]](https://www.rsc.org/images/entities/char_e16a.gif) for the constrained model are shown in Fig. 10. It is again evident that the properties of gels formed under two step gelation conditions are intermediate between those of gels formed under single temperature gelation at T1 and T2, respectively. Time dependent rheological responses which display no dominant features are displayed by all the gels studied herein (as expected for gel-like systems). Interestingly, this does not appear to be compromised by the presence of multiple microstructurally distinct elements within a single gel. The observation that the time dependent rheological properties of the collagen matrix adhere to the Fractional Maxwell Model with α = 0.3 and β = 0.05 is both novel and important in modelling and simulation of the extracellular matrix, which have previously employed traditional mechanical models involving springs and dashpots.25–28 These findings suggest that a more appropriate mechanical model may include the spring-pot and draw on fractional calculus based descriptions of extracellular matrix viscoelasticity.
for the constrained model are shown in Fig. 10. It is again evident that the properties of gels formed under two step gelation conditions are intermediate between those of gels formed under single temperature gelation at T1 and T2, respectively. Time dependent rheological responses which display no dominant features are displayed by all the gels studied herein (as expected for gel-like systems). Interestingly, this does not appear to be compromised by the presence of multiple microstructurally distinct elements within a single gel. The observation that the time dependent rheological properties of the collagen matrix adhere to the Fractional Maxwell Model with α = 0.3 and β = 0.05 is both novel and important in modelling and simulation of the extracellular matrix, which have previously employed traditional mechanical models involving springs and dashpots.25–28 These findings suggest that a more appropriate mechanical model may include the spring-pot and draw on fractional calculus based descriptions of extracellular matrix viscoelasticity.
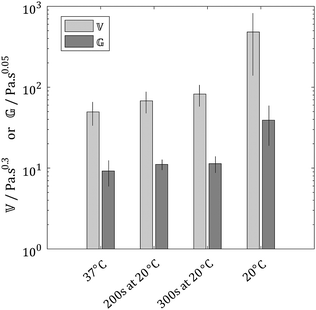 | ||
Fig. 10 Comparison of ![[Doublestruck V]](https://www.rsc.org/images/entities/char_e179.gif) and and ![[Doublestruck G]](https://www.rsc.org/images/entities/char_e16a.gif) for gels formed under different conditions, error bars denote the standard deviation (with N = 3). for gels formed under different conditions, error bars denote the standard deviation (with N = 3). | ||
4 Conclusions
The results of this study confirm that informed manipulation of the gelation conditions around the sol–gel transition affords a unique degree of control over the rheological properties of the collagen gel network. This finding is highly relevant to the field of tissue engineering in which collagen scaffolds are often used as matrices with the aim of optimising and guiding cell growth; these processes being governed by the cell-extracellular matrix interaction.3–6 Further, for the first time, the Fractional Maxwell Model has been shown to provide an excellent description of the time-dependent linear viscoelastic characteristics of mature collagen gel networks. The significance of this is that, current attempts at modelling cell-matrix interactions have been limited to the use of standard mechanical models of viscoelastic materials (i.e. employing an assembly of springs and dashpots).25–28 The work presented herein suggests that a more appropriate approach will involve the use of spring-pots which accurately capture the relaxation/retardation properties of the collagen gel network using minimal parameters.Conflicts of interest
There is no conflict of interest to declare.Acknowledgements
The authors gratefully acknowledge the support EPSRC grant EP/H045848.References
- P. Fratzl, in Collagen: Structure and Mechanics, ed. P. Fratzl, Springer, US, Boston, 2008, ch. 1, pp. 1–13 Search PubMed.
- C. B. Raub, V. Suresh, T. Krasieva, J. Lyubovitsky, J. D. Mih, A. J. Putnam, B. J. Tromberg and S. C. Geprge, Biophys. J., 2007, 92, 2212–2222 CrossRef CAS PubMed.
- T. A. Ulrich, A. Jain, K. Tanner, J. L. MacKay and S. Kumar, Biomaterials, 2010, 31, 1875–1884 CrossRef CAS PubMed.
- T. A. Ulrich, T. G. Lee, H. K. Shon, D. W. Moon and S. Kumar, Biomaterials, 2011, 32, 5633–5642 CrossRef CAS PubMed.
- A. J. Engler, S. Sen, H. L. Sweeney and D. E. Discher, Cell, 2006, 126, 677–689 CrossRef CAS PubMed.
- J. Xie, M. Bao, S. M. C. Bruekers and W. T. S. Huck, ACS Appl. Mater. Interfaces, 2017, 9, 19630–19637 CAS.
- J. W. Weisel, Biophys. Chem., 2004, 112, 267–276 CrossRef CAS PubMed.
- D. J. Curtis, P. R. Williams, N. Badiei, A. I. Campbell, K. Hawkins, P. A. Evans and M. R. Brown, Soft Matter, 2013, 9, 4883–4889 RSC.
- K. Walters, Rheometry, Chapman and Hall Ltd, 1975 Search PubMed.
- R. W. Whorlow, Rheological Techniques, Ellis Horwood Ltd, 2nd edn, 1992 Search PubMed.
- F. Chambon and H. H. Winter, J. Rheol., 1987, 31, 683–697 CrossRef CAS.
- M. J. Lawrence, A. Sabra, G. Mills, S. G. Pillai, W. Abdullah, K. Hawkins, R. H. K. Morris, S. J. Davidson, L. A. D'Silva, D. J. Curtis, M. R. Brown, J. W. Weisel, P. R. Williams and P. A. Evans, Br. J. Haematol., 2015, 168, 571–575 CrossRef PubMed.
- Y. L. Yang and L. J. Kaufman, Biophys. J., 2009, 96, 1566–1585 CrossRef CAS PubMed.
- G. Forgacs, S. A. Newman, B. Hinner, C. W. Maier and E. Sackmann, Biophys. J., 2003, 84, 1272–1280 CrossRef CAS PubMed.
- M. Mours and H. H. Winter, Rheol. Acta, 1994, 33, 385–397 CrossRef CAS.
- K. Hawkins, P. A. Evans, M. Lawrence, D. J. Curtis, M. Davies and P. R. Williams, Rheol. Acta, 2010, 49, 891–900 CrossRef CAS.
- A. Yoshimura and R. K. Prud'homme, J. Rheol., 1988, 32, 575–584 CrossRef CAS.
- K. Hawkins, M. Lawrence, P. R. Williams and R. L. Williams, J. Non-Newtonian Fluid Mech., 2008, 148, 127–133 CrossRef CAS.
- D. J. Curtis, A. Holder, N. Badiei, J. Claypole, M. Walters, B. Thomas, M. Barrow, D. Deganello, M. R. Brown, P. R. Williams and K. Hawkins, J. Non-Newtonian Fluid Mech., 2015, 222, 253–259 CrossRef CAS.
- A. Jaishankar and G. H. McKinley, Proc. R. Soc. London, Ser. A, 2012, 469, 20120284 CrossRef.
- G. W. Scott-Blair and F. M. V. Coppen, Am. J. Psychol., 1942, 55, 215–229 CrossRef.
- G. W. Scott-Blair, A survey of general and applied rheology, Pitman & Sons, 1942 Search PubMed.
- R. M. Kenedi, T. Gibson and C. H. Daly, Bio-engineering studies of the human skin: The effects of unidirectional tension, in Structure and function of connective and skeletal tissue, NATO Advanced Study Institute, St. Andrews, Butterworth, 1964, pp. 388–397 Search PubMed.
- G. W. Scott-Blair, An Introduction to Biorheology, Elsevier Scientific Publishing Company, 1974 Search PubMed.
- Y. Jamali, M. Azimi and M. R. K. Mofrad, PLoS One, 2010, 5, e12097 Search PubMed.
- M. L. Oyen, Int. Mater. Rev., 2014, 59, 44–59 CrossRef CAS.
- T. Bronshtein, G. C. T. Au-Yeung, U. Sarig, E. B. Nguyen, P. S. Mhaisalkar, F. Y. C. Boey, S. S. Ventkatraman and M. Machluf, Tissue Eng., Part C, 2013, 19, 620–630 CrossRef CAS PubMed.
- B. Xu, H. Li and Y. Zhang, Biomatter, 2013, 3, e24651 CrossRef PubMed.
| This journal is © The Royal Society of Chemistry 2018 |

