 Open Access Article
Purely-elastic flow instabilities and elastic turbulence in microfluidic cross-slot devices
P. C.
Sousa
 a,
F. T.
Pinho
 b and
M. A.
Alves
 *a
*a
aDepartamento de Engenharia Química, CEFT, Faculdade de Engenharia da Universidade do Porto, Rua Dr. Roberto Frias, 4200-465 Porto, Portugal. E-mail: mmalves@fe.up.pt
bCEFT, Departamento de Engenharia Mecânica, Faculdade de Engenharia da Universidade do Porto, Rua Dr. Roberto Frias, 4200-465 Porto, Portugal
First published on 29th January 2018
Abstract
We experimentally investigate the dynamics of viscoelastic fluid flows in cross-slot microgeometries under creeping flow conditions. We focus on the unsteady flow regime observed at high Weissenberg numbers (Wi) with the purpose of understanding the underlying flow signature of elastic turbulence. The effects of the device aspect ratio and fluid rheology on the unsteady flow state are investigated. Visualization of the flow patterns and time-resolved micro-particle image velocimetry were carried out to study the fluid flow behavior for a wide range of Weissenberg numbers. A periodic flow behavior is observed at low Weissenberg numbers followed by a more complex dynamics as Wi increases, eventually leading to the onset of elastic turbulence for very high Weissenberg numbers.
Introduction
Viscoelastic fluids, which include solutions of flexible high molecular weight polymers, polymer melts or aqueous solutions of surfactants, present distinct rheological properties and behave differently as compared to Newtonian or Generalized Newtonian fluids. For Newtonian fluids, it is well-known that irregular flow patterns are observed above a critical Reynolds number and the transition from laminar to turbulent flow occurs due to inertial effects in the nonlinear advective term of the Navier–Stokes equation.For viscoelastic fluids, in addition to the non-linear advective effects, there are also non-linear rheological effects that manifest through the generation of large normal stresses which result in complex flow phenomena. In particular, viscoelastic fluid flows are prone to develop instabilities in the absence of inertial effects, hence purely-elastic, as is the case observed in microfluidics due to the characteristic small length scales. Following the pioneering work of Muller et al.,1 purely-elastic flow instabilities have been investigated in different flow configurations. Earlier investigations focused on the onset of purely-elastic instabilities in shear flows with curved streamlines, such as the Couette flow between rotating cylinders2,3 and the swirling flow between two plates,4 both relevant in rheometry. More recently, extensionally-dominated flows have also been investigated with emphasis on contraction–expansion microgeometries5,6 and stagnation point flows, such as the T-channel7 and the cross-slot device.8–12 Elastic instabilities occurring in these extensional flows are related with the molecular coil-stretch transition that occurs when the Weissenberg number (Wi) exceeds a critical value, Wic ≈ 0.5.
The onset of purely elastic flow instabilities has been attributed to a combination of streamline curvature and the generation of large tensile stresses, elegantly represented in the Pakdel–McKinley criterion (PMcK) for determining the instability threshold.13,14 Zilz et al.15 used this criterion to describe the instability onset in the viscoelastic fluid flow in serpentine micro-channels. More recently, Cruz et al.16 also used the PMcK criterion to study the mechanisms of the purely-elastic steady bifurcation and transition to time-dependent flow in the cross-slot device; by performing numerical simulations using the upper-convected Maxwell (UCM) and the simplified Phan–Thien–Tanner (sPTT) viscoelastic constitutive models, the authors found that the elastic stresses generated near the corners are lower than at the stagnation point, but the streamline curvature is larger and the velocity magnitude is also higher, suggesting that the corner region is the primary source for the onset of the flow instability. Interestingly, for the flow in the microfluidic optimized-shape cross-slot extensional rheometer (OSCER),17,18 the highest streamline curvature occurs near the stagnation point, where the PMcK instability criterion reaches the maximum values due to the high elastic stresses and non-zero velocities.19
Elastic instabilities can stimulate a disordered flow state generated by large normal stresses and the flow field may evolve to the so-called elastic turbulence regime at surprisingly low Reynolds numbers (Re), as reviewed by Li et al.20 The concept of elastic turbulence was described in the experimental work of Vinogradov and Manin,21 which used fluids with a high elasticity level flowing in a rotational device at non-negligible Reynolds numbers (Re ≈ 7). However, it was the seminal work by Groisman and Steinberg22 that first described in detail the development of elastic turbulence at vanishing Re in a swirling flow when the Weissenberg number exceeds a critical value. The authors established that the onset of this new flow regime is ascribed to large elastic stresses. Subsequently, a detailed experimental investigation was carried out by the same authors in three different systems, namely a shear flow between two circular plates, a Couette-Taylor flow and a Dean flow.4 With the increase of Wi, different flow features typical of turbulent flows were observed, namely chaotic-like fluctuations of fluid motion over a broad range of spatial and temporal scales and a significant growth of flow resistance, even at vanishing Reynolds numbers. In addition, the power spectra of velocity fluctuations were found to decay over a wide range of scales following a power-law with exponents of about −3.5. Fouxon and Lebedev23 performed a theoretical analysis and established that exponents lower than −3 reveal the existence of an elastic turbulent regime. The transition to elastic turbulence can show hysteresis22 and depends on the complex rheological behavior of the fluid and on the strain history it experiences, which is induced by the channel topology as reviewed by Morozov and van Saarloos.24 Since Wi is inversely proportional to the characteristic flow length scale, elastic turbulence is efficiently triggered at small length scales20 and it has been proposed as a promising mechanism for mixing enhancement in microfluidic devices, even at very low Reynolds number flows25,26 since at this scale mixing occurs primarily by molecular diffusion in the absence of elastic effects. Hence, microfluidics is a promising tool to gain deeper insight on the underlying physical mechanisms of the onset of elastic instabilities and of a subsequent possible transition to a turbulent regime due to elastic nonlinearities.
In this work, we performed a detailed experimental investigation of high Weissenberg number unsteady flow of viscoelastic fluids aimed at exploring the evolution from the onset of purely elastic instabilities through the transition to elastic turbulence. This is carried out in a cross-slot channel with two different depths, resulting in different channel aspect ratios (AR), which is defined as the ratio between the depth and width of the cross-slot arms. Previously, we investigated the conditions for the onset of elastic instabilities10 and found that the viscoelastic fluid flow in a cross-slot device may lead to the appearance of two different elastic instabilities when Wi is increased, depending on the channel aspect ratio as well as on the rheological characteristics of the fluids. For low aspect ratios the top and bottom bounding walls have a stabilizing effect and only a transition from steady to unsteady flow is observed at high Wi. For higher aspect ratios (AR ≳ 0.5), the flow becomes asymmetric while remaining steady, above a first critical Wi, and then becomes time-dependent above a second critical Wi which is lower than the critical Wi at low AR. However, the existence of these two instabilities depends also on the rheological characteristics of the viscoelastic fluid and only polymer solutions with a solvent viscosity ratio below a threshold value (β ≲ 0.05) lead to the onset of both types of elastic instabilities. Recently, Haward et al.19 investigated the flow of different monodisperse polymeric solutions in the OSCER device and found a new type of elastic instability, which is characterized by a lateral and time-dependent displacement of the stagnation point. This instability was reported for an intermediate range of Wi (0.7 ≲ Wi ≲ 2 for negligible Re) and when Wi is increased above a second critical value, the flow becomes globally unsteady as in a standard cross-slot device.
Here, we focus on the unsteady flow of different viscoelastic fluids with β < 0.05 and different elasticity levels in order to explore the onset of purely-elastic instabilities and ultimately the transition to the elastic turbulence regime. To this end we used a time-resolved micro-particle image velocimetry (μ-PIV) technique and performed visualizations of dye advection patterns in the cross-slot to characterize the flow instabilities.
Material and methods
Microchannel fabrication and experimental techniques
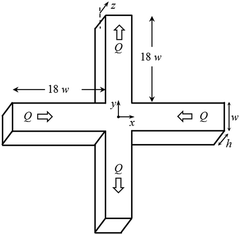
We used two sets of microchannels with similar width (w), but different depths (h). Fig. 1 shows a schematic representation of the channel with the main variables, and Table 1 presents their dimensions. The channel aspect ratio is defined as AR = h/w, and the four arms are identical. The length of the inlet/outlet channels is large enough (at least 18w) to ensure that the flow becomes fully-developed far upstream of the region of interest and remains unaffected by exit effects for all flow conditions investigated.| w (μm) | h (μm) | AR | |
|---|---|---|---|
| Channel 1 | 100 | 107 | 1.1 |
| Channel 2 | 96 | 170 | 1.8 |
The micro-devices were fabricated from SU-8 photoresist molds and made of polydimethylsiloxane (PDMS; Sylgard 184, Dow Corning) using standard soft-lithography techniques.27
The continuous flow was generated using a 3-module syringe pump (neMESYS, Cetoni GmbH), which feeds the two inlets at equal flow rates and removes the fluid from one outlet at the same flow rate. The remaining outlet is connected to a tube open to the atmosphere.
In order to visualize the flow patterns, a viscoelastic fluid containing a fluorescent dye (Rhodamine, Sigma-Aldrich) at low concentration (∼30 ppm) is injected in one inlet, whereas the same viscoelastic fluid without the fluorescent dye is injected in the other inlet. For the flow visualization, the setup consists of an inverted epi-fluorescent microscope (DMI5000M, Leica Microsystems GmbH), equipped with a 20× (NA = 0.25) objective, a mercury lamp as light source (100 W) and a high-speed camera (Fastcam Mini UX100, Photron), typically operating at 50 fps, was used for the measurement of the dye intensity levels.
For micro-particle image velocimetry measurements, the test fluids were seeded with 1.0 μm diameter fluorescent tracer particles (Nile Red, Molecular Probes, Invitrogen; Ex/Em: 535/575 nm) at a mass concentration of 400 ppm. The imaging system consisted of an inverted microscope (Olympus IX83) and a 10× (NA = 0.3) objective to focus at the center plane of the microchannel. The fluid was illuminated by a diode pumped pulsed 526.5 nm Nd:YLF laser (model LDY300, Litron Lasers) and images were captured using a high-speed CMOS camera (Phantom Miro M340, Vision Research). The time separation between laser pulses was chosen to achieve an average particle displacement of about 25% of the width of the final interrogation area. The analysis was performed with Dantec Dynamic Studio software (version 3.41, Dantec Dynamics) using an adaptive correlation with interrogation areas that reduce from 64 × 64 to 32 × 32 pixels with 50% overlap. The measurement depth (δzm) over which in-focus and out-of-focus particles contribute to the determination of the velocity field is estimated as δzm ≈ 27 μm.28
All experiments were performed at the center plane of the microchannel (i.e. mid-distance between top and bottom walls) at the room temperature, which varied slightly for both viscoelastic fluids under investigation: for PAA300 fluid, the temperature of the experiments was T = 24 ± 2 °C and for the PAA190 fluid it was T = 22 ± 1 °C.
Test fluids
Two viscoelastic solutions were used in this work, both prepared by adding a small amount of polyacrylamide (PAA, Mw = 18 × 106 g mol−1, Polysciences) to a water/glycerol Newtonian solvent as summarized in Table 2. The high viscosity of the fluid ensures that elastic nonlinearities prevail over inertial effects and consequently that the observed flow instabilities are purely-elastic. For comparison purposes, we also used a Newtonian fluid, whose composition is similar to the composition of the solvent of the PAA300 viscoelastic fluid.| Fluid | PAA (ppm) | Glycerol (% w/w) | c* (ppm) | η 0 (Pa s) | η s (Pa s) | Λ (s) | n | β | λ E (s) |
|---|---|---|---|---|---|---|---|---|---|
| PAA300 | 300 | 90 | 170 | 8.5 | 0.22 | 55 | 0.4 | 0.026 | 0.97 ± 0.19 |
| N90 | — | 90 | — | — | 0.161 | — | — | — | — |
| PAA190 | 190 | 70 | 130 | 2.15 | 0.035 | 45 | 0.4 | 0.016 | 0.59 ± 0.05 |
Shear rheology measurements were performed in a stress-controlled rheometer (Physica MCR301, Anton Paar) using a cone-plate geometry (75 mm diameter, 1° angle). The flow curves were measured at the average temperature of the microchannel experiments. Hence, for fluids PAA300 and N90, the rheological measurements were performed at T = 24 °C, and for fluid PAA190, at T = 22 °C.
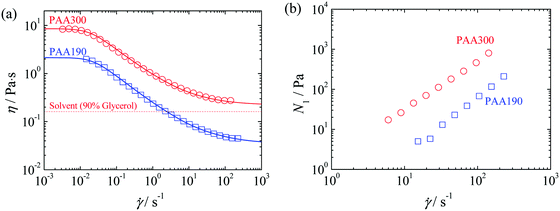
The variation of shear viscosity, η, with shear rate, ![[small gamma, Greek, dot above]](https://www.rsc.org/images/entities/i_char_e0a2.gif) , is shown in Fig. 2 for all fluids. The shear viscosity data were fitted to a Carreau model, η = ηs + (η0 − ηs)/[1 + (Λ
, is shown in Fig. 2 for all fluids. The shear viscosity data were fitted to a Carreau model, η = ηs + (η0 − ηs)/[1 + (Λ![[small gamma, Greek, dot above]](https://www.rsc.org/images/entities/i_char_e0a2.gif) )2](1−n)/2, where Λ is a time constant, n is the power-law index, and η0 and ηs are the low and high shear rate viscosity plateaus, respectively. The parameters of the model are presented in Table 2.
)2](1−n)/2, where Λ is a time constant, n is the power-law index, and η0 and ηs are the low and high shear rate viscosity plateaus, respectively. The parameters of the model are presented in Table 2.
To measure the relaxation time (λE) of the fluids in extensional flow, a capillary-breakup extensional rheometer (Haake CaBER1, Thermo Scientific) was used. The temperature of the extensional rheological measurements was the same as in the corresponding shear rheological measurements. The values of the extensional relaxation times are also presented in Table 2.
Results and discussion
In the flow experiments using the viscoelastic fluids in the cross-slot device, the Weissenberg number is defined as Wi = λE![[small epsi, Greek, dot above]](https://www.rsc.org/images/entities/i_char_e0a1.gif) , where the strain rate at the cross-slot center is estimated as
, where the strain rate at the cross-slot center is estimated as ![[small epsi, Greek, dot above]](https://www.rsc.org/images/entities/i_char_e0a1.gif) = U/(w/2), thus Wi = 2λEU/w. The Reynolds number is Re = ρUw/η(
= U/(w/2), thus Wi = 2λEU/w. The Reynolds number is Re = ρUw/η(![[small gamma, Greek, dot above]](https://www.rsc.org/images/entities/i_char_e0a2.gif) ), where η(
), where η(![[small gamma, Greek, dot above]](https://www.rsc.org/images/entities/i_char_e0a2.gif) ) is the shear rate dependent viscosity, evaluated at a characteristic shear rate,
) is the shear rate dependent viscosity, evaluated at a characteristic shear rate, ![[small gamma, Greek, dot above]](https://www.rsc.org/images/entities/i_char_e0a2.gif) = U/(w/2). For all experiments with the viscoelastic fluids Re ≲ 0.01, thus inertial effects are negligible and the instabilities observed are purely-elastic.
= U/(w/2). For all experiments with the viscoelastic fluids Re ≲ 0.01, thus inertial effects are negligible and the instabilities observed are purely-elastic.
Flow patterns
Visualizations of the flow field were carried out by feeding the fluids with fluorescent dye in one inlet and without dye in the other inlet. For both viscoelastic fluids used in this investigation, as the flow rate is progressively increased, we observed the onset of a first elastic instability, in which the flow field becomes asymmetric but remaining steady, followed by a second elastic instability toward unsteady flow, in agreement with previous findings.9,10,29 In the unsteady regime, the spatio-temporal fluctuations become increasingly stronger with the increase of Wi. Here, we are primarily interested in exploring in detail the flow behavior at those unsteady flow conditions. For fluid PAA300, we found that the flow becomes time-dependent for Wi ≳ 6 when the channel aspect ratio is 1.1 and for Wi ≳ 2.5 when AR = 1.8. Fig. 3 shows a sequence of dye patterns for the PAA300 fluid flow in the time-dependent regime. For comparison, we also show in Fig. 3 the Newtonian (fluid N90) flow patterns. The Newtonian flow remained steady and symmetric for the range of Re investigated (5.0 × 10⁻³ ≤ Re ≤ 4.0 × 10⁻²). An instability leading to the formation of a steady spiraling Newtonian flow is known to occur at Re ∼ 40 for AR = 1,30 which is significantly above the range of Re explored in this investigation.In order to characterize the unsteady flow regime at high Wi, we monitored the dye intensity in the outlet channels. Normalized concentration profiles were determined from the values of pixel intensity of the grayscale in the recorded images, since pixel intensity is proportional to the dye concentration, and linearly scaled to range between 0 and 1. Fig. 4 presents space-time diagrams of the normalized concentration at y = w or y = −w when Wi is increased for channels with AR = 1.1 (Fig. 4a–c) and AR = 1.8 (Fig. 4d–f).
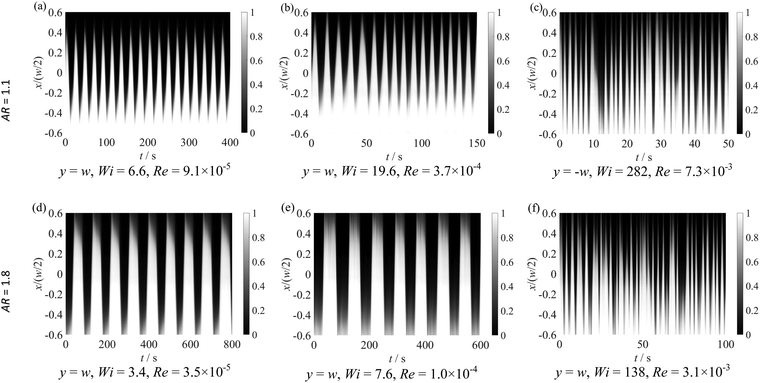 | ||
| Fig. 4 Space-time diagrams of the normalized dye concentration for fluid PAA300 illustrating the progressive increase of fluctuations as Wi is increased. | ||
Fig. 5a–f shows time series of the normalized dye concentration measured at the centerline (x = 0) of the outlet channels, at y = −w or y = w, for the same flow conditions shown in Fig. 4a–f. To reduce the high-frequency noise, the pixel intensity at each time is averaged over a circle with a radius of five pixels, centered at (x,y) = (0,±w), which is less than 3% of the channel width. Fig. 5b compares the results obtained in both outlet channels at the same distances from the stagnation point, at y = ±w, whereas the remaining figures present the results of the measurements in only one outlet channel, at y = w or y = −w. Fig. 5b shows that the dye concentration in the two outlets is out of phase, as expected from global mass conservation, which can be further attested by the flow patterns illustrated in Fig. 3b1–b3. For both aspect ratios, the fluctuations of dye concentration show a periodic behavior at low Wi, which is no longer observed when Wi increases. Fig. 6 presents the power spectra as a function of frequency computed from the dye concentration of some of the time series presented in Fig. 5.
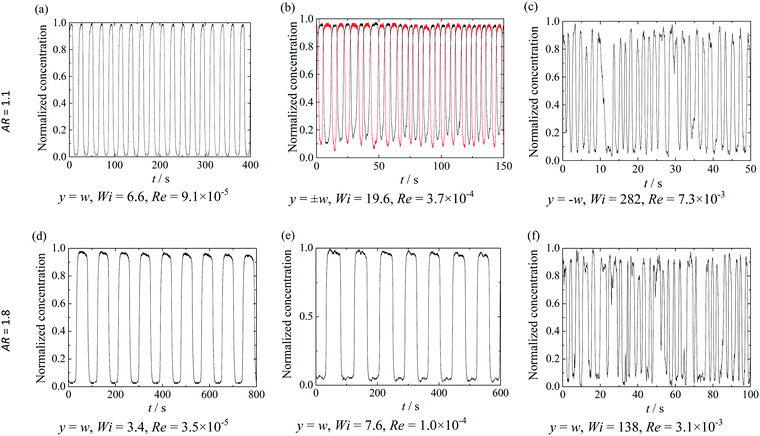 | ||
| Fig. 5 Normalized dye concentration in the outflow stream of the PAA300 viscoelastic fluid as a function of time for increasing Wi and both channel depths used (a–f). All plots show the normalized concentration measured at the centerline (x = 0) of one outlet channel at y = w or y = −w and plot (b) shows the results in both outlets at y = ±w. For all cases, we only show a fraction of the entire measured signal. The flow conditions are equivalent to those in Fig. 4a–f, respectively. | ||
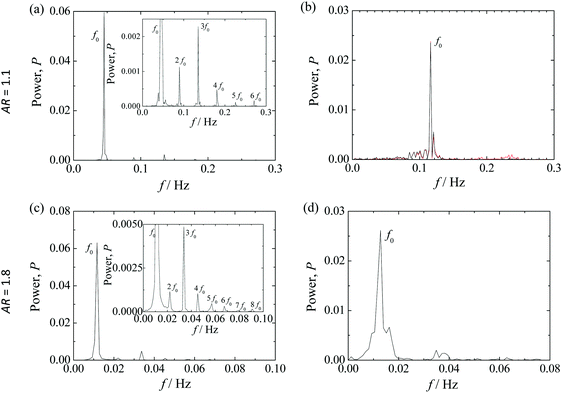 | ||
| Fig. 6 Spectral power of the normalized dye concentration as a function of the frequency for AR = 1.1 and AR = 1.8. Plots (a) and (b) correspond to the time series shown in Fig. 5(a) and (b), respectively, and plots (c) and (d) correspond to the time series of Fig. 5(d) and (e), respectively. (a) Wi = 6.6, Re = 9.1 × 10⁻⁵; (b) Wi = 19.6, Re = 3.7 × 10⁻⁴; (c) Wi = 3.4, Re = 3.5 × 10⁻⁵; (d) Wi = 7.6, Re = 1.0 × 10⁻⁴. | ||
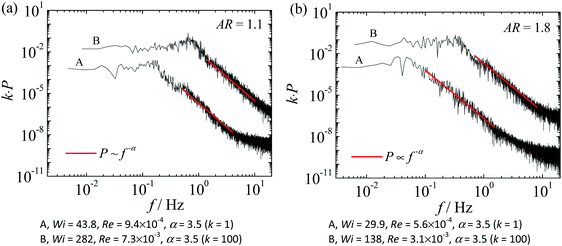
For low Wi, the power spectra show the presence of marked peaks, namely a fundamental frequency and some harmonics, as shown in Fig. 6a and c for AR = 1.1 and AR = 1.8, respectively. When Wi increases (e.g. Wi ∼ 20 for AR = 1.1 and Wi ∼ 8 for AR = 1.8), the fluctuations of the dye concentration progressively lose their ideal sinusoidal behavior but the power spectra still show a main frequency, f0, but now with a broader distribution. As Wi continues to increase, the range of frequencies of the power spectra further broadens, and may even show wide frequency tails, eventually becoming a continuous distribution. It is important to note that when the power spectra become continuous, the decay with frequency is over at least three orders of magnitude following a power-law function (P ∝ f−α) for all flow conditions investigated experimentally, as shown in Fig. 7.
For all Wi, the measurements were performed at the centerline (x = 0) of one outlet channel at y = ±w, except for Wi = 43.8 (AR = 1.1), in which the measurements were performed at y = w/2. It is worth mentioning that the fluctuations of the dye concentration were measured at different locations, from y = w/4 to y = w, in both outlets (not shown here for conciseness) and comparable power spectra were found. For both AR, the value of the power-law exponent α (in P ∝ f−α) is α = 3.5. According to the theoretical findings of Fouxon and Lebedev,23 power-law exponents α ≥ 3 are expected in the elastic turbulence regime.
In order to better investigate the onset of the elastic turbulence regime, we also performed measurements using another viscoelastic fluid (PAA190). The Elasticity number (El), which is defined as the ratio between elastic and inertial forces, El = Wi/Re0 = (2λEη0)/(ρw2), is 1.4 × 10⁶ and 2.1 × 10⁵ for fluids PAA300 and PAA190, respectively.
Using the PAA190 fluid, we also measured the time variation of the dye concentration at y = w in the outlet channel, except for the highest Wi, for which the measurements were performed at y = w/2.
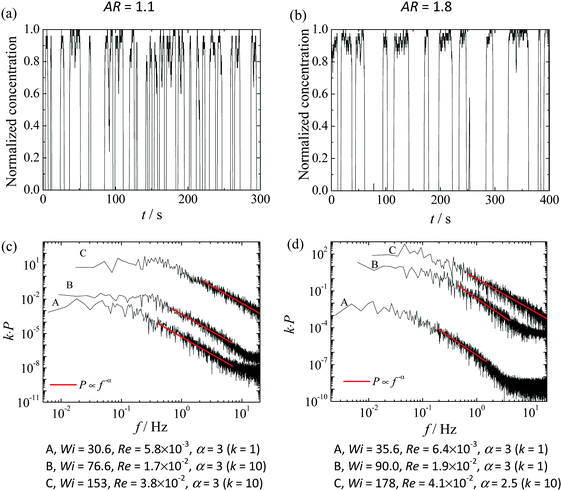
Representative data of normalized concentration over time are presented in Fig. 8a and b for AR = 1.1 and AR = 1.8, respectively, at similar Wi. The power spectra of the normalized dye intensity are presented in Fig. 8c and d, for different flow conditions and also for both AR.
For all flow conditions explored with Wi > 30, the fluctuations along time of the dye concentration are clearly visible but, in contrast to PAA300 fluid, the corresponding power spectra show the absence of distinctive frequency peaks but rather a broad region of frequencies, demonstrating that the fluctuations are aperiodic in time. For both AR, and again in contrast to PAA300 fluid, the data of fluid PAA190 revealed less intense power-law decay with exponents α ≤ 3. Despite the normalized dye concentration showing a complex behavior in time, the values of the power-law exponent are lower, or at most, close to those expected in the elastic turbulence regime (α > 3).
Velocity field
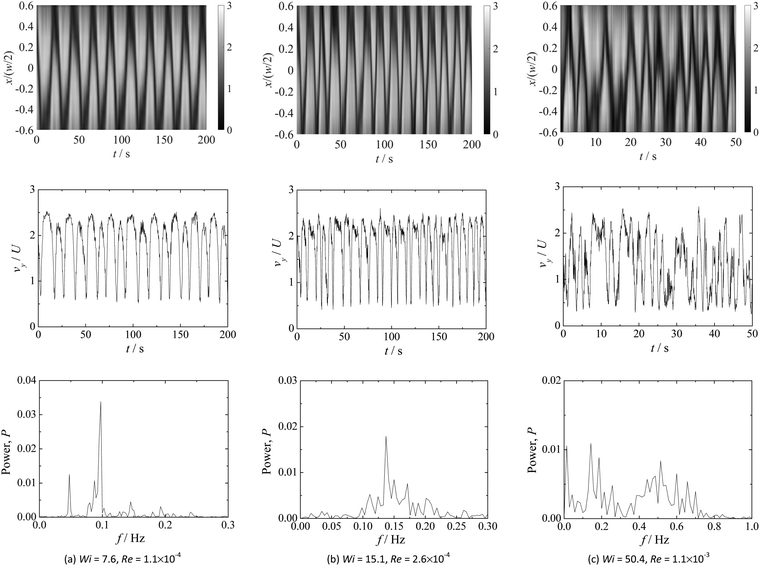
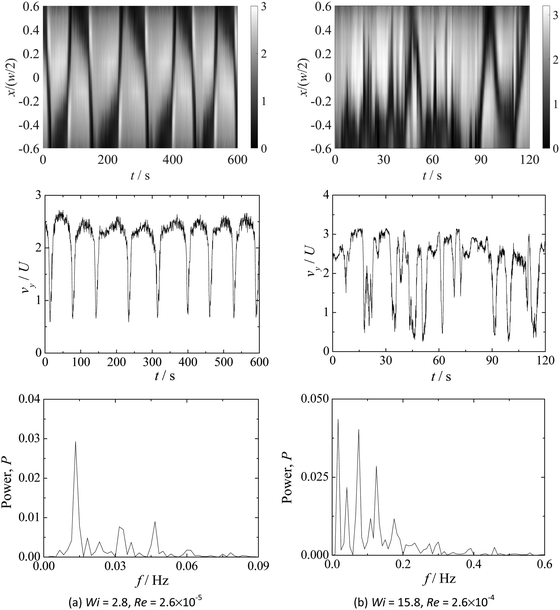
Fig. 9 and 10 present measurements of the time variation of the streamwise velocity component (vy) in the form of space-time diagrams (top row), velocity time-series (middle row) and corresponding power spectra (bottom row) for AR = 1.1 and 1.8, respectively. The space-time diagrams and the velocity time-series were both taken at y = w, with the latter measured at the centerline (x = 0). The experimental data are for the 32 × 32 pixels interrogation area centered at the measuring location and each point shown corresponds to the average of five consecutive image pairs, which we found to be a good compromise to maintain the same signal structure and reduce the signal high-frequency noise.Similar observations are found for the viscoelastic fluid flow in the two channels investigated. For low Wi, the velocity time series show periodic behavior, and the power spectra of the velocity fluctuations show the presence of marked peaks, namely a fundamental frequency and some harmonics, as illustrated in Fig. 9a for AR = 1.1 and in Fig. 10a for the deeper channel. Visual inspection of Fig. 9a and 10a easily confirms that the frequency of fluctuation of the velocity is higher for the lower aspect ratio of the channel.
When Wi is increased, the velocity fluctuations continue to display an oscillatory behavior in time, as shown in Fig. 9b for AR = 1.1. The corresponding power spectrum still shows a main frequency, but now the harmonic frequencies are less clear and broad distributions appear. Further increasing Wi leads to a more complex behavior, and the velocity time series are no longer periodic exhibiting a chaotic-like behavior. The power spectra of velocity fluctuations are more complex, showing a broad continuous region of frequencies instead of distinct peaks, as illustrated in Fig. 9c for AR = 1.1 (Wi = 50.4) and in Fig. 10b for AR = 1.8 (Wi = 15.8).
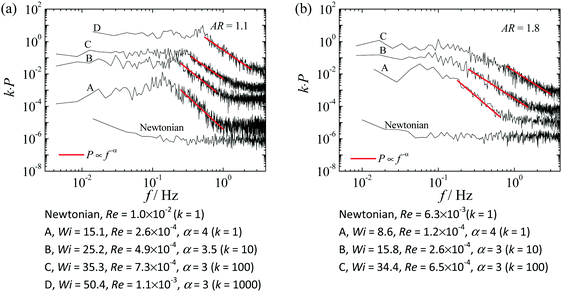
Fig. 11 compares the power spectra of the velocity time series obtained for the viscoelastic fluid flow in the cross-slot channel with AR = 1.1 (Fig. 11a) and AR = 1.8 (Fig. 11b) for increasing values of Wi. In addition, Fig. 11 also shows the power spectra for the corresponding Newtonian solvent (N90) at negligible inertial flow conditions.
The plotted power spectra are averages over at least five power spectra computed from time series of velocity measurements taken consecutively in the same experiment. The power spectra show similar features for both channel aspect ratios and confirm the findings for the flow patterns and dye concentration. For unsteady flow conditions, the power spectra decay follows a power law function (P ∝ f−α) and the frequency corresponding to the onset of power-law decay increases moderately with Wi. For both channel aspect ratios, the power-law exponent changes from α = 4 to α = 3, a range of values typical of the elastic turbulent regime.23 The decrease of the value of the power-law exponent depends on the channel aspect ratio, since α = 3.5 when Wi ≳ 25.2 for AR = 1.1 and α = 3 when Wi ≳ 15.8 for AR = 1.8. This decrease of α with Wi was also reported by Varshney et al.31 in their study of dilute polymeric solution flows in a T-junction geometry. Nevertheless, according to the theoretical findings of Fouxon and Lebedev,23 power-law exponents α ≥ 3 are expected in the elastic turbulence regime. A decrease in α at very high Wi is also observed in direct numerical simulation (DNS) of inertial turbulence with polymeric solutions, in which the power exponent decreases to the classical Newtonian (and low Wi) value (α = 5/3).32 This is associated to turbulent events becoming exceedingly faster in comparison to the ability of the polymers to react, with these simulations covering a very wide range of Wi.
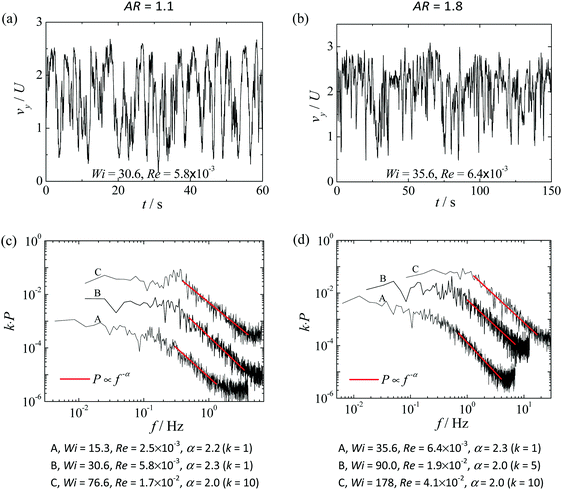
We also measured the velocity fluctuations for the flow of the PAA190 fluid in the cross-slot channel for both aspect ratios, and the results are shown in Fig. 12a and b for AR = 1.1 and AR = 1.8, respectively.
The corresponding power spectra of the velocity as a function of the frequency are presented in Fig. 12c and d.
Broadband velocity fluctuations are again clearly visible and no distinct characteristic frequencies are discernible in the power spectra at large values of Wi. The power spectra show a power-law decay with exponents of about 2.2, which are below those found for the flow of the more concentrated solution. Additionally, these values, which were measured from the velocity field, are now slightly lower than those obtained from the dye concentration measurements shown in the previous section, in contrast to data for the PAA300 fluid. In this case, it is possible to infer that the unsteady flow behavior observed with PAA190 solution is complex but is not necessarily in the elastic turbulence regime. It is important to emphasize that inertial effects remain negligible since Re < 0.04 for the entire flow conditions investigated with the PAA190 fluid.
Despite the flow unsteadiness occurring for both viscoelastic fluids above a critical Wi, it is interesting to note that both fluids reveal different behavior, with the characteristic features of elastic turbulence only being observed clearly for the more concentrated solution within the tested flow rates.
Conclusions
In this work, we investigated the unsteady flow of two viscoelastic fluids, in cross-slot microfluidic devices with two aspect ratios. The transition to the time-dependent flow occurs above a second higher critical Wi, possibly leading to the onset of the elastic turbulence regime at high Wi. For both channel aspect ratios, when the flow becomes time-dependent, first at low Wi, a periodic behavior is observed with a fundamental and harmonic frequencies that can be easily identified. Increasing Wi leads to a more complex flow field, with a broad spectrum of fluctuations. For the more concentrated fluid used, the onset of the time-dependent elastic instability leads to irregular flow patterns that act as a prelude to the beginning of the elastic turbulence regime associated with power spectra decay with frequency with power-law exponents exceeding α = 3. In spite of its chaotic-like behavior, the flow of the less concentrated viscoelastic fluid does not show clearly the elastic turbulence regime in the range of Wi investigated, since the power spectra decay with frequency have power-law exponents below α = 3.Conflicts of interest
There are no conflicts to declare.Acknowledgements
We would like to thank F. Pimenta for his help in the image analysis. P. C. Sousa thanks Fundação para a Ciência e a Tecnologia (FCT) the financial support through POPH/FSE and national funding from MEC (fellowship SFRH/BPD/75258/2010). M. A. Alves acknowledges funding from the European Research Council (ERC), under the European Commission “Ideas” specific programme of the 7th Framework Programme (Grant Agreement No. 307499). All authors acknowledge funding from Fundação para a Ciência e a Tecnologia through project UID/EMS/00532/2013.References
- S. J. Muller, R. G. Larson and E. S. G. Shaqfeh, Rheol. Acta, 1989, 28, 499–503 CrossRef CAS.
- A. Groisman and V. Steinberg, Phys. Fluids, 1998, 10, 2451–2463 CrossRef CAS.
- R. G. Larson, E. S. G. Shaqfeh and S. J. Muller, J. Fluid Mech., 1990, 218, 573–600 CrossRef CAS.
- A. Groisman and V. Steinberg, New J. Phys., 2004, 6, 1–48 CrossRef.
- L. E. Rodd, J. J. Cooper-White, D. V. Boger and G. H. McKinley, J. Non-Newtonian Fluid Mech., 2007, 143, 170–191 CrossRef CAS.
- J. Y. Tai, C. P. Lim and Y. C. Lam, Sci. Rep., 2015, 5, 16633 CrossRef CAS PubMed.
- J. Soulages, M. S. N. Oliveira, P. C. Sousa, M. A. Alves and G. H. McKinley, J. Non-Newtonian Fluid Mech., 2009, 163, 9–24 CrossRef CAS.
- L. Xi and M. D. Graham, J. Fluid Mech., 2009, 622, 145–165 CrossRef CAS.
- R. J. Poole, M. A. Alves and P. J. Oliveira, Phys. Rev. Lett., 2007, 99, 164503 CrossRef CAS PubMed.
- P. C. Sousa, F. T. Pinho, M. S. N. Oliveira and M. A. Alves, Soft Matter, 2015, 11, 8856–8862 RSC.
- J. A. Pathak and S. D. Hudson, Macromolecules, 2006, 39, 8782–8792 CrossRef CAS.
- N. Dubash, P. Cheung and A. Q. Shen, Soft Matter, 2012, 8, 5847–5856 RSC.
- P. Pakdel and G. H. McKinley, Phys. Rev. Lett., 1996, 77, 2459–2462 CrossRef CAS PubMed.
- G. H. McKinley, P. Pakdel and A. Öztekin, J. Non-Newtonian Fluid Mech., 1996, 67, 19–47 CrossRef CAS.
- J. Zilz, R. J. Poole, M. A. Alves, D. Bartolo, B. Levache and A. Lindner, J. Fluid Mech., 2012, 712, 203–218 CrossRef CAS.
- F. A. Cruz, R. J. Poole, A. M. Afonso, F. T. Pinho, P. J. Oliveira and M. A. Alves, J. Non-Newtonian Fluid Mech., 2016, 227, 65–79 CrossRef CAS.
- M. A. Alves, XVth International Congress on Rheology, AIP Conference Proceedings 1027, 2008, 240–242.
- S. J. Haward, M. S. N. Oliveira, M. A. Alves and G. H. McKinley, Phys. Rev. Lett., 2012, 109, 128301 CrossRef PubMed.
- S. J. Haward, G. H. McKinley and A. Q. Shen, Sci. Rep., 2016, 6, 33029 CrossRef PubMed.
- X. B. Li, F. C. Li, W. H. Cai, H. N. Zhang and J. C. Yang, Exp. Therm. Fluid Sci., 2012, 39, 1–16 CrossRef CAS.
- G. V. Vinogradov and V. N. Manin, Kolloid Z. Z. Polym., 1965, 201, 93–98 CAS.
- A. Groisman and V. Steinberg, Nature, 2000, 405, 53–55 CrossRef CAS PubMed.
- A. Fouxon and V. Lebedev, Phys. Fluids, 2003, 15, 2060–2072 CrossRef CAS.
- A. N. Morozov and W. van Saarloos, Phys. Rep., 2007, 447, 112–143 CrossRef CAS.
- A. Groisman and V. Steinberg, Nature, 2001, 410, 905–908 CrossRef CAS PubMed.
- T. Burghelea, E. Segre, I. Bar-Joseph, A. Groisman and V. Steinberg, Phys. Rev. E: Stat., Nonlinear, Soft Matter Phys., 2004, 69, 053104 CrossRef PubMed.
- Y. Xia and G. M. Whitesides, Annu. Rev. Mater. Sci., 1998, 28, 153–184 CrossRef CAS.
- C. D. Meinhart, S. T. Wereley and M. H. B. Gray, Meas. Sci. Technol., 2000, 11, 809–814 CrossRef CAS.
- P. E. Arratia, C. C. Thomas, J. Diorio and J. P. Gollub, Phys. Rev. Lett., 2006, 96, 144502 CrossRef CAS PubMed.
- S. J. Haward, R. J. Poole, M. A. Alves, P. J. Oliveira, N. Goldenfeld and A. Q. Shen, Phys. Rev. E, 2016, 93, 031101 CrossRef PubMed.
- A. Varshney, E. Afik, Y. Kaplan and V. Steinberg, Soft Matter, 2016, 12, 2186–2191 RSC.
- P. C. Valente, C. B. da Silva and F. T. Pinho, Phys. Fluids, 2016, 28, 075108 CrossRef.
| This journal is © The Royal Society of Chemistry 2018 |

