 Open Access Article
Coarsening dynamics of ferromagnetic granular networks—experimental results and simulations†
Armin
Kögel
 a,
Pedro A.
Sánchez
 b,
Robin
Maretzki
a,
Tom
Dumont
 a,
Elena S.
Pyanzina
 c,
Sofia S.
Kantorovich
 bc and
Reinhard
Richter
 *a
*a
aExperimentalphysik 5, University of Bayreuth, 95440 Bayreuth, Germany. E-mail: reinhard.richter@uni-bayreuth.de
bUniversity of Vienna, Sensengasse 8, Vienna, 1090, Austria
cUral Federal University, Lenin av. 51, Ekaterinburg, 620000, Russia
First published on 11th December 2017
Abstract
We investigate the phase separation of a shaken mixture of glass and magnetised steel spheres after a sudden quench of the shaker amplitude. After quenching, transient networks of steel spheres emerge in the experiment. For the developing network clusters we estimate the number of spheres in them, and the characteristic path lengths. We find that both quantities follow a log-normal distribution function. Moreover, we study the temporal evolution of the networks. In the sequence of snapshots we observe an initial regime, where the network incubates, followed by a temporal regime where network structures are elongated and broken, and finally a regime where the structures have relaxed to compact clusters of rounded shapes. This phaenomenology resembles the initial, elastic and hydrodynamic regimes observed by H. Tanaka [J. Phys.: Condens. Matter, 2000, 12, R207] during the viscoelastic phase separation for dynamically asymmetric mixtures of polymers. In order to discriminate the three regimes we investigate in the experiment order parameters like the mean number of neighbors and the efficiency of the networks. In order to capture the origin for a viscoelastic phase separation in our granular mixture, we use a simple simulation approach. Not aiming at a quantitative description of the experimental results, we rather use the simulations to define the key interactions in the experimental system. This way, we discover that along with dipolar and steric interactions, there is an effective central attraction between the magnetised spheres that is responsible for the coarsening dynamics. Our simulations show as well three regimes in the evolution of characteristic order parameters.
1 Introduction
“All men are caught in an inescapable network of mutuality.” (Martin Luther King Jr.)In the last decade, networks that are neither completely regular, nor completely random have attracted much interest.1 These networks are highly clustered like regular lattices, yet have small characteristic path lengths like random graphs. Examples comprise the connections in-between routers of the internet,1 citation networks2 or transportation networks in plant leaves,3 slime mould,4 or rail systems.5 These networks may evolve in time, but have no transient nature.
In contrast, transient networks emerge during the phase separation of dynamically asymmetric mixtures, like a solution of a polymer in a less viscous solvent.6 Here, the slow component is the polymer, the fast one is the solvent. For these kind of dynamically asymmetric mixtures a new type of viscoelastic phase separation has been proposed by Hajime Tanaka.7 This model complements the solid model and the fluid model of phase separation, which are both well known. In the viscoelastic model the phase separation starts with an initial regime – the incubation of a network – where an order parameter like the dominant wave number only slowly changes. This is followed by an elastic regime, where network like structures are elongated and eventually broken. This regime is characterized by a drastic change of the order parameter. In the final, hydrodynamic regime, “the network like structure relaxes to a structure with rounded shape and the domain shape starts to be dominated by the interface tension as in usual fluid–fluid phase separation”.7
Here, we make the supposition that a dispersion of magnetic particles in a magnetically neutral granular medium may also be regarded as a dynamically asymmetric mixture. In such a system, the magnetic interactions mediate the elastic forces.
Indeed, it is well known from ferrofluids, a colloidal dispersion of magnetic nanoparticles,8 that they form chains and aggregates. This is especially true for a dispersion of cobalt nanoparticles.9 The latter excel by their high magnetic dipole moment. In the nanometer scale, however, the formation of networks is difficult to investigate because the imaging relies on transmission electron microscopy. The latter requires frozen samples10 which impedes to observe the dynamics. In contrast, in the micrometer range, networks of ferromagnetic particles and their dynamics can be inspected by optical means. In this way, Wen et al.11 observed the aggregation dynamics in a suspension of magnetised, nickel-covered glass spheres (diameter d = 50 μm) and compared the observed structures with numerical simulations based on dipole–dipole-interactions without noise. In the same range, Snezko et al.12 investigated the structure formation of electromagnetically driven Ni-particles. They observed compact clusters, rings, chains and rudiments of networks. Stambaugh et al.13,14 experimented with spheres in the cm-range, with permanent magnets of different strength incorporated in them. They investigated pattern formation and segregation. Due to the small size of the experimental systems, however, networks were not reported.
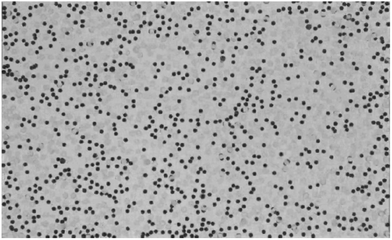
For our topic, the experiments by Blair and Kudrolli16 are path-breaking. The authors vibrated a mixture of permanently magnetised steel spheres and glass beads by means of a shaker. They established a phase diagram under variation of the acceleration amplitude and the filling fraction. It shows a hysteretic transition between a homogeneous gas phase and a phase, where single particles and agglomerates coexist. Quenching the system from the gas phase (cf. our snapshot in Fig. 1) into the mixed phase, the authors found loose networks like in Fig. 2a and compact networks, like in Fig. 2b.
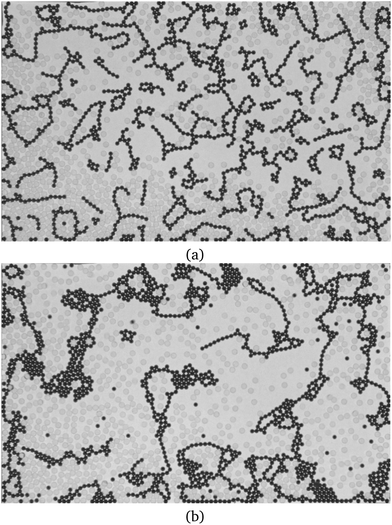 | ||
| Fig. 2 Examples for networks, as formed 5 seconds after the quench, for Γ = 1.8 g (a) and Γ = 1.9 g (b). After ref. 15. A movie of the network formation is provided as supplementary movie SM1 (ESI†). | ||
We revisit this rich system in order to tackle for the first time the question, whether network formation in a mixture of magnetised beads in a magnetically neutral phase can be captured by the model of viscoelastic phase separation. For our study we exploit the fact that the granular temperature can conveniently be quenched by switching the amplitude of the vibration exciter. This is a clear advantage comparing to ferrofluids, where lowering the temperature is slow and may also induce a freezing of the solvent.17
The article is organised as follows. In the next section (Section 2) we describe the basics of the experiment. Thereafter we present our experimental results (Section 3), which comprise a network analysis (Section 3.1), and the temporal evolution of characteristic measures derived therefrom (Section 3.2). Then we describe our simulation method (Section 4). After that we analyse the simulated structures (Section 5) and compare them with the experimental ones. In this way, we are able to understand the nature of the magnetic interaction and the part of the glass beads. Finally (Section 6), the summary of our investigation is provided and the missing aspects are outlined.
2 Experimental methods
In the following we describe the experimental setup (Section 2.1), the mechanical and magnetic properties of the spheres (Section 2.2), and sketch the image processing, utilised for the experiments (Section 2.3).2.1 Experimental setup
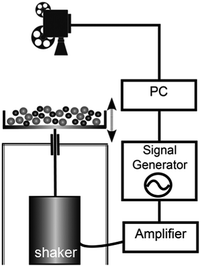
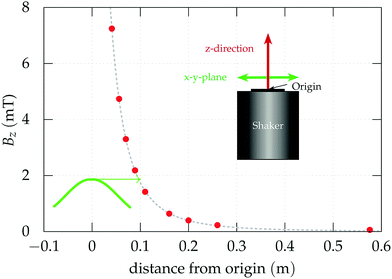
Our experimental setup is sketched in Fig. 3. An experimental vessel is driven by an electromagnetic shaker (Brüel & Kjær, type 4808) which is connected via an amplifier (Brüel & Kjær, type 2712) to a function generator (Agilent, type 33120A). The latter generates a voltage which is sinusoidally varying in time, the amplitude and frequency of which can be controlled via a bus (GPIB) by a personal computer.Unavoidably, the electromagnetic vibration exciter generates a magnetic stray field. Its vertical component Bz has been measured by means of a Hall probe (Lakeshore, type MNA-1904-VH) and a teslameter (Lake shore, type 450). The results are shown in Fig. 4. The solid green line marks the radial dependence Bz(r) at a height of z = 10 cm, which has a maximum in the centre. The red dots give Bz(z) at r = 0 cm. The values decay drastically with increasing z, like the field of a dipole (dashed line). In order to minimize the influence of the stray field onto the steel spheres, the vessel is fixed via a hollow brass rod (outer diameter 20 mm) and a bearing to the flange of the exciter. In this way, the bottom of the experimental vessel is situated 53.5 cm above the top of the exciter, where Bz < 61 μT. The latter is in the range of Bz of the earth in central europe (44 μT) and shall be neglected.
The vessel is filled with a mixture of steel spheres and glass beads. Their position is recorded by means of a charge-coupled-device camera (Lumenera Corporation, type LU135M) with 8-bit resolution, where each frame has 1392 × 1040 pixel. The spheres are illuminated from below, by an electroluminescent film (Zigan Displays) mounted beneath a glass plate, as sketched in Fig. 5. The dimensions (width × length × height) of the rectangular vessel are 200 × 285 × 12.85 mm3. The vessel has no lid. In order to achieve a light-weight but stiff vessel its bottom plate is made from aluminum honeycomb material (CEL Components S.R.L.). During the experiments we record the acceleration amplitude Γ with an acceleration sensor (Brüel & Kjaer, type 4509 B002), which is mounted beneath the vessel.
2.2 Properties of the spheres
Highly monodisperse steel spheres are available from industrial steel ball bearings. We ordered several types with a diameter of 3 mm and measured the magnetic dipole moment μ by means of a vibrating sample magnetometer (Lakeshore VSM 7404). Fig. 6a displays the resulting magnetisation M = μ/VS of the volume VS of the steel spheres for increasing and decreasing internal magnetic field| Hi = H − DM. | (1) |
| M(H) = ±MR + χ0Hi, | (2) |
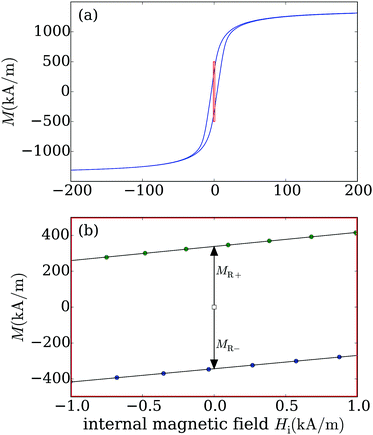 | ||
| Fig. 6 Magnetisation M vs. internal magnetic field Hi following eqn (1) of the selected steel spheres. The red rectangle in (a) marks the range of the zoom displayed in chart (b). Here the filled circles give the measured data, the solid lines present fits by eqn (2) for estimating the magnetic remanent magnetisation MR and the susceptibility χ0. | ||
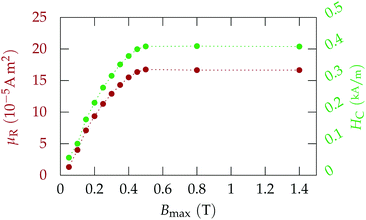 | ||
| Fig. 7 Remanent dipole moment μR (l.h.s.) and coercivity HCvs. applied magnetic induction for the selected steel spheres. | ||
| Material | Soda-lime glass | Steel 1.3505 |
|---|---|---|
| Manufacturer | Sigmund-Lindner.com | Isometall.de |
| Type | Type P | DIN5401G10 |
| Radius r (mm) | 2.0 ± 0.02 | 1.5 ± 0.02 |
| Volume V (mm3) | 33.51 | 14.14 |
| Density ρ (kg m−3) | 2580 | 7610 |
| Mass m (g) | 0.084 | 0.108 |
| Remanence MR (kA m−1) | — | 340 ± 3 |
| Susceptibility χ0 | — | 76 ± 2 |
| Coercivity HC (kA m−1) | — | 4.46 ± 0.3 |
| Dipole moment μR | ||
| (10−4 A m2) | — | 4.83 ± 0.02 |
The filling fraction of the glass spheres, ϕg, as well as the one of the magnetised spheres, ϕm, can be varied in the experiment. Following ref. 16 we define the filling fraction via
 | (3) |
2.3 Image processing
To the recorded frames first a trapezoidal correction is applied. For the analysis of the networks, the steel spheres have to be detected. This is achieved by binarising the pictures. The light intensity of pixels below a certain threshold becomes 0 and above 255. For a proper detection of all spheres the threshold needs to be increased in steps. These pictures are then processed with tools from the computer vision software OpenCV18 which yield the contour and coordinates of the spheres. Next, for a detection of the network, neighbouring spheres have to be recognised. Therefore, the distance between the centre of neighbouring spheres is compared to the diameter. In order not to loose too many real contacts the distance was allowed to vary by a factor of 1.13 from the diameter of 2·rsphere. The abstract structure of the network is reduced to a graph, as shown in Fig. 13, by means of the software package networkX19 based on the script language python.203 Experimental results
We start our experimental runs always by a large shaker amplitude of Γ = 3 g. Here, the collisions in-between the particles transmit high energy, which impedes any self-assembly and the system is in the gas phase. After quenching the amplitude of the vibration exciter, the magnetised steel spheres form first dimers, then chains and clusters as shown in the video which can be accessed here.21Two neighbouring magnetised steel spheres attach to each other if they are close enough and properly oriented. After forming a dimer, the mass of the new cluster has doubled compared to each particle, which lowers its mobility. Moreover, its magnetic moment has increased as well. Consecutively, further particles tend to be attracted to the ends of the dimer, creating a chain of three magnetised spheres, whereas a triangular configuration is hardly observed, because it is energetically less favourable. The trimers extend to longer chains. With their length increasing, it becomes more likely that some steel spheres are also connected to the side of a chain, forming various branched structures22,23 as shown in Fig. 8a. With increasing length, the chains bend more easily and collisions with glass spheres become more frequent. This can lead to the formation of rings, like displayed in Fig. 8b, or to the disruption of chains. The further evolution of the pattern is very sensitive to the value of the shaker amplitude. For lower amplitude, loose networks are favoured (cf.Fig. 2a), whereas for slightly higher amplitudes, compact networks and areas with dense hexagonal packing (“crystallites”) form earlier (see Fig. 2b).
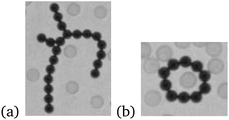 | ||
| Fig. 8 Clusters which emerge can reduce their magnetic energy by forming branched chains (a) and rings (b). | ||
In the following Section 3.1 we introduce and apply different network measures to the ferrogranular structures. These measures are then exploited in Section 3.2 to describe the temporal evolution of the transient networks.
3.1 Characterization of the network
We characterise the emerging networks by their number of neighbours (Section 3.1.1). Moreover we investigate the distribution of clusters in the network counting the number of spheres of a cluster (Section 3.1.2), and the distribution of the characteristic path lengths (Section 3.1.3).![[k with combining macron]](https://www.rsc.org/images/entities/i_char_006b_0304.gif) , as presented in Table 2.
, as presented in Table 2.
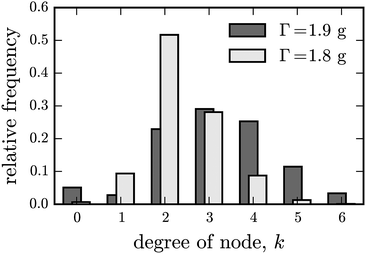 | ||
| Fig. 9 Relative occurrence of the number of neighbours (k) for Γ = 1.8 g (bright) and 1.9 g (dark) and ϕg = 0.15, ϕm = 0.15. | ||
| Acceleration Γ (g) |
![[k with combining macron]](https://www.rsc.org/images/entities/i_char_006b_0304.gif)
|
|---|---|
| 1.8 | 2.39 ± 0.06 |
| 1.9 | 3.15 ± 0.10 |
The border of the clusters, as marked by the red lines in Fig. 10, are automatically detected. The number of spheres within the lines yields the cluster size. Many individual spheres and a few large clusters are dominating the picture, where the size of the latter is limited by the finite size of the vessel. Fig. 11 presents the distribution of the cluster sizes for Γ = 1.8 g five seconds after the quench. The distribution resembles the log-normal distribution
 | (4) |
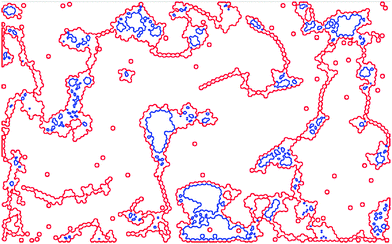 | ||
| Fig. 10 Detected clusters in the network depicted in Fig. 2b. Connected steel spheres are bordered by the red line. The inner voids, created by loops, are marked by the blue line. | ||
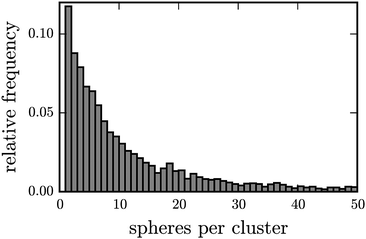 | ||
| Fig. 11 Distribution of cluster size for Γ = 1.8 g, and ϕg = 0.27, ϕm = 0.25, determined from 50 frames. | ||
For a careful comparison of experiment and eqn (4), we plot in Fig. 12 the cumulative distribution of the cluster size for two different accelerations. The solid lines display fits of the distribution function
 | (5) |
 | (6) |
 | (7) |
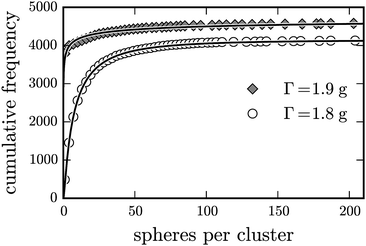 | ||
| Fig. 12 Distribution function fitted to the cumulative incidence of the cluster size for Γ = 1.8 g and 1.9 g, with ϕg = 0.27, ϕm = 0.25. | ||
In Fig. 12 the measured data for Γ = 1.8 g can well be fitted by eqn (5), whereas at Γ = 1.9 g deviations are prominent at small cluster size, which is reflected in Table 3.
| Acceleration Γ (g) | 1.8 | 1.9 |
|---|---|---|
| m real | 16.0 | 14.2 |
| m fit | 16.5 | 185 |
| s real | 27.0 | 70.6 |
| s fit | 37.5 | 550 |
 | (8) |
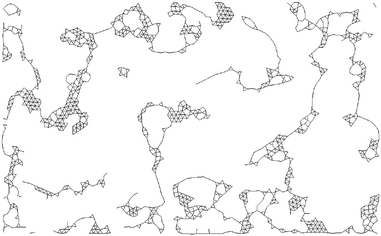 | ||
| Fig. 13 Reduced graph of Fig. 2b, where only the connecting lines in-between the steel spheres are shown. The supplementary movie SM2 (ESI†) is showing the evolution of the reduced network graph. | ||
In order to determine L of every cluster, we use the software package networkX19 for the script language python.20 Similar to the previous section, we investigate again the cumulative distribution of the cluster size, now measured in L. As shown in Fig. 14, the cumulative distributions for both acceleration amplitudes are well fitted by the integral of the log-normal-distribution eqn (5). Comparing the mean of the measured (real) and the fitted (fit) distributions in Table 4 shows only a tiny difference, which confirms the quality of the fit.
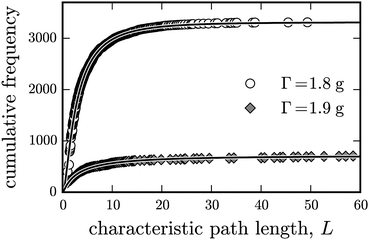 | ||
| Fig. 14 Cumulative incidence of clusters vs. the characteristic path length for Γ = 1.8 g and 1.9 g, with ϕg = 0.27, ϕm = 0.16. The solid lines mark fits by eqn (5). For fitting parameters see Table 4. | ||
| Acceleration Γ (g) | 1.8 | 1.9 |
|---|---|---|
| m real | 4.55 | 7.80 |
| m fit | 4.58 | 8.46 |
| s real | 5.25 | 12.1 |
| s fit | 6.39 | 23.1 |
So far we have characterized the emerging network by means of the number of neighbours k and by the characteristic path length L. We have focused on these quantities because they serve in the following to characterize the evolution of the network. However, its worth to note, that the distribution of clusters measured by means of the gyration radius shows as well a log-normal distribution. Moreover, also the distribution of the loop sizes is an interesting observable. An analysis of the latter observables will be given in a subsequent publication.
3.2 Evolution of the network
After introducing and testing various measures for networks in Section 3.1, we are now prepared to investigate the temporal evolution of the ferrogranular network. Especially we will focus on the temporal evolution of the mean number of neighbours (Section 3.2.1) and on the evolution of the efficiency (Section 3.2.2).![[k with combining macron]](https://www.rsc.org/images/entities/i_char_006b_0304.gif) is plotted in Fig. 15vs. the time for two different acceleration amplitudes. We start in the gas phase where
is plotted in Fig. 15vs. the time for two different acceleration amplitudes. We start in the gas phase where ![[k with combining macron]](https://www.rsc.org/images/entities/i_char_006b_0304.gif) = 0, and quench at t = 0 s. During the first five seconds after the quench
= 0, and quench at t = 0 s. During the first five seconds after the quench ![[k with combining macron]](https://www.rsc.org/images/entities/i_char_006b_0304.gif) increases rapidly. During this time the steel spheres form first dimers and trimers. During the further evolution
increases rapidly. During this time the steel spheres form first dimers and trimers. During the further evolution ![[k with combining macron]](https://www.rsc.org/images/entities/i_char_006b_0304.gif) grows more slowly.
grows more slowly.
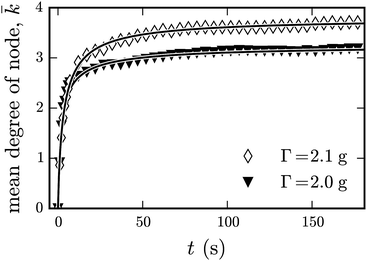 | ||
| Fig. 15 Temporal evolution of the average number of neighbours for two different accelerations Γ, and ϕg = 0.27, ϕm = 0.16. The solid lines indicate fits by eqn (9). | ||
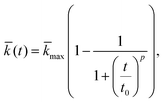
In a first attempt, we try to characterise the temporal evolution of ![[k with combining macron]](https://www.rsc.org/images/entities/i_char_006b_0304.gif) by the logistic function
by the logistic function
 | (9) |
![[k with combining macron]](https://www.rsc.org/images/entities/i_char_006b_0304.gif) max denotes the saturation value of the growth and t0 the time when
max denotes the saturation value of the growth and t0 the time when ![[k with combining macron]](https://www.rsc.org/images/entities/i_char_006b_0304.gif) equals to the half of the saturation value. With increasing t0 the network grows more slowly. The exponent p describes the curvature of the graph. For p ≫ 1 the logistic function increases in the beginning more slowly, but grows more rapidly around t0, where it approaches fast its saturation value.
equals to the half of the saturation value. With increasing t0 the network grows more slowly. The exponent p describes the curvature of the graph. For p ≫ 1 the logistic function increases in the beginning more slowly, but grows more rapidly around t0, where it approaches fast its saturation value.
The fit of ![[k with combining macron]](https://www.rsc.org/images/entities/i_char_006b_0304.gif) (t) agrees rather well with the experimental values, as displayed in Fig. 15. Table 5 presents the parameters derived from the fit. For higher Γ the saturation value
(t) agrees rather well with the experimental values, as displayed in Fig. 15. Table 5 presents the parameters derived from the fit. For higher Γ the saturation value ![[k with combining macron]](https://www.rsc.org/images/entities/i_char_006b_0304.gif) max increases. This is in agreement with our qualitative observations, which relate a higher Γ with more compact structures. Also t0 varies strongly with Γ. For Γ = 2.0 g half of the saturation value is reached at t0 = 1.9 s, whereas for Γ = 2.1 g this happens at t0 = 3.4 s, which is considerably later.
max increases. This is in agreement with our qualitative observations, which relate a higher Γ with more compact structures. Also t0 varies strongly with Γ. For Γ = 2.0 g half of the saturation value is reached at t0 = 1.9 s, whereas for Γ = 2.1 g this happens at t0 = 3.4 s, which is considerably later.
![[k with combining macron]](https://www.rsc.org/images/entities/i_char_006b_0304.gif) (t) yields the following parameters
(t) yields the following parameters
| Acceleration Γ (g) | 2.0 | 2.1 |
|---|---|---|
![[k with combining macron]](https://www.rsc.org/images/entities/i_char_006b_0304.gif) max
max
|
3.3 | 3.8 |
| t 0 (s) | 1.9 | 3.4 |
| p | 0.75 | 0.86 |
 | (10) |
The efficiency E is plotted in Fig. 16vs. time. For all investigated values of Γ, we observe a monotonous increase of E. In the first five seconds after the quench at t = 0 s E increases rapidly, which is followed by a more moderate evolution afterwards. Here, small steps in the evolution occur if two larger clusters are merging. This is an outcome of the finite size of the container and the limited statistics. In contrast to the evolution of the average number of neighbours, (see Fig. 15 above) the curves in Fig. 16 do not indicate a saturation. Therefore, a fit by the logistic function is not convincing. We note in Fig. 16 as well that higher values of E are related with a higher acceleration amplitude Γ.
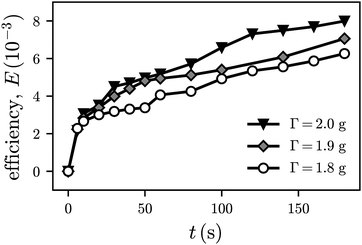 | ||
| Fig. 16 The efficiency E according to eqn (10)vs. time t for three different acceleration amplitudes Γ. For all Γ the filling fractions (3) are ϕg = 0.15, ϕm = 0.20. | ||
It is interesting to know how the filling fraction ϕ will influence E(t). In Fig. 17, we plot E(t) for four different values of ϕm. For each Γ we observe a monotonous increase of E, which is, similarly to that in Fig. 16, first steep and then moderate. For higher values of ϕm, one may expect larger clusters and larger path length L. Due to the limit of k = 6 this will result in a smaller efficiency. Indeed, at e.g. t = 50 s, a higher value of ϕm leads to a lower E for all filling fractions. However at t ≈ 120 s we observe a crossover of the curves for ϕm = 20% and 25%. This may be due to the limited statistics of our experimental arrangement.
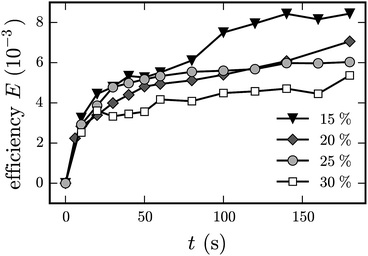 | ||
| Fig. 17 The efficiency E according to eqn (10)vs. time t for Γ = 1.9 g. The filling fraction for the glass beads was fixed to ϕg = 0.15, whereas the one for the magnetised beads was varied according to ϕm = 0.15, 0.20, 0.25, and 0.30. | ||
The graphs of ![[k with combining macron]](https://www.rsc.org/images/entities/i_char_006b_0304.gif) (t) (cf.Fig. 15) as well as E(t) (see Fig. 16 and 17) clearly display two distinct time scales. A short time scale ≈2t0 of a few seconds, where the network is emerging, and a long time scale ≈100·t0 where its structure is being transformed. These two time scales indicate an initial and an elastic regime, predicted in ref. 7 for viscoelastic phase separation. Moreover, the emergence of compact hexagonal arrangements of magnetised spheres can clearly be discriminated in the supplementary movies SM1 and SM2 (ESI†). However, they are not yet dominating the pattern, as it is predicted for the hydrodynamic regime.7 Consequently, it is difficult to unveil the transition in the evolution of the order parameters in the Fig. 15 and 16.
(t) (cf.Fig. 15) as well as E(t) (see Fig. 16 and 17) clearly display two distinct time scales. A short time scale ≈2t0 of a few seconds, where the network is emerging, and a long time scale ≈100·t0 where its structure is being transformed. These two time scales indicate an initial and an elastic regime, predicted in ref. 7 for viscoelastic phase separation. Moreover, the emergence of compact hexagonal arrangements of magnetised spheres can clearly be discriminated in the supplementary movies SM1 and SM2 (ESI†). However, they are not yet dominating the pattern, as it is predicted for the hydrodynamic regime.7 Consequently, it is difficult to unveil the transition in the evolution of the order parameters in the Fig. 15 and 16.
For times larger than 180 s we can detect an increase in E. However, we do not show this here, because we rely not fully on the statistics due to finite size effects, i.e. collisions of the clusters with the edge of the vessel. The latter are becoming increasingly important at long times, where the cluster size is in the range of the experimental vessel. Note that already 5 s after the quench networks can approximate the diameter of the vessel, as can be seen in Fig. 2b.
Due to mechanical limitations it is not straight forward to enlarge our experimental setup by an order of magnitude. Instead we re-examine the long term behaviour in a simple numerical model.
4 Theoretical modelling
In order to complement the experimental measurements, we also study the system by means of Langevin dynamics computer simulations with a minimal coarse-grained theoretical model. The reason to undertake a theoretical analysis is twofold. First, this approach may help to identify the main mechanisms leading to the network topologies observed in our experiments by allowing us to easily compare with the effects of different hypothetical interactions. Second, once a proper model of the system is obtained from such comparison, one can study the coarsening dynamics and network properties by overcoming the above mentioned experimental limitations.Before introducing our theoretical approach, it is important to underline that it does not aim at any quantitative characterisation of the system. Instead we focus strictly on establishing the basic ingredients that can reproduce qualitatively the main properties of the network evolution, particularly the ones corresponding to slow dynamics.
A simple starting point to define a minimal model of spheres that exhibit magnetic interactions is to consider that they carry a magnetic point dipole in their centres. Despite this description is only exact for homogeneous monodomain spheres, it has been used extensively as a useful approximation for the study of physical systems with very different characteristic sizes, ranging from magnetic nanoparticles to systems of macroscopic spherical magnets. The highly anisotropic nature of the dipole–dipole interaction leads to a strongly directional spontaneous self-assembly of the spheres, that tend to form linear chains with head-to-tail arrangements of their dipoles. This effect is well known in the study of ferrofluids and other systems of ferromagnetic nanoparticles.29–34 However, the networks of magnetised steel spheres observed in our experiments include a significant fraction of close packing crystallites, a structure that is very unfavourable for a system driven only by dipole–dipole self-assembly.
One can hypothesise that the dipolar approximation is still valid for the magnetic interactions in this system and that the close packing topology has its origin in the kinetic effect of the bath of non magnetic beads. Alternatively, one may claim that the size of the steel spheres and their experimental magnetisation curve described by eqn (2) suggest that they may actually have a multidomain nature, making the dipolar approximation too inaccurate. In this case, the magnetic dipole moment of each individual sphere would depend in part on the field created by its surrounding neighbours. The overall effect of this complex interplay would be to make the effective interaction between the steel spheres less anisotropic than the corresponding to pure dipolar spheres, allowing the formation of close packing crystallites. In order to ellucidate which is the correct hypothesis, we chose a computer model that allows us to easily separate such effects, while keeping a minimalistic approach. This model and the simulation method are described in the following sections.
4.1 Minimal model
In our simulations we represent both, the glass and the steel spheres, as soft core beads that interact isotropically by means of a truncated-shifted Lennard-Jones potential. This interaction, also known as Weeks–Chandler–Andersen (WCA) potential,35 is defined as: | (11) |
![[M with combining right harpoon above (vector)]](https://www.rsc.org/images/entities/i_char_004d_20d1.gif) R, as
R, as ![[small mu, Greek, vector]](https://www.rsc.org/images/entities/i_char_e0e9.gif) =
= ![[M with combining right harpoon above (vector)]](https://www.rsc.org/images/entities/i_char_004d_20d1.gif) RVS, in agreement with Table 1. As usual, this magnetic moment is represented by a fixed point dipole located at the sphere centres. This part of the interaction is therefore given by the conventional dipole–dipole potential:
RVS, in agreement with Table 1. As usual, this magnetic moment is represented by a fixed point dipole located at the sphere centres. This part of the interaction is therefore given by the conventional dipole–dipole potential: | (12) |
![[r with combining right harpoon above (vector)]](https://www.rsc.org/images/entities/i_char_0072_20d1.gif) ij =
ij = ![[r with combining right harpoon above (vector)]](https://www.rsc.org/images/entities/i_char_0072_20d1.gif) i −
i − ![[r with combining right harpoon above (vector)]](https://www.rsc.org/images/entities/i_char_0072_20d1.gif) j is the displacement vector between the dipoles of the beads i and j. Second, instead of a detailed modeling of the mutual magnetisation induced by close steel beads, we stick to a minimalistic phenomenological description of this effect by introducing a short-range isotropic attraction between them, defined by eqn (11) under attractive conditions. Finally, non magnetic beads are allowed to interact with any other particle only by a soft-core repulsion, also defined by eqn (11) but in this case under repulsive conditions.
j is the displacement vector between the dipoles of the beads i and j. Second, instead of a detailed modeling of the mutual magnetisation induced by close steel beads, we stick to a minimalistic phenomenological description of this effect by introducing a short-range isotropic attraction between them, defined by eqn (11) under attractive conditions. Finally, non magnetic beads are allowed to interact with any other particle only by a soft-core repulsion, also defined by eqn (11) but in this case under repulsive conditions.
Our strategy to clarify what is the actual drive of the coarsening dynamics observed in our experiments is to perform simulations for three different systems, corresponding to distinct qualitative combinations of the interactions defined above, and to compare the resulting networks to the experimental ones. Following an order of increasing complexity, first we simulated a monodisperse system of ideal soft core dipolar spheres (S1), i.e., a system of identical beads with characteristic diameter σm and magnetic moment ![[small mu, Greek, vector]](https://www.rsc.org/images/entities/i_char_e0e9.gif) . These beads interact via the dipole–dipole potential (12) and a purely repulsive WCA potential, obtained from eqn (11) by taking rcut = 21/6σ, σ = σm and ε = εr. For the second system (S2), we add to S1 a fraction of identical non magnetic beads, representing the glass spheres, with characteristic diameter σg. The repulsion between these non magnetic beads is calculated in the same way by using σ = σg, whereas for the repulsion between the magnetic and non magnetic beads we take σ = (σm + σg)/2. Finally, the last system (S3) is obtained by adding to the interactions defined for S2 the aforementioned isotropic attraction between the magnetic beads, also obtained from eqn (11) by taking rcut = 2.5σ, ε = εa and σ = σm.
. These beads interact via the dipole–dipole potential (12) and a purely repulsive WCA potential, obtained from eqn (11) by taking rcut = 21/6σ, σ = σm and ε = εr. For the second system (S2), we add to S1 a fraction of identical non magnetic beads, representing the glass spheres, with characteristic diameter σg. The repulsion between these non magnetic beads is calculated in the same way by using σ = σg, whereas for the repulsion between the magnetic and non magnetic beads we take σ = (σm + σg)/2. Finally, the last system (S3) is obtained by adding to the interactions defined for S2 the aforementioned isotropic attraction between the magnetic beads, also obtained from eqn (11) by taking rcut = 2.5σ, ε = εa and σ = σm.
4.2 Simulation approach
As pointed above, the simulation method we use is molecular dynamics with a Langevin thermostat. In this approach, a friction and a stochastic term that satisfy the usual fluctuation–dissipation relations are added to the Newtonian equations of motion in order to approximate statistically the effects of neglected degrees of freedom.36 In this case, such terms represent the effects of the mechanical shaking on the dynamics of the beads. In other words, in our simulations we treat the mechanical shaking as thermal fluctuations, so that the shaking amplitude is represented by the system temperature, T. It is important to underline that this representation is only qualitative and no formal relationship between these parameters has been established here. Instead, we determine the temperature corresponding to a given experimental shaking amplitude by sampling different values of T and choosing the one that better reproduces the coarsening dynamics of the experimental system. In detail, the translational and rotational Langevin equations of motion acting on each particle i in the system are, respectively,mi(d![[v with combining right harpoon above (vector)]](https://www.rsc.org/images/entities/i_char_0076_20d1.gif) i/dt) = i/dt) = ![[F with combining right harpoon above (vector)]](https://www.rsc.org/images/entities/i_char_0046_20d1.gif) i − ΓT i − ΓT![[v with combining right harpoon above (vector)]](https://www.rsc.org/images/entities/i_char_0076_20d1.gif) i + i + ![[small xi, Greek, vector]](https://www.rsc.org/images/entities/i_char_e1cd.gif) i,T i,T | (13) |
![[I with combining right harpoon above (vector)]](https://www.rsc.org/images/entities/i_char_0049_20d1.gif) i·(d i·(d![[small omega, Greek, vector]](https://www.rsc.org/images/entities/i_char_e13e.gif) i/dt) = i/dt) = ![[small tau, Greek, vector]](https://www.rsc.org/images/entities/i_char_e1ca.gif) i − ΓR i − ΓR![[small omega, Greek, macron]](https://www.rsc.org/images/entities/char_e0da.gif) i + i + ![[small xi, Greek, vector]](https://www.rsc.org/images/entities/i_char_e1cd.gif) i,R, i,R, | (14) |
![[F with combining right harpoon above (vector)]](https://www.rsc.org/images/entities/i_char_0046_20d1.gif) i and
i and ![[small tau, Greek, vector]](https://www.rsc.org/images/entities/i_char_e1ca.gif) i the total force and torque, mi the particle mass and
i the total force and torque, mi the particle mass and ![[I with combining right harpoon above (vector)]](https://www.rsc.org/images/entities/i_char_0049_20d1.gif) i its inertia tensor. Finally, ΓT and ΓR are the translational and rotational friction constants, and
i its inertia tensor. Finally, ΓT and ΓR are the translational and rotational friction constants, and ![[small xi, Greek, vector]](https://www.rsc.org/images/entities/i_char_e1cd.gif) i,T and
i,T and ![[small xi, Greek, vector]](https://www.rsc.org/images/entities/i_char_e1cd.gif) i,R the Gaussian random force and torque.
i,R the Gaussian random force and torque.
As it is frequently done in coarse-grained simulations, we take an arbitrary system of reduced units for all physical parameters, with the only constraint of keeping the relative scales of the relevant quantities as close as possible to the experimental ones. Mass units are defined by the mass of the steel and glass beads, mm and mg respectively. These were chosen to be equal, so that we take mm = mg = 1. Lengths are measured in terms of the respective diameters of the beads. Keeping the experimental ratio, we take σm = 3 and σg = 4. Energies are measured in the scale of the soft-core repulsive interactions, so that we chose εr = 10. Finally, in general one can define formally the reduced time scale in the system in terms of the units of mass, length and energy. However, here one has to take into account that the temperature plays a role that is only defined qualitatively by comparison with the experimental results. This makes it more accurate to also determine the time scale of the simulations by fitting the coarsening dynamics of the simulated systems to the experimental measurements. It has also the additional advantage of letting the choice of the rest of dynamic parameters to be arbitrary. Therefore, we can choose the reduced values of the friction constants to be ΓT = 1 and ΓR = 3/4, which are values known for providing a fast relaxation in this type of simulations.37,38 Finally, in order to ensure isotropic rotations, we set the inertia tensors, ![[I with combining right harpoon above (vector)]](https://www.rsc.org/images/entities/i_char_0049_20d1.gif) i, as the identity matrix.
i, as the identity matrix.
In order to mimic the experimental setup as close as possible without suffering its finite size effects we simulate a pseudo-infinite two-dimensional system by fixing the z coordinate of all particles to zero and using lateral periodic boundaries for the x–y plane. Under these conditions, the calculation of the long-range dipole–dipole interactions requires an efficient approximate method. For this we used the dipolar-P3M algorithm,39 combined with the dipolar Layer Correction method40 in order to take into account the slab geometry of our system. The simulations were carried out with the package ESPResSo 3.2.0.41,42
4.3 Simulation protocol
Our simulation protocol includes two main steps. First, we place the beads inside the simulation box randomly and equilibrate the system at a temperature, T1, that is high enough to keep a gas like state. Second, we quench the system by decreasing abruptly the temperature to its final value, T2, and measure the particle configurations as the system relaxes. In particular, we look at the time evolution of the average number of neighbours (i.e. the mean degree of a node of the network). The goal of this protocol is to find the combination of interaction parameters and the time scales that brings the system closer to the experimental configurations. That is, we search for the right set of interactions for our system, using the simulation time as a fitting parameter.For the sake of simplicity, in simulations we focus on a single set of experimental parameters to fit the model and analyse the coarsening dynamics. Specifically, in all the simulations the area fraction of the magnetic beads is ϕm ≈ 0.18, whereas in systems S2 and S3 the area fraction of non magnetic beads is ϕg ≈ 0.15, so that ϕm + ϕg ≈ 0.33. These values were obtained by placing 1466 magnetic and, for S2 and S3, additionally 687 non magnetic beads in a square simulation box with side length L = 240. In all cases the temperature during the first simulation step was taken to be T1 = 2. Finally, in order to fit the simulation model to the experimental results, we explore diverse values of the quenching temperature, T2 = {0.3,0.5,0.75}, energy scale of the isotropic attraction in S3, εa = {0.3,0.5,1}, and dipole moment of the magnetic beads, μ = |![[small mu, Greek, vector]](https://www.rsc.org/images/entities/i_char_e0e9.gif) |. The values of μ were chosen to provide reasonable values of the so-called dipolar coupling parameter, λ, at the sampled values of T1 and T2. This parameter, frequently used to characterise the self-assembly behaviour in systems of magnetic dipolar particles, is defined as the ratio between the minimum dipole–dipole energy of a pair of particles and the thermal energy of the system. Here, we can express it as:
|. The values of μ were chosen to provide reasonable values of the so-called dipolar coupling parameter, λ, at the sampled values of T1 and T2. This parameter, frequently used to characterise the self-assembly behaviour in systems of magnetic dipolar particles, is defined as the ratio between the minimum dipole–dipole energy of a pair of particles and the thermal energy of the system. Here, we can express it as:
 | (15) |
According to this definition, the sampled values of μ correspond to the intervals λ ∈ [0.5,1.75] for T1 and λ ∈ [2,7] for T2. However, in the following we will focus the discussion of the results only on the most interesting values of these parameters. As a last comment on the details of the simulation protocol, at least 16 independent simulation runs were performed for every set of parameters to obtain reasonably good statistics. These simulation runs consisted of 3 × 10⁵ integration steps at T1, with a simulation time step δτ1 = 0.0005, and the same amount of integration steps at T2, with a simulation time step δτ2 = 0.01.
In order to perform a quantitative characterisation of the simulated networks, we first have to identify the clusters of connected magnetic particles. For this we use a simple distance criterium: two magnetic particles are connected if their centre-to-centre distance is less than 1.3σm. Note that this threshold corresponds to applying the same factor used for identifying the experimental networks, 1.13, to the distance at which the soft core steric repulsion used in the simulations vanishes, rcut = 21/6σm. Once the networks are identified, their parameters are calculated in exactly the same way as we did for the experimental data.
5 Simulation results
We start the discussion on the simulation results by examining the configuration snapshots obtained for every system. In Fig. 18 we present a selection of these snapshots to illustrate the evolution of the networks after quenching the system to T2 = 0.5. No configurations from the system formed by only magnetic particles, S1, have been included in this figure because they match, as it was expected, the well known self-assembled structures observed in several existing works on dipolar hard spheres (see, e.g., snapshots in ref. 38). Importantly, even a simple visual comparison of the networks obtained in the simulations for S1 in front of the experimental ones evidences that they are rather different. Therefore, in Fig. 18 we only show representative configurations corresponding to systems S2 and S3. In particular, we show examples obtained for λ = 5 at three different simulation times and, in the case of S3, for three sampled values of the central attraction.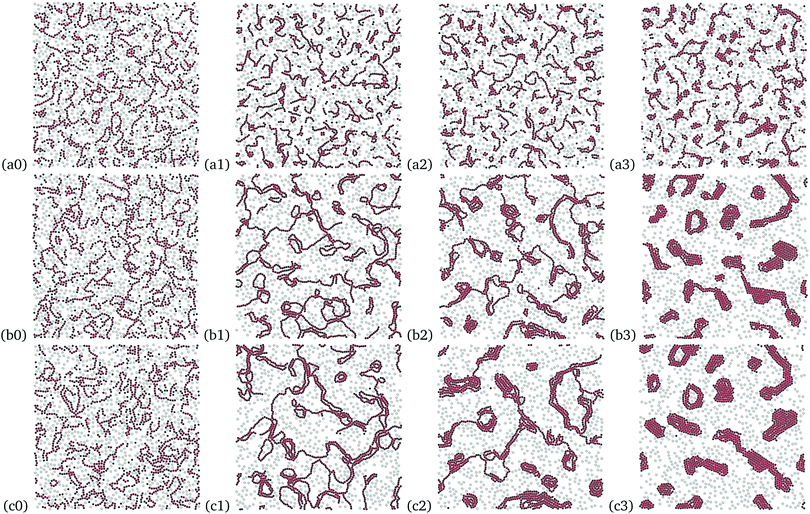 | ||
| Fig. 18 Snapshots of the simulations of mixtures of magnetic and non magnetic particles obtained for λ = 5 and T2 = 0.5, at different integration steps nδτ, after quenching: nδτ = 2500 (a0–a3), nδτ = 105 (b0–b3) and nδτ = 2.5 × 10⁵ (c0–c3). The column (a0, b0, c0) corresponds to the system without central attraction, S2 (εa = 0), and the rest to different strengths of the central attraction, S3: εa = 0.3 (a1, b1, c1), εa = 0.5 (a2, b2, c2), and εa = 1.0 (a3, b3, c3). Magnetic particles are plotted in black, non magnetic in light grey. Neighbouring contacts between particles forming clusters are marked in orange (see the main text for the criterium to identify neighbouring particles). Supplementary movies (ESI†) are provided for S2 (SM3) as well as for S3, εa = 0.5 (SM4) and S3, εa = 1.0 (SM5). | ||
For systems S2, as shown in the examples of column (a0, b0, c0), one can observe that the magnetic beads form structures composed by short linear chains, rings and branched chains. These structures evolve with time, albeit without obvious qualitative changes: Only the size of clusters grows slightly and some of them merge to form side-by-side arrangements. Still the general structure is much more loose than the one observed in the experiments.
In contrast, introducing a central attraction makes a strong impact on the overall structure: even for a weak central attraction—εa = 0.3, shown in column (a1, b1, c1)—one sees larger clusters with bundles of chains and/or rings that deplete/enclose the non magnetic particles. The growth of these clusters with time is also clearly stronger. This trend becomes even more pronounced as the central attraction grows, as is shown in the columns (a2, b2, c2) for εa = 0.5 and (a3, b3, c3) for εa = 1. For the latter case, we can see how the system separates very early into magnetic and non magnetic particles, with the magnetic ones forming compact clusters of nearly hexatic packing. This observation already suggests that the central attraction may be an essential ingredient to capture the dynamics of network formation in experiments. A more rigorous comparison between simulation and experimental results is presented in the next section.
5.1 Model fitting
In order to determine what is the set of interactions that better represents the experimental behaviour, we focus on the short time dynamics of the most simple and robust network parameter discussed here: the mean degree of the network nodes,![[k with combining macron]](https://www.rsc.org/images/entities/i_char_006b_0304.gif) , that is equivalent to the mean number of close contact neighbours of each magnetic bead. We assume this parameter to be weakly sensitive, at least at short times, to biases introduced by experimental limitations, like finite size effects or slight unlevellings of the experimental vessel.
, that is equivalent to the mean number of close contact neighbours of each magnetic bead. We assume this parameter to be weakly sensitive, at least at short times, to biases introduced by experimental limitations, like finite size effects or slight unlevellings of the experimental vessel.
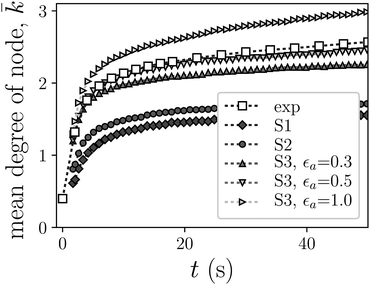
Fig. 19 shows the best fit to the experimental data (marked by □) of the values of ![[k with combining macron]](https://www.rsc.org/images/entities/i_char_006b_0304.gif) obtained from simulations of five systems with different interactions. These are systems S1, S2 and S3 with three different strengths of central attraction, εa = {0.3,0.5,1.0}. In all cases, time t = 0 corresponds to the moment at which the quenching takes place. The fit consisted of a rescaling of the simulation time to match the experimental evolution profile obtained during the first 20 seconds after quenching. Specifically, we obtained the relationship t = 0.438τ, where t is the physical time and τ is the simulation time. This time rescaling will be applied to all remaining simulation results.
obtained from simulations of five systems with different interactions. These are systems S1, S2 and S3 with three different strengths of central attraction, εa = {0.3,0.5,1.0}. In all cases, time t = 0 corresponds to the moment at which the quenching takes place. The fit consisted of a rescaling of the simulation time to match the experimental evolution profile obtained during the first 20 seconds after quenching. Specifically, we obtained the relationship t = 0.438τ, where t is the physical time and τ is the simulation time. This time rescaling will be applied to all remaining simulation results.
The comparison of all the simulation curves with the experimental data clearly indicates that systems S3 are much closer to the experiment than S1 and S2, which underestimate ![[k with combining macron]](https://www.rsc.org/images/entities/i_char_006b_0304.gif) significantly. Among the S3 systems, the one with εa = 0.5 shows an excellent agreement with the experimental results within the range used for the fitting, whereas lower and higher strengths of this interaction tend to underestimate and overestimate
significantly. Among the S3 systems, the one with εa = 0.5 shows an excellent agreement with the experimental results within the range used for the fitting, whereas lower and higher strengths of this interaction tend to underestimate and overestimate ![[k with combining macron]](https://www.rsc.org/images/entities/i_char_006b_0304.gif) , respectively. One can also see that, even for the best set of model interactions, systematic deviations from the experimental values tend to increase with time. This can be explained by the growing impact of finite size effects on the experimental measurements. Therefore, we conclude that the presence of the central attraction is an essential requirement to capture the experimental dynamics in our minimalistic modelling approach and, in particular, that the intermediate value εa = 0.5 provides the best approximation to the experimental results obtained for shaking amplitude Γ = 1.8 g. For simplicity, from now on we will refer to the model system S3 with εa = 0.5, λ = 5 and T2 = 0.5 as S3*.
, respectively. One can also see that, even for the best set of model interactions, systematic deviations from the experimental values tend to increase with time. This can be explained by the growing impact of finite size effects on the experimental measurements. Therefore, we conclude that the presence of the central attraction is an essential requirement to capture the experimental dynamics in our minimalistic modelling approach and, in particular, that the intermediate value εa = 0.5 provides the best approximation to the experimental results obtained for shaking amplitude Γ = 1.8 g. For simplicity, from now on we will refer to the model system S3 with εa = 0.5, λ = 5 and T2 = 0.5 as S3*.
Once we determined the best model for the experimental system of reference, we can examine in simulations the long time properties of the networks of magnetic beads under ideal measurement conditions. In the next sections we present the simulation results for the average number of neighbours and the network efficiency.
5.2 Number of neighbours
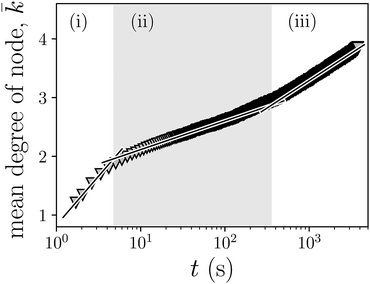
Fig. 20 shows the simulation results of the long time dynamics of the mean number of close contact neighbours,![[k with combining macron]](https://www.rsc.org/images/entities/i_char_006b_0304.gif) , obtained in the networks of magnetic beads for λ = 5 and T2 = 0.5 with system model S3*. For the sampled time interval, that spans from 0 to 3800 s after quenching, one can clearly observe the existence of three different dynamic regimes. At short times after quenching—up to t ≲ 5 s—there is a pronounced growth of
, obtained in the networks of magnetic beads for λ = 5 and T2 = 0.5 with system model S3*. For the sampled time interval, that spans from 0 to 3800 s after quenching, one can clearly observe the existence of three different dynamic regimes. At short times after quenching—up to t ≲ 5 s—there is a pronounced growth of ![[k with combining macron]](https://www.rsc.org/images/entities/i_char_006b_0304.gif) corresponding to the initial aggregation of the magnetic beads into clusters, leaving behind the gas phase. Once the mean degree reaches a value of
corresponding to the initial aggregation of the magnetic beads into clusters, leaving behind the gas phase. Once the mean degree reaches a value of ![[k with combining macron]](https://www.rsc.org/images/entities/i_char_006b_0304.gif) ∼ 2, indicating that most of the beads have become aggregated into chain-like clusters, the growth of this parameter slows down. This second regime spans the time interval 5 s ≲ t ≲ 360 s. Finally, once the mean degree reaches the value
∼ 2, indicating that most of the beads have become aggregated into chain-like clusters, the growth of this parameter slows down. This second regime spans the time interval 5 s ≲ t ≲ 360 s. Finally, once the mean degree reaches the value ![[k with combining macron]](https://www.rsc.org/images/entities/i_char_006b_0304.gif) ∼ 3, its growth rate increases again moderately, without reaching saturation up to the maximum sampled time.
∼ 3, its growth rate increases again moderately, without reaching saturation up to the maximum sampled time.
The existence of three dynamic regimes, as evidenced by the behaviour of the parameter ![[k with combining macron]](https://www.rsc.org/images/entities/i_char_006b_0304.gif) , suggests that the system may indeed display a viscoelastic phase separation, so that such regimes may correspond to the ones proposed by Tanaka:7,43 initial, elastic and hydrodynamic, respectively. However, their accurate interpretation requires subtle considerations. As pointed out above, regime (i) corresponds to the aggregation of isolated particles into clusters whose structure is dominated by the dipolar term of the pair interaction. This leads to networks with mainly chain-like topologies. The transition from regime (i) to regime (ii) signals the point where the fraction of particles with more than two neighbours, favoured by the central part of the pair interaction, starts to be significant. This suggests that the main phenomena in region (ii) may correspond to changes in the topology of the networks, that evolves from chain-like to hexatic crystallites. Finally, the interpretation of the transition between regimes (ii) and (iii) is hard to establish without further elements of analysis. These are provided in the next section, where results for the network efficiency and the mean cluster size are discussed.
, suggests that the system may indeed display a viscoelastic phase separation, so that such regimes may correspond to the ones proposed by Tanaka:7,43 initial, elastic and hydrodynamic, respectively. However, their accurate interpretation requires subtle considerations. As pointed out above, regime (i) corresponds to the aggregation of isolated particles into clusters whose structure is dominated by the dipolar term of the pair interaction. This leads to networks with mainly chain-like topologies. The transition from regime (i) to regime (ii) signals the point where the fraction of particles with more than two neighbours, favoured by the central part of the pair interaction, starts to be significant. This suggests that the main phenomena in region (ii) may correspond to changes in the topology of the networks, that evolves from chain-like to hexatic crystallites. Finally, the interpretation of the transition between regimes (ii) and (iii) is hard to establish without further elements of analysis. These are provided in the next section, where results for the network efficiency and the mean cluster size are discussed.
5.3 Network efficiency and cluster size
The long time evolution of the network efficiency, E(10), obtained in simulations with model system S3*, is shown in Fig. 21(a). Here, one can also identify three different dynamic regimes, but their limits are clearly shifted towards later times in comparison to what was observed for the evolution of the number of neighbours. This means that the dynamics of E is significantly slower than the one of![[k with combining macron]](https://www.rsc.org/images/entities/i_char_006b_0304.gif) . Also important is the fact that the evolution profile is qualitatively different: the slowest growth of E is happening in the first region, (i), whereas the fastest corresponds to regime (ii). Therefore, it is evident that
. Also important is the fact that the evolution profile is qualitatively different: the slowest growth of E is happening in the first region, (i), whereas the fastest corresponds to regime (ii). Therefore, it is evident that ![[k with combining macron]](https://www.rsc.org/images/entities/i_char_006b_0304.gif) and E are order parameters that characterise phenomena with clearly different time scales.
and E are order parameters that characterise phenomena with clearly different time scales.
A complementary picture of the different dynamic phenomena present in the system can be obtained by computing a third parameter: the mean relative cluster size, ![[C with combining macron]](https://www.rsc.org/images/entities/i_char_0043_0304.gif) . This is simply the average number of magnetic beads per cluster divided by the total number of magnetic beads in the system. Fig. 21(b) shows the simulation results for this parameter, together with the two sets of regime limits determined for
. This is simply the average number of magnetic beads per cluster divided by the total number of magnetic beads in the system. Fig. 21(b) shows the simulation results for this parameter, together with the two sets of regime limits determined for ![[k with combining macron]](https://www.rsc.org/images/entities/i_char_006b_0304.gif) (indicated by the borders of the grey area) and E (marked by dashed lines). We can see that initially there is a very slow growth of
(indicated by the borders of the grey area) and E (marked by dashed lines). We can see that initially there is a very slow growth of ![[C with combining macron]](https://www.rsc.org/images/entities/i_char_0043_0304.gif) , that remains up to an intermediate point between the beginning of regime (ii) of the network efficiency and the end of regime (ii) for the number of neighbours. After such point, the growth rate of
, that remains up to an intermediate point between the beginning of regime (ii) of the network efficiency and the end of regime (ii) for the number of neighbours. After such point, the growth rate of ![[C with combining macron]](https://www.rsc.org/images/entities/i_char_0043_0304.gif) becomes much larger. This fast growth is a clear signature of the merging of separate clusters into larger ones.
becomes much larger. This fast growth is a clear signature of the merging of separate clusters into larger ones.
Finally, the comparison of the results shown in Fig. 20 and 21 allows us to complete the sequence of main dynamic phenomena governing the evolution of the networks. After the initial interval in which a fast aggregation of the magnetic beads into clusters with a mainly chain-like structure takes place, driven by the long range dipolar interactions and corresponding to regime (i) of the evolution of the mean degree, the formed clusters experience a compaction by slowly replacing their chain-like morphologies by hexatic crystallites allowed by the short range central attraction. This compaction is favoured by the collisions of the non magnetic beads on the clusters. We identify this regime with the elastic phase of Tanaka's viscoelastic transition. Finally, the slowest phenomenon is the merging of separate clusters into larger ones, which becomes the dominant effect near the end of the regime (ii) of ![[k with combining macron]](https://www.rsc.org/images/entities/i_char_006b_0304.gif) and manifests itself in the fast growth of both,
and manifests itself in the fast growth of both, ![[k with combining macron]](https://www.rsc.org/images/entities/i_char_006b_0304.gif) and E. We consider this to correspond to the hydrodynamic regime of Tanaka's transition. The fact that the merging of the clusters, producing the final phase separation of magnetic and non magnetic beads, happens mainly at very long times is the consequence of the slow mobility of the clusters compared to individual particles: recently, it has been shown that such mobility tends to decrease with the cluster size.44 As a final observation, the slight slowing down of the growth of E corresponding to its regime (iii) can be explained as the onset of a saturation of the impact of the merging process in this parameter: whenever two separate clusters merge, all the pairs of beads belonging to each one of the original clusters start to contribute to increase E. However, according to the definition (10), when the merged clusters are large most of the newly networked pairs have a little contribution to this growth because their shortest path lengths are anyway very large. In other words, statistically, the merging of many small clusters into medium sized ones has a stronger impact on E than the merging of few large clusters into very large ones.
and E. We consider this to correspond to the hydrodynamic regime of Tanaka's transition. The fact that the merging of the clusters, producing the final phase separation of magnetic and non magnetic beads, happens mainly at very long times is the consequence of the slow mobility of the clusters compared to individual particles: recently, it has been shown that such mobility tends to decrease with the cluster size.44 As a final observation, the slight slowing down of the growth of E corresponding to its regime (iii) can be explained as the onset of a saturation of the impact of the merging process in this parameter: whenever two separate clusters merge, all the pairs of beads belonging to each one of the original clusters start to contribute to increase E. However, according to the definition (10), when the merged clusters are large most of the newly networked pairs have a little contribution to this growth because their shortest path lengths are anyway very large. In other words, statistically, the merging of many small clusters into medium sized ones has a stronger impact on E than the merging of few large clusters into very large ones.
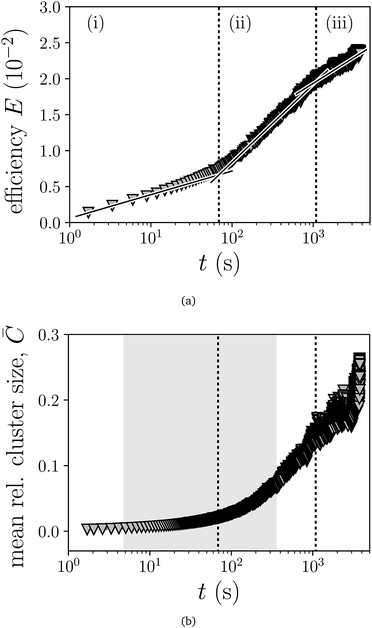 | ||
Fig. 21 Long time evolution of the network efficiency, E, obtained for simulations with model system S3* (symbols), and semilogarithmic fits to the three regimes observed, labelled as (i) to (iii) (solid lines). Dotted vertical lines indicate the limits between regimes. The slopes of the fits are: 0.14 (i), 0.47 (ii) and 0.31 (iii). (b) Long time behaviour of the mean relative cluster size, ![[C with combining macron]](https://www.rsc.org/images/entities/i_char_0043_0304.gif) , for the same system. To ease the comparison with Fig. 20 and 21(a), the regime limits shown in such figures are also indicated here by the dark background and the vertical dotted lines. , for the same system. To ease the comparison with Fig. 20 and 21(a), the regime limits shown in such figures are also indicated here by the dark background and the vertical dotted lines. | ||
6 Summary and outlook
When comparing the pictures of the networks in experiment (Fig. 1 and 2) to those in the simulations with central attraction (Fig. 18, columns at r.h.s.), we observe in both cases a transition from a gas like state to a branched network of chains of particles. With time, more and more hexagonal arrangements of spheres (“crystallites”) emerge in the network, whereas the connecting chains fade away. This transition is more pronounced in the simulations with strong central attraction (Fig. 18, column 3), than in those with weaker attraction (Fig. 18, column 2) or in the experiment. In the latter case the transition may be arrested in part by glass beads trapped in the loops. Moreover, finite size effects, induced by the container edges become increasingly important for long experimental runs.Still it is safe to conclude that experiment as well as simulations show an initial regime (i), where short chains of dipoles are emerging, which is followed up by a time span exhibiting the formation of a complex and contracting network of chains, and finally (iii) a regime characterised by compact clusters of magnetised spheres with rounded shape, which slowly evolve. We relate these states with the initial (i), elastic (ii) and hydrodynamic (iii) regimes, first observed by Tanaka7 during the phase separation of dynamically asymmetric mixtures of polymers. In our granulate, the magnetised beads represent the slow component, whereas the glass beads act as the fast one.
The transient networks could be characterised in the experiment by the distribution of cluster size, as measured in number of spheres, and the mean average path length. Interestingly, at short and moderate time-scales, these distributions can well be fitted by log-normal functions.
In search for a suitable order parameter of the viscoelastic phase separation, we studied the mean degree of a node, the efficiency of the network and the average cluster size. In experiment and simulation the short time evolution of the degree is well described by a logistic function, that is characteristic for limited growth processes. In the simulations, we can access also long-time behaviour of the mean node degree, that clearly shows three distinct regimes, thus, making this observable a good candidate to serve as an order parameter for our system. Moreover, the growth of the efficiency and the cluster size exhibits different time-scales, being the former significantly larger than the corresponding to the degree. Here, the statistics needs to be improved in follow up experiments and simulations in order to better discriminate the elastic and the hydrodynamic regimes.
The comparison between the experiment and the model unveils that besides magnetic dipoles, an effective central attraction is essential for the transient nature of the network. This central attraction is a consequence of the magnetisation curve of the steel spheres. Each sphere represents a dipole with susceptibility, that we can name in short: a DipSus. In reality, the attraction in the experiment is the result of the Kelvin force, and is intrinsically anisotropic. For simplicity, our model incorporates just an isotropic approximation to this attraction. In other words, we model our DipSus system as a ferrogranular analogue of a Stockmayer fluid.45
To conclude, shaken ferrogranulate exhibits interesting features, including network formation and viscoelastic phase separation. More in depth studies are necessary to find commonalities and differences to networks recently observed in systems of externally induced dipoles.46–48
Last, but not least, we add a far-ranging outlook. Due to the abundance of iron in many asteroids and planets, and its high Curie temperature, the observed coarsening dynamics of susceptible and partly magnetised iron particles may play an important role in the early stage of planet formation. This process may be capable to overcome the bouncing barrier49 in particle agglomeration. The emerging iron “cores” may than trigger the gravitational agglomeration of the remaining matter. Related experiments under microgravity conditions are yet to be performed.
Conflicts of interest
There are no conflicts to declare.Acknowledgements
The authors thank Marcus Hauser, Kai Huang, Elena Katifori, Christof Kruelle, Thomas Fischer, Thomas Mueller, Ingo Rehberg and Gerhard Wurm for fruitful discussions, and Klaus Oetter for support in constructing the experimental setup. Moreover, we are grateful for inspiring suggestions from our two referees. The experiments were conducted at the University of Bayreuth. Part of the research was supported by Austrian Science Fund (FWF): START-Projekt Y 627-N27. S. S. K. is supported by GosZadanie 3.1438.2017/4.6. S. S. K. also acknowledges ETN-Colldense. Computer simulations were performed at the Vienna Scientific Cluster.References
- S. Boccaletti, V. Latora, Y. Moreno, M. Chavez and D.-U. Hwang, Complex networks: Structure and dynamics, Phys. Rep., 2006, 424, 175–308 CrossRef.
- J. E. Hirsch, An index to quantify an individual's scientific research output, Proc. Natl. Acad. Sci. U. S. A., 2005, 102(46), 16569–16572 CrossRef CAS PubMed.
- E. Katifori, G. J. Szöllősi and M. O. Magnasco, Damage and fluctuations induce loops in optimal transport networks, Phys. Rev. Lett., 2010, 104, 048704 CrossRef PubMed.
- W. Baumgarten and M. J. B. Hauser, Functional organization of the vascular network of physarum polycephalum, Phys. Biol., 2013, 10(2), 026003 CrossRef PubMed.
- A. Tero, S. Takagi, T. Saigusa, K. Ito, D. P. Bebber, M. D. Fricker, K. Yumiki, R. Kobayashi and T. Nakagaki, Rules for biologically inspired adaptive network design, Science, 2010, 327(5964), 439–442 CrossRef CAS PubMed.
- H. Tanaka, Unusual phase separation in a polymer solution caused by asymmetric molecular dynamics, Phys. Rev. Lett., 1993, 71(19), 3158–3161 CrossRef CAS PubMed.
- H. Tanaka, Viscoelastic phase separation, J. Phys.: Condens. Matter, 2000, 12, R207 CrossRef CAS.
- R. E. Rosensweig, Ferrohydrodynamics, Cambridge University Press, Cambridge, New York, Melbourne, 1985 Search PubMed.
- Colloidal Magnetic Fluids: Basics, Development and Applications of Ferrofluids, ed. S. Odenbach, Lect. Notes Phys., Springer, Berlin, Heidelberg, New York, 2009, vol. 763 Search PubMed.
- K. Butter, P. H. H. Bomans, P. M. Frederik, G. J. Vroege and A. P. Philipse, Direct observation of dipolar chains in iron ferrofluids by cryogenic electron microscopy, Nat. Mater., 2003, 2, 88–91 CrossRef CAS PubMed.
- W. Wen, F. Kun, S. Pal, D. W. Zheng and K. N. Tu, Aggregation kinetics and stability of structures formed by magnetic microspheres, Phys. Rev. E: Stat. Phys., Plasmas, Fluids, Relat. Interdiscip. Top., 1999, 59, R4758 CrossRef CAS.
- A. Snezhko, I. S. Aranson and W. K. Kwok, Structure formation in electromagnetically driven granular media, Phys. Rev. Lett., 2005, 94, 108002 CrossRef CAS PubMed.
- J. Stambaugh, D. P. Lathrop, E. Ott and W. Losert, Pattern formation in a monolayer of magnetic spheres, Phys. Rev. E: Stat., Nonlinear, Soft Matter Phys., 2003, 68, 026207 CrossRef PubMed.
- J. Stambaugh, Z. Smith, E. Ott and W. Losert, Segregation in a monolayer of magnetic spheres, Phys. Rev. E: Stat., Nonlinear, Soft Matter Phys., 2004, 70, 031304 CrossRef PubMed.
- A. Kögel, Messungen zur Vergröberungsdynamik in transienten ferrogranularen Netzwerken, Bachelor thesis, Experimentalphysik 5, University of Bayreuth, 95440 Bayreuth, Germany, 2015 Search PubMed.
- D. L. Blair and A. Kudrolli, Clustering transitions in vibrofluidized magnetized granular materials, Phys. Rev. E: Stat., Nonlinear, Soft Matter Phys., 2003, 67, 021302 CrossRef PubMed.
- A. V. Lebedev, Low-temperature magnetic fluid stabilized with mixed fatty acids, Colloid J., 2010, 72, 810 CrossRef.
- Open Computer Vision (openCV), http://https://github.com/opencv/opencv/wiki, accessed at 14th of September 2016.
- NetworkX: High-productivity software for complex networks, http://https://networkx.github.io/, link accessed at 12.4.2017.
- Python software foundation, http://https://www.python.org/, accessed at the 13th of September 2016, 2016.
- A. Kögel, Video of the formation of a ferrogranular network, http://www.ep5. uni-bayreuth.de/de/research/Magnetic-Soft-Matter/video/ferronetwork.html, 2015.
- T. Tlusty and S. A. Safran, Defect induced phase separation in dipolar fluids, Science, 2000, 290, 1328 CrossRef CAS PubMed.
- S. S. Kantorovich, A. O. Ivanov, L. Rovigatti, J. M. Tavares and F. Sciortino, Temperature-induced structural transitions in self-assembling magnetic nanocolloids, Phys. Chem. Chem. Phys., 2015, 17, 16601–16608 RSC.
- E. Limpert, W. Staehl and M. Abbt, Log-normal distributions across the sciences: Keys and clues, BioScience, 2001, 51(5), 341–352 CrossRef.
- T. Ishii and M. Matsushita, Fragmentation of long thin glass rods, J. Phys. Soc. Jpn., 1992, 61(10), 3474–3477 CrossRef CAS.
- J. Shackelford, The lognormal distribution in the random network structure, J. Non-Cryst. Solids, 1981, 44, 379–382 CrossRef CAS.
- D. W. Thompson, On Growth and Form, Cambridge University Press, Cambridge, UK, 2nd edn, 1942 Search PubMed.
- V. Latora and M. Marchiori, Efficient behavior of small-world networks, Phys. Rev. Lett., 2001, 87(19), 198701 CrossRef CAS PubMed.
- J. J. Weis and D. Levesque, Chain formation in low density dipolar hard shperes: a monte carlo study, Phys. Rev. Lett., 1993, 71(17), 2729–2732 CrossRef CAS PubMed.
- R. P. Sear, Low-density fluid phase of dipolar hard spheres, Phys. Rev. Lett., 1996, 76, 2310–2313 CrossRef CAS PubMed.
- R. van Roij, Theory of chain association versus liquid condensation, Phys. Rev. Lett., 1996, 76(18), 3348–3351 CrossRef CAS PubMed.
- Y. Levin, What happened to the gas–liquid transition in the system of dipolar hard spheres?, Phys. Rev. Lett., 1999, 83, 1159–1162 CrossRef CAS.
- P. J. Camp, J. C. Shelley and G. N. Patey, Isotropic fluid phases of dipolar hard spheres, Phys. Rev. Lett., 2000, 84(1), 115–118 CrossRef CAS PubMed.
- P. J. Camp and G. N. Patey, Structure and scattering in colloidal ferrofluids, Phys. Rev. E: Stat. Phys., Plasmas, Fluids, Relat. Interdiscip. Top., 2000, 62(4), 5403–5408 CrossRef CAS.
- J. D. Weeks, D. Chandler and H. C. Andersen, Role of repulsive forces in determining the equilibrium structure of simple liquids, J. Chem. Phys., 1971, 54, 5237 CrossRef CAS.
- D. Frenkel and B. Smit, Understanding molecular simulation, Academic Press, 2002 Search PubMed.
- J. J. Cerdà, S. Kantorovich and C. Holm, Aggregate formation in ferrofluid monolayers: simulations and theory, J. Phys.: Condens. Matter, 2008, 20, 204125 CrossRef PubMed.
- S. Kantorovich, J. J. Cerdà and C. Holm, Microstructure analyisis of monodisperse ferrofluid monolayers: theory and simulation, Phys. Chem. Chem. Phys., 2008, 10(14), 1883–1895 RSC.
- J. J. Cerdà, V. Ballenegger, O. Lenz and C. Holm, P3m algorithm for dipolar interactions, J. Chem. Phys., 2008, 129, 234104 CrossRef PubMed.
- A. Bródka, Ewald summation method with electrostatic layer correction for interactions of point dipoles in slab geometry, Chem. Phys. Lett., 2004, 400(1–3), 62–67 CrossRef.
- H. J. Limbach, A. Arnold, B. A. Mann and C. Holm, ESPResSo – an extensible simulation package for research on soft matter systems, Comput. Phys. Commun., 2006, 174(9), 704–727 CrossRef CAS.
- A. Arnold, O. Lenz, S. Kesselheim, R. Weeber, F. Fahrenberger, D. Roehm, P. Košovan and C. Holm, Espresso 3.1: Molecular dynamics software for coarse-grained models. in Meshfree Methods for Partial Differential Equations VI, ed. M. Griebel and M. A. Schweitzer, Lecture Notes in Computational Science and Engineering, Springer Berlin Heidelberg, 2013, vol. 89, pp. 1–23 Search PubMed.
- H. Tanaka, Y. Nishikawa and T. Koyama, Network-forming phase separation of colloidal suspensions, J. Phys.: Condens. Matter, 2005, 17, L143 CrossRef CAS.
- A. B. Dobroserdova and S. S. Kantorovich, Self-diffusion in monodisperse three-dimensional magnetic fluids by molecular dynamics simulations, J. Magn. Magn. Mater., 2017, 431, 176–179 CrossRef CAS.
- M. J. Stevens and G. S. Grest, Phase coexistence of a stockmayer fluid in an applied field, Phys. Rev. E: Stat. Phys., Plasmas, Fluids, Relat. Interdiscip. Top., 1995, 51, 5976–5984 CrossRef CAS.
- J. E. Martin, E. Venturini, G. L. Gulley and J. Williamson, Using triaxial magnetic fields to create high susceptibility particle composites, Phys. Rev. E: Stat., Nonlinear, Soft Matter Phys., 2004, 69(2), 021508 CrossRef PubMed.
- N. Osterman, I. Poberaj, J. Dobnikar, D. Frenkel, P. Ziherl and D. Babić, Field-induced self-assembly of suspended colloidal membranes, Phys. Rev. Lett., 2009, 103(22), 228301 CrossRef CAS PubMed.
- F. J. Maier and T. M. Fischer, Critical nucleation mesh-size of coarsening transient colloidal networks, Soft Matter, 2015, 12(612), 614–618 Search PubMed.
- T. Demirci, J. Teiser, T. Steinpilz, J. Landers, S. Salamon, H. Wende and G. Wurm, Is there a temperature limit in planet formation at 1000k?, Astrophys. J., 2017, 846(1), 48 CrossRef.
Footnote |
| † Electronic supplementary information (ESI) available. See DOI: 10.1039/c7sm00796e |
| This journal is © The Royal Society of Chemistry 2018 |

