Intercalation of alkylamines in layered MoO3 and in situ carbonization for a high-performance asymmetric supercapacitor†
Ningna
Chen
a,
Lu
Ni
a,
Jinhua
Zhou
a,
Guoyin
Zhu
a,
Yu
Zhang
 a,
Shanyong
Chen
a,
Fujie
Gao
a,
Chunliang
Lu
b,
Hongmei
Ji
c,
Jing
Chen
d,
Xizhang
Wang
a,
Xuefeng
Guo
a,
Shanyong
Chen
a,
Fujie
Gao
a,
Chunliang
Lu
b,
Hongmei
Ji
c,
Jing
Chen
d,
Xizhang
Wang
a,
Xuefeng
Guo
 a,
Luming
Peng
a,
Weiping
Ding
a,
Luming
Peng
a,
Weiping
Ding
 a and
Wenhua
Hou
 *a
*a
aKey Laboratory of Mesoscopic Chemistry of MOE, School of Chemistry and Chemical Engineering, Nanjing University, Nanjing 210023, P. R. China. E-mail: whou@nju.edu.cn
bAnalytical Testing Center, Yangzhou University, Yangzhou 225009, P. R. China
cJiangsu Laboratory of Advanced Functional Materials, Department of Chemistry, Changshu Institute of Technology, Changshu 215500, P. R. China
dCollege of Chemistry and Molecular Engineering, Nanjing Tech University, Nanjing 211816, P. R. China
First published on 22nd October 2018
Abstract
MoO3/C nanocomposites are synthesized by first intercalating alkylamines into layered MoO3 and then in situ carbonization at high temperature. The possible arrangements of alkylamines in the interlayers of MoO3 and the interaction between the inorganic host and the organic guest are discussed. The resulting MoO3/C nanocomposite with a high degree of graphitization exhibits a high specific capacitance of 335 F g−1 at a current density of 1 A g−1 and an excellent rate performance (70% capacitance retained 70% capacitance retained from 1 A g−1 to 10 A g−1). In addition, the obtained nanocomposite can be matched well with expanded graphite to maximize the specific capacitance and also to extend the potential window, giving rise to an increased energy density of the cell. The assembled MoO3/C//expanded graphite asymmetric supercapacitor can be cycled reversibly between 0 and 1.6 V with a specific capacitance of 88 F g−1 at 1 A g−1 and an energy density of 31.3 W h kg−1 at a power density of 838.4 W kg−1. Moreover, this supercapacitor exhibits a good cycling behavior with no more than 13.5% capacitance loss after 5000 cycles at 1 A g−1. The excellent performance is mainly attributed to two aspects. On the one hand, opening up MoO3 layers with conductive carbon can provide more redox sites for Faradaic reaction and promote transportation of electrons. On the other hand, MoO3 and intercalated carbon layers form a sandwich-type hybrid nanostructure, which facilitates the penetration and diffusion of electrolyte ions. This work may pave the way for fabricating active electrode materials for high performance energy storage devices through intercalation and in situ carbonization.
1. Introduction
Global energy supply is one of the biggest problems in the fields of materials science and power sources.1 In order to achieve the transition from fossil fuels to sustainable renewable energy, significant improvements in existing technologies and development of novel energy-storage devices are essential.2 As one of the energy storage devices, the supercapacitor has many advantages, such as long cycle life, high power density, fast charging/discharging rate, and so on, which can meet the needs of high-power and portable energy conversion/storage devices.3Based on the different mechanisms of energy storage and conversion, supercapacitors can be divided into two categories, namely, electric double layer capacitors (EDLCs) and pseudocapacitors.4 However, irrespective of the mechanism (ion adsorption or Faradaic redox reaction), the energy storage process mainly occurs on or near the surface of the electrode materials, which seriously restricts the practical application of supercapacitors.5 Hence, great interest has been aroused to explore high-performance electrode materials suitable for supercapacitors.
Many electrode materials, including carbon-based materials, metal oxides and conducting polymers, have been extensively studied for use in supercapacitors.6 Among them, layered transition metal oxides are promising due to their abundant active sites, low cost and high theoretical capacity. Molybdenum trioxide (MoO3), as a typical layered transition metal oxide, is composed of twisted MoO6 octahedra sharing the edges in one direction and the corners in the other direction to form layers. The layers are connected by weak van der Waals forces.7 Due to the high electrochemical activity, environmental friendliness, unique layered structure and facile intercalation of guest molecules, a lot of attention has been paid to MoO3-based materials.8–10 For example, Guduru's group studied the co-intercalation of different ions (Be2+ and H+) into orthogonal phase MoO3 (α-MoO3) and the resulting material has a specific capacitance of 169 F g−1 at a current density of 25 A g−1 and a retention of 81% after 2000 cycles.11 Shakir et al. adopted an in situ hydrogenation treatment of α-MoO3 nanowires for enhanced supercapacitors. The obtained HxMoO3 nanowires showed a specific capacitance of 168 F g−1 at a current density of 0.5 A g−1 and maintained a specific capacitance of 108 F g−1 at 10 A g−1, which was 36 times higher than that of the original MoO3 nanowires under the same conditions.12
It has been reported that many organic compounds, such as pyridine,7 2,2′-bipyridine,13 polypyrrole,10 polyaniline14,15 and poly(tetramethyl-p-phenylenediamine dihydrochloride),16 can be embedded in the interlayers of MoO3. Alkylamines have also been studied as a class of guest molecules to intercalate MoO3.17,18 For example, Hao et al. successfully prepared novel inorganic–organic hybrid composites by inserting n-butylamine into α-MoO3 layers.19 Pan et al. studied the intercalation process between MoO3 and alkylamines with various chain lengths.20 Hiroaki Imai's group reported that alkylamines (CnH2n+1NH2, n = 10, 14, 16 and 18) could be intercalated into metal oxides (MnO2 and TiO2) to obtain organic–inorganic composite nanosheets.21 Yang et al. prepared oleylamine-intercalated MoO3 nanoplates for high power lithium-ion batteries by using a hydrothermal method.22 Generally, the intercalated guest molecules lead to an increase of the interlayer spacing, which is beneficial for the rapid diffusion of ions and significant increase of Faraday redox sites of the MoO3 host. However, the electrical conductivity and capacitance of MoO3 are still not ideal, which requires the introduction of a conductive matrix to improve the overall performance.23 Our group once reported that MoO3 could be intercalated by dodecylamine (DDA). Upon calcination, the intercalated DDA was then in situ carbonized to achieve a MoO3/C nanocomposite with a high specific capacitance of 331 F g−1 at 1 A g−1.24 However, the method still has some limitations, for example, it's just for one kind of alkylamine (dodecylamine) and without practical applications. To further explore whether other alkylamines can also be used in this method, the intercalation and carbonization behavior and electrochemical properties of alkylamines with different chain lengths were discussed. Moreover, the obtained composite was used as the positive electrode material of an asymmetric supercapacitor.
In this work, the intercalation behavior of MoO3 with different chain lengths of alkylamines such as propylamine, decylamine and hexadecylamine was studied. The possible arrangements of alkylamines in the interlayers of MoO3 and the interaction between the inorganic host and the organic guest were discussed. After in situ carbonization, the alternative stacking of MoO3 and carbon layers was achieved, and sandwich-like MoO3/C hybrid nanostructures were obtained and their electrochemical properties were examined. Moreover, an asymmetric supercapacitor was successfully fabricated using MoO3/C as the positive electrode and expanded graphite as the negative electrode.
2. Experimental section
2.1 Materials
Molybdenum trioxide (MoO3), propylamine (PA), decylamine (DA), hexadecylamine (HDA), sulphuric acid (H2SO4, 98%), acetylene black, polytetrafluoroethylene (PTFE, 60%) and anhydrous ethanol were purchased from Shanghai Chemical Reagent Co. Expanded graphite (expansion temperature ∼900 °C) was purchased from XFNANO Advanced Materials Supplier. All chemicals were of analytical grade and used as received without further treatment.2.2 Preparation of MoO3/C hybrid nanostructures
Various alkylamines with different chain lengths, i.e., PA, DA and HDA, were used to intercalate layered MoO3. MoO3 (1.4 mmol), alkylamine (7 mmol) and anhydrous ethanol (20 mL) were mixed and refluxed at 70 °C for 96 h. After that, the reaction mixture was cooled to room temperature, centrifuged and washed several times with absolute ethanol. The resulting samples were collected and dried overnight at 60 °C; PA, DA and HDA-intercalated MoO3 samples were denoted as MoO3/PA, MoO3/DA and MoO3/HDA, respectively.To prepare MoO3/C hybrid nanostructures, alkylamine-intercalated MoO3 samples (MoO3/PA, MoO3/DA and MoO3/HDA) were further calcined at 600 °C for 5 h under a N2 atmosphere with a heating rate of 2 °C min−1. The obtained samples were labeled MoO3/CPA, MoO3/CDA and MoO3/CHDA, respectively.
2.3 Structure and morphology characterization
Powder X-ray diffraction (XRD) was employed to analyze the structure and phase of the samples. The instrument model was Philip-X'Pert with Cu Kα radiation (λ = 1.5418 Å). Scanning electron microscopy (SEM, JEOL JEM-6300F) was used to analyze the morphology of the samples. Transmission electron microscopy (TEM, JEOL JEM-200CX) was adopted to characterize the microstructure of the samples. An X-ray photoelectron spectrometer (Thermo Fisher Scientific, K-Alpha) was used to analyze the chemical composition and elemental valence on an electronic hemispherical analyzer (energy 20 eV) with Al Kα X-ray beams as the excitation source (hν = 1486.6 eV). Raman spectroscopy measurements were performed on a Raman spectrometer (Horiba JY H800) (λex = 532 nm). Nitrogen adsorption/desorption isotherms were recorded on a Micromeritics ASAP 2020 sorption instrument, and the samples were activated under vacuum at 300 °C for 3 h before testing. The specific surface area was calculated according to the BET equation. The pore size distribution curve was estimated using the BJH formula with desorption isotherms.2.4 Electrochemical measurements
![[thin space (1/6-em)]](https://www.rsc.org/images/entities/char_2009.gif) :
:![[thin space (1/6-em)]](https://www.rsc.org/images/entities/char_2009.gif) 10
10![[thin space (1/6-em)]](https://www.rsc.org/images/entities/char_2009.gif) :
:![[thin space (1/6-em)]](https://www.rsc.org/images/entities/char_2009.gif) 10 and stirred overnight to be fully mixed. Then the slurry was uniformly coated on graphite sheet substrates with an area of approximately 1 × 1 cm2. The thickness was controlled using a scraper at 25 μm. The working electrodes were dried at 120 °C for 12 h in a vacuum oven, and the total mass of the material was about 1.3 mg. A three-electrode system was used for the electrochemical performance test in 1 M H2SO4 solution. A saturated calomel electrode was used as the reference electrode, and a platinum wire was adopted as the counter electrode. The supercapacitive performance was tested by using cyclic voltammetry (CV) and galvanostatic charge/discharge (GCD) techniques within a voltage range of −0.1 V to 0.9 V. The scan rates of CV were 5, 10, 20, 50 and 100 mV s−1, and the current densities of GCD were 1, 2, 4, 8 and 10 A g−1, respectively. Electrical impedance spectroscopy (EIS) was carried out with an amplitude of 5 mV in a frequency range of 10−2 Hz to 105 Hz. All electrochemical tests were performed on a CHI660D electrochemical workstation.
10 and stirred overnight to be fully mixed. Then the slurry was uniformly coated on graphite sheet substrates with an area of approximately 1 × 1 cm2. The thickness was controlled using a scraper at 25 μm. The working electrodes were dried at 120 °C for 12 h in a vacuum oven, and the total mass of the material was about 1.3 mg. A three-electrode system was used for the electrochemical performance test in 1 M H2SO4 solution. A saturated calomel electrode was used as the reference electrode, and a platinum wire was adopted as the counter electrode. The supercapacitive performance was tested by using cyclic voltammetry (CV) and galvanostatic charge/discharge (GCD) techniques within a voltage range of −0.1 V to 0.9 V. The scan rates of CV were 5, 10, 20, 50 and 100 mV s−1, and the current densities of GCD were 1, 2, 4, 8 and 10 A g−1, respectively. Electrical impedance spectroscopy (EIS) was carried out with an amplitude of 5 mV in a frequency range of 10−2 Hz to 105 Hz. All electrochemical tests were performed on a CHI660D electrochemical workstation.
3. Results and discussion
3.1 The structure and morphology of the hybrid nanostructures
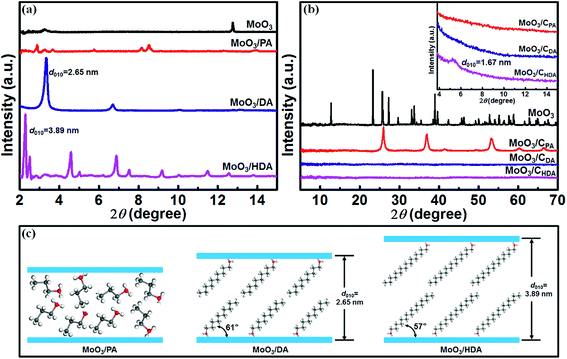
To observe the structural changes of the samples before and after intercalation, powder X-ray diffraction was used. As shown in Fig. 1, bulk MoO3 has a typical layered structure (JCPDS: 35-0609). The diffraction peak at 2θ = 12.8° corresponds to the (010) crystal plane, and the corresponding interlayer spacing is 0.69 nm. When PA is introduced into MoO3, the resulting MoO3/PA reveals irregular diffraction peaks at a small angle of 2–15° (Fig. 1a). However, when the long-chain alkylamines (DA and HDA) are introduced, the products exhibit pronounced characteristic diffraction peaks of (0k0) crystal planes.It was found that the interlayer spacings of MoO3/DA and MoO3/HDA were enlarged to 2.65 nm and 3.89 nm, respectively, suggesting that the long-chain alkylamines have been successfully inserted into the interlayers of MoO3. According to the literature,25 the length of the DA molecule is about 1.52 nm. Thus, it can be estimated that DA molecules are in a double-layer arrangement form between the MoO3 layers with an inclination angle of ∼61° to the MoO3 layer (Fig. 1c). Similarly, as the length of the HDA molecule is close to 2.30 nm, it can be inferred that the embedded HDA molecules also adopt a double-layer arrangement between the MoO3 layers with an inclination angle of 57° (Fig. 1c).
After calcination in N2, structural changes of alkylamine-intercalated MoO3 can be observed. As shown in the inset of Fig. 1b, the resulting MoO3/CPA and MoO3/CDA composites exhibit no obvious peak within a small angle range, whereas MoO3/CHDA displays a weak diffraction peak at 2θ = 5.3°. Correspondingly, the interlayer spacing is 1.67 nm. In a wide angle range, MoO3/CPA exhibits typical characteristic diffraction peaks of MoO2 (PDF: 32-0671) due to the reduction of MoO3 by the reductive small molecules released during the carbonization process.26 For MoO3 intercalated by an alkylamine with a long chain length, there are no significant diffraction peaks in a wide angle range after calcination, indicating the destruction of the long-range order of MoO3 bulk crystals due to the decomposition of guest molecules such as alkylamines and thus the formation of carbon.24
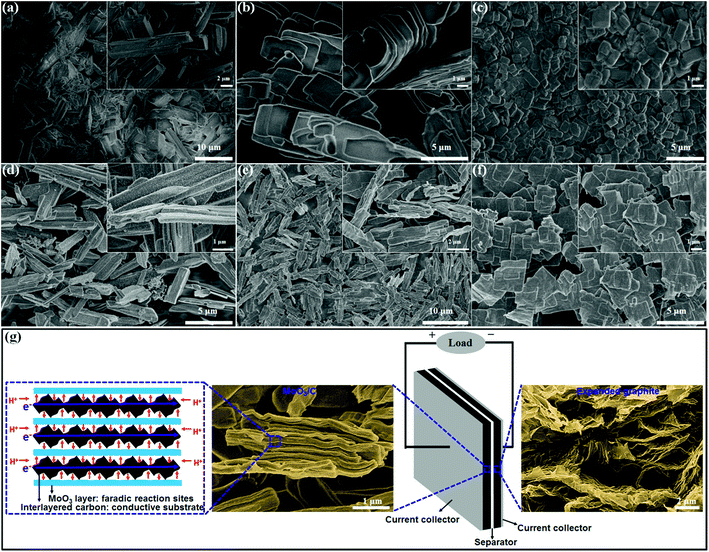
The introduction of alkylamines with different chain lengths into the interlayers of layered MoO3 results in intercalation compounds with different morphologies. As presented in Fig. S1,† the original MoO3 has a morphology of uniform micrometer-sized plates. When PA is introduced into the MoO3 host, MoO3/PA exhibits a layered block structure quite similar to that of the MoO3 host (Fig. 2a).24 By comparison, when DA is introduced, MoO3/DA presents an ordered house-of-cards layered structure (Fig. 2b). This morphology is quite different from that of MoO3/PA, demonstrating that the intercalation is fully achieved. Furthermore, when HDA is introduced, MoO3/HDA displays a very uniform lamellar structure (Fig. 2c). By comparing the morphologies of the three alkylamine-intercalated compounds, it can be found that as the chain length of alkylamines is increased, the morphology of the intercalated products becomes regular and the size is gradually decreased. This may be due to the fact that as the chain length of alkylamines is increased, the interlayer spacing of the layered material is apparently enlarged.27,28
When these three intercalation compounds were calcined in a nitrogen atmosphere at 600 °C, their morphologies changed correspondingly. As shown in Fig. 2d, when MoO3/PA was calcined, uniform particles of MoO2 appeared on the surface of the layered bulk material. It may be due to the fact that propylamine can be freely intercalated into the interlayers of MoO3 and easily carbonized at high temperature and meanwhile reduce MoO3 to MoO2.29 After calcination of MoO3/DA and MoO3/HDA, the ordered layered structure is still maintained (Fig. 2e and f). The sizes are increased, which might be attributable to the fact that the in situ carbonization of the interlayered long-chain alkylamines causes the plates to be stacked tightly together.30 As shown in Fig. S3,† the HRTEM images of MoO3, MoO3/DA, and MoO3/CDA further demonstrate the intercalation of the alkylamines and the formation of sandwich-like MoO3/C hybrid nanostructures.
In order to confirm the formation of the intercalated carbon layers, MoO3/CHDA was soaked in 2 mol L−1 NaOH solution to eliminate MoO3 host layers and thus only interlayered species were left. As shown in Fig. S2a,† the EDX spectrum presents no signal of Mo element, indicating that MoO3 host layers are completely removed and only C element is present. Moreover, the SEM image reveals that the interlayered carbon has a morphology of quite uniform ultrathin sheets (Fig. S2b†).
Raman spectroscopy was used to study the degree of graphitization of the intercalated alkylamines after in situ carbonation. As shown in Fig. 3a, there are characteristic peaks at 1356 and 1585 cm−1, corresponding to the D and G-bands of the carbon material, respectively. This reveals that the intercalated alkylamines have been graphitized and the resulting carbon materials are disordered. The peak intensity ratio of the D-band to the G-band (referred to as ID/IG) can be used to disclose the degree of graphitization of the resulting carbon layer.31 The ID/IG values are 1.07, 1.05 and 1.02 for MoO3/CPA, MoO3/CDA and MoO3/CHDA, respectively. This implies that as the chain length of alkylamines is increased, the degree of graphitization is increased for the resulting carbon layer. The degree of graphitization has a direct effect on the electrochemical performance.32
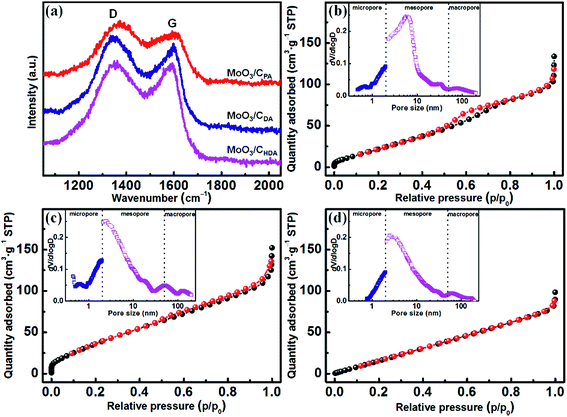 | ||
| Fig. 3 (a) Raman spectra and N2 adsorption/desorption isotherms of MoO3/CPA (b), MoO3/CDA (c) and MoO3/CHDA (d) (the insets are pore-size distribution curves). | ||
Fig. 3b–d show the N2 adsorption/desorption isotherms and corresponding pore-size distribution curves for MoO3/CPA, MoO3/CDA and MoO3/CHDA, respectively. It can be seen that the three samples have a hierarchically porous structure and a large specific surface area. The BET specific surface areas of MoO3/CPA, MoO3/CDA and MoO3/CHDA are 117, 163 and 123 m2 g−1, respectively. Obviously, MoO3/CDA has a much larger specific surface area and the percentages of micro-, meso- and macropores are 21.4%, 70.7% and 7.9%, respectively. The rich porosity with a large specific surface area is favorable for charge storage.33
XPS was used to analyze the chemical composition and elemental valence of the obtained MoO3/C hybrids. Fig. 4a–c show the XPS spectra of the MoO3/CPA, MoO3/CDA and MoO3/CHDA samples in the Mo 3d region. The two peaks at high binding energies of 231.6 and 234.6 eV are corresponding to the 3d5/2 and 3d3/2 orbitals of Mo6+, while the other two peaks at lower binding energies of 228.8 and 233.1 eV are ascribed to the 3d5/2 and 3d3/2 orbitals of Mo4+, respectively. The existence of Mo4+ is due to the partial reduction of Mo6+ during carbonization.
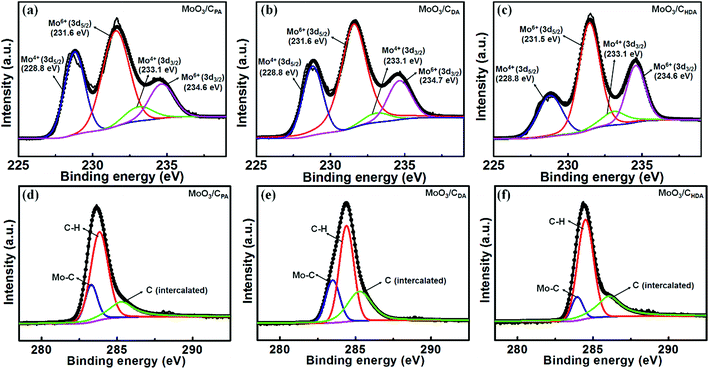 | ||
| Fig. 4 XPS spectra of (a and d) MoO3/CPA, (b and e) MoO3/CDA and (c and f) MoO3/CHDA in the Mo 3d and C 1s regions, respectively. | ||
Gaussian and Lorentzian functions were used to fit the XPS spectra of the three samples in the Mo 3d region and the fitting results are given in Table S1.† It can be seen that the content of Mo4+ in MoO3/CPA is about 28.5% and the rest is in the form of Mo6+. This is mainly due to the presence of MoO2 in MoO3/CPA (see the XRD results above). By comparison, the content of Mo4+ in MoO3/CDA is 38.2%. Correspondingly, the content of Mo6+ is decreased. For DA, it is easily decomposed into small molecules with a weak reducibility during the in situ carbonization process, leading to a higher content of Mo4+. In MoO3/CHDA, the content of Mo4+ is about 29.1%, which is higher than that in MoO3/CPA and lower than that in MoO3/CDA. This can be explained by the fact that the chain length of HDA is so long that the small molecules released upon calcination would be carbonized and coated on the MoO3 surface and then reduce part of MoO3.34,35
Fig. 4d–f present the XPS spectra of MoO3/CPA, MoO3/CDA and MoO3/CHDA in the C 1s region, and the fitting results are listed in Table S2.† The three peaks at 283.3, 283.8 and 285.3 eV are, respectively, corresponding to Mo–C, C–H and intercalated carbon.36 It can be seen that the percentage of C–H is decreased from 59.8% to 49.0% as the intercalating guest is changed from PA to DA. Meanwhile, the content of intercalated carbon is increased from 21.5% to 29.8%. Compared with MoO3/CDA, the percentage of C–H in MoO3/CHDA is increased (61.3%) and the content of intercalated carbon is decreased (28.2%). From the above results, the content of intercalated carbon is low in MoO3/CPA but high in MoO3/CDA, which is ascribed to the intercalation of DA into MoO3 and in situ carbonization. Nevertheless, as the chain length was further increased to sixteen carbons (HDA), part of the interlayered carbon would react with MoO3, leading to a decrease of the intercalated carbon.35
3.2 The electrochemical performance of the hybrid nanostructures
 | (5-1) |
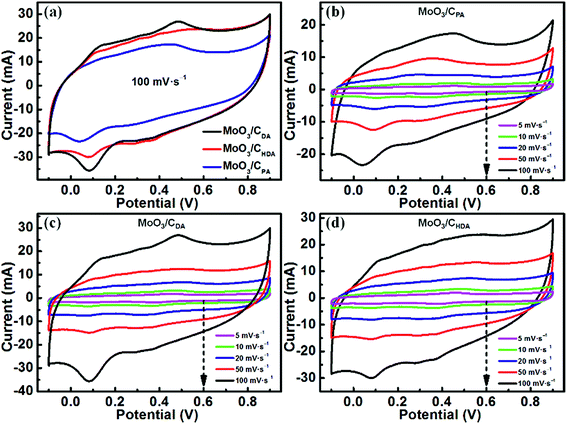 | ||
| Fig. 5 Cyclic voltammogram curves of (a) the MoO3/CPA, MoO3/CDA and MoO3/CHDA electrodes at a scan rate of 100 mV s−1 and (b) MoO3/CPA, (c) MoO3/CDA and (d) MoO3/CHDA at different scan rates. | ||
Moreover, MoO3/CDA encloses the greatest area among the three samples, implying the largest specific capacitance.
As shown in Fig. 5b, when testing the electrochemical performance of MoO3/CPA at different scan rates, the CV curves are severely deformed from 5 mV s−1 to 100 mV s−1. This suggests that the material has a large electrode impedance, which is not conducive to the rate performance.38,39 However, for MoO3/CDA and MoO3/CHDA (Fig. 5c and d), the shape of the CV curves almost remains unchanged as the scan rate is increased even to a high value of 100 mV s−1, which is beneficial for an excellent rate performance.8,40 In addition, the CV curves show both capacitive and faradaic currents; we used the power law to separate the charge storage contributions from diffusion and non-diffusion control.41–43 Fig. S4† shows the percentage of intercalation capacitance at different scan rates and it can be found that the intercalation capacitance decreases as the scan rate is increased due to the diffusion limit of the electrolytes.
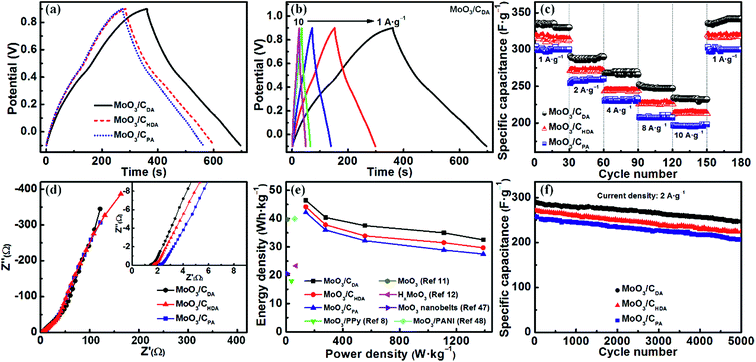
Fig. 6a shows the charge–discharge curves of MoO3/CPA, MoO3/CDA and MoO3/CHDA at a current density of 1 A g−1. It can be seen that all three curves present a certain degree of slope, indicating the pseudocapacitive behavior. The corresponding specific capacitance values are 304, 335 and 319 F g−1, respectively. Among them, the performance of MoO3/CDA is prominent, which is consistent with the CV results. This may be due to the fact that the electrolyte ions can not only diffuse to the surface of the electrode material but also penetrate into the interlayers of layered MoO3.44
The specific capacitance of MoO3/CDA at different current densities was tested. The corresponding values are 335, 291, 270, 252 and 234 F g−1 at 1, 2, 4, 8 and 10 A g−1, respectively (Fig. 6b). The rate performance of the three samples is shown in Fig. 6c. For MoO3/CDA, the specific capacitance retention is 70% as the current density is increased from 1 A g−1 to 10 A g−1. By comparison, both MoO3/CPA and MoO3/CHDA electrode materials have a relatively inferior rate performance, showing retentions of 65% and 68%, respectively.
Fig. 6d shows the electrochemical impedance spectra of the MoO3/CPA, MoO3/CDA and MoO3/CHDA electrode materials. The intersection of the curve in the high-frequency region with the real axis represents the equivalent series resistance (Rs). The smaller the value of Rs, the better the conductivity of the test sample, and vice versa. As shown in the inset of Fig. 6d, the Rs values for MoO3/CPA, MoO3/CDA and MoO3/CHDA are 2.06, 1.38 and 1.61 Ω, respectively. This indicates that MoO3/CDA has the highest conductivity among the three samples, which is mainly due to the high content of intercalated carbon layers. Compared with the reported materials based on molybdenum oxide, such as C/MoO3 nanoparticles (10.5 Ω),10 MWCNT/MoO3 (2.3 Ω)45 and MoS2/MoOx (1.91 Ω),46 MoO3/CDA shows an excellent electronic conductivity.
Fig. 6e shows the Ragone plots for the energy density and power density of MoO3/CPA, MoO3/CDA and MoO3/CHDA. The energy densities of MoO3/CPA, MoO3/CDA and MoO3/CHDA are 42.2, 46.5, and 44.2 W h kg−1 at a power density of 138.9 W kg−1, respectively. When the maximum power density is 1388.9 W kg−1, the three samples can still maintain rather high energy densities of 27.5, 32.5 and 29.7 W h kg−1, respectively. Particularly, MoO3/CDA exhibits the highest energy and power densities. It can be seen that the hybrid materials derived from alkylamine-intercalated MoO3 have both a high energy density and a high power density, superior to many previously reported MoO3-based electrode materials.8,11,12,47,48
Fig. 6f shows the cycle life of the three samples at a current density of 2 A g−1. The MoO3/CPA and MoO3/CHDA electrode materials exhibit initial discharge specific capacitances of 259 F g−1 and 272 F g−1, respectively. By comparison, MoO3/CDA exhibits a higher initial discharge specific capacitance of 291 F g−1 and can still maintain 85% of the initial value after 5000 charge and discharge cycles, which is better than those of MoO3/CPA (80%) and MoO3/CHDA (83%). The excellent performance comes from the fact that the interlayered carbon can support MoO3 layers well without significant deformation during the charge/discharge process.
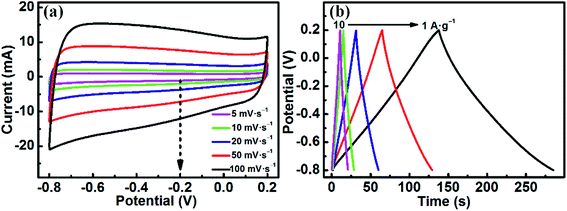
Expanded graphite (EG), due to its low price, excellent chemical stability, high porosity, good electrical conductivity and large specific surface area, has been widely investigated as an active electrode material in electrochemical supercapacitors.49 In this work, in order to assemble an asymmetric supercapacitor, EG was chosen to act as the negative electrode material. The electrochemical performance of EG was measured in a three-electrode system with 1 M H2SO4 solution. As shown in Fig. 7a, the CV curves can still retain a symmetrical rectangular shape without obvious distortion even at a high scan rate of 100 mV s−1, demonstrating an excellent EDLC behavior of EG. Fig. 7b shows the GCD curves at various current densities. It can be clearly observed that all curves are highly linear and symmetrical from 1 to 10 A g−1, indicating the typical characteristics of an ideal capacitor. Moreover, no obvious IR drop is observed for all curves, meaning a low internal resistance of the EG electrode. The EG electrode delivers specific capacitances of 147, 129, 115, 108 and 99 F g−1 at different current densities of 1, 2, 4, 8 and 10 A g−1, respectively. These results demonstrate that the EG electrode has an exceptional electrochemical performance.
Fig. S5† shows the CV and GCD curves of the fabricated MoO3/CDA//EG ASC with different voltages ranging from 1.0 to 1.6 V in 1 M H2SO4. The CV curves present a similar rectangle even at a high voltage of 1.6 V, indicating an ideal capacitive behavior.51 Correspondingly, the GCD profiles clearly display almost symmetrical curves with both charge and discharge parts even at a high electrochemical window of 1.6 V, meaning an outstanding supercapacitive performance of this device.52 According to the charge/discharge curves, as the operating voltage is increased from 1.0 V to 1.6 V, the specific capacitance can be increased from 69 to 88 F g−1, which is beneficial for achieving a high energy density.
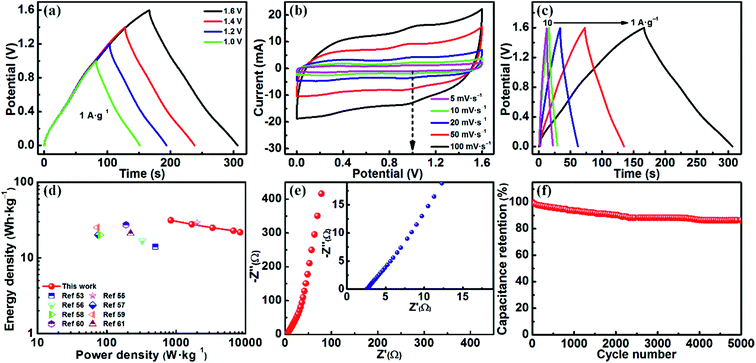
Fig. 8b presents the CV curves of the MoO3/CDA//EG ASC device at different scan rates with a voltage window of 1.6 V. The redox peaks appear due to the existence of MoO3.53 The current is increased slowly with the scan rate. Moreover, the CV curves are hardly distorted at high scan rates, implying a high rate capability.44
Fig. 8c shows the GCD curves examined at various current densities with a voltage window of 1.6 V. Obviously, the nonlinear GCD curves of the MoO3/CDA//EG ASC reveal a typical pseudocapacitive behavior, which is consistent with the CV result.54 Even at a high current density of 10 A g−1, the ASC still retains a capacitance of 61 F g−1, which is 69.3% of that at a low current density of 1 A g−1. The good rate capability of the ASC can be attributed to the intercalated carbon of the positive electrode and the conductive EG of the negative electrode.
The energy density and power density were calculated based on the following formulas:  and P = E/t, where C is the specific capacitance of the asymmetric supercapacitor, V is the voltage window and t is the discharge time. Fig. 8d shows a Ragone plot of E versus P. The MoO3/CDA//EG ASC with a cell voltage of 1.6 V can display a high energy density of 31.3 W h kg−1 at a power density of 838.4 W kg−1 and maintain an energy density of 21.7 W h kg−1 even at a high power density of 8384 W kg−1. These results are better than those of other MoO3-based supercapacitors, such as the all-solid-state flexible supercapacitor based on rGO/MoO3,53 MoO3 nanoplate//AC ASC,55 α-MoO3//AC ASC,56 PPy@MoO3//AC,57 PPy@MoO3//Na0.35MnO2 ASC,58 MnO2@rGO//MoO3@rGO ASC,59 MoO3@Ni//VO2@Ni ASC60 and MoO3–PPy//CNTs–MnO2 ASC.61
To investigate the electrical conductivity of the MoO3/CDA//EG ASC, EIS analysis was performed over the frequency range of 0.01 Hz to 100 kHz with an amplitude of 5 mV. As shown in Fig. 8e, the Nyquist plot presents a nearly vertical line in the entire frequency region, meaning a low diffusion resistance of electrolyte ions in the present device. In addition, the intersection point on the real axis in the high frequency region represents the equivalent series resistance (Rs). It can be seen that the fabricated MoO3/CDA//EG ASC reveals a low Rs (2.6 Ω), indicating a fast interfacial charge transfer.
The cycling performance is also a criterion for evaluating the practical value of the MoO3/CDA//EG ASC. Fig. 8f shows the capacitance retention measured by galvanostatic charge/discharge tests with a voltage window of 1.6 V at a current density of 1 A g−1 for 5000 cycles. Obviously, the assembled ASC presents a quite high capacitance retention of 86.5% after 5000 cycles, which is superior to other MoO3-related ASCs, such as PPy@MoO3//AC ASC (83% retention after 600 cycles),57 PPy@MoO3//Na0.35MnO2 ASC (79% retention after 1000 cycles)58 and MoO3–PPy//CNT–MnO2 ASC (76% retention after 10![[thin space (1/6-em)]](https://www.rsc.org/images/entities/char_2009.gif) 000 cycles).61 This indicates that the MoO3/CDA//EG ASC has a rather good cycling performance.
000 cycles).61 This indicates that the MoO3/CDA//EG ASC has a rather good cycling performance.
3.3 The charge–discharge mechanism of the asymmetric supercapacitor
Based on the above experimental results, the excellent electrochemical performance of the assembled MoO3/CDA//EG ASC may be due to the following reasons: first, the carbon layers in MoO3/CDA formed through the in situ carbonization of the intercalated alkylamine open up the interlamellar spacing of MoO3, and thus the electrolyte ions can not only contact the surface of the electrode materials but also easily enter and store between the MoO3 layers. This accelerates the diffusion of electrolyte ions and increases the active sites available for participation in the redox reactions. Second, the carbon layer can act as a conductive substrate for MoO3 to improve the electronic conductivity of the electrode materials and maintain the mechanical strain during the charging/discharging processes as well. In addition, the carbon layer may also serve as the active center of the EDLC. Third, the sandwich-like structure with the alternatively stacked MoO3 and carbon layers is beneficial for the good rate characteristics and cycling stability. Finally, MoO3/CDA can match well with EG to assemble the ASC with a high voltage window, giving rise to the high energy and power densities.4. Conclusion
In this work, a simple intercalation-carbonization technique was utilized to design and synthesize sandwich-type MoO3/C hybrid nanostructures for high-performance asymmetric supercapacitors. The resulting MoO3/C composites exhibit a high specific capacitance, an excellent rate performance and a good cycle stability. Combining the advantages of the MoO3/CDA nanocomposite and EG, the assembled MoO3/CDA//EG ASC exhibits not only a high specific capacitance of 88 F g−1 at a current density of 1 A g−1 with an extended voltage window of 1.6 V but also a high energy density of 31.3 W h kg−1 at a high power density of 838.4 W kg−1 with an outstanding cycle life (86.5% capacitance retention after 5000 cycles). The excellent electrochemical performance mainly originates from the following four aspects. First, the intercalated carbon layers are conductive, which can improve the conductivity. Second, the intercalated carbon layers can open up the MoO3 host to provide more redox sites, which is beneficial to exploit the pseudocapacitance of MoO3. Third, the unique sandwich-like structure can maintain a good structural stability, which is conducive to improve the cycling performance. Finally, the voltage window is extended when combining with expanded graphite.Author contributions
Ningna Chen conceived the idea and designed the study. Lu Ni and Jinhua Zhou performed the synthesis. Guoyin Zhu and Yu Zhang conducted SEM and TEM characterization. Shanyong Chen and Fujie Gao performed XRD, Raman and XPS analyses. Chunliang Lu and Hongmei Ji conducted the experiments of MoO3/C//expanded graphite based supercapacitors. Jing Chen, Xizhang Wang, Xuefeng Guo, Luming Peng and Weiping Ding contributed to the data analysis. Ningna Chen analyzed the data and wrote the paper. Wenhua Hou revised the manuscript and supervised the project. All authors discussed the results and commented on the manuscript.Conflicts of interest
There are no conflicts to declare.Acknowledgements
The authors greatly appreciate the financial support of the Natural Science Foundation of China (21773116), the Specialized Research Fund for the Doctoral Program of Higher Education (SRFDP, 20130091110010), the Natural Science Foundation of Jiangsu Province (BK2011438, BK20160409), the National Science Fund for Talent Training in Basic Science (No. J1103310), and the Modern Analysis Center of Nanjing University.References
- T. Faunce, S. Styring, M. R. Wasielewski, G. W. Brudvig, A. W. Rutherford, J. Messinger, A. F. Lee, C. L. Hill, H. deGroot, M. Fontecave, D. R. MacFarlane, B. Hankamer, D. G. Nocera, D. M. Tiede, H. Dau, W. Hillier, L. Wang and R. Amal, Energy Environ. Sci., 2013, 6, 1074–1076 RSC.
- D. Gielen, F. Boshell and D. Saygin, Nat. Mater., 2016, 15, 117–120 CrossRef CAS PubMed.
- P. Simon, Y. Gogotsi and B. Dunn, Science, 2014, 343, 1210–1211 CrossRef CAS PubMed.
- X. Yang, C. Cheng, Y. Wang, L. Qiu and D. Li, Science, 2013, 341, 534–537 CrossRef CAS PubMed.
- F. Bonaccorso, L. Colombo, G. Yu, M. Stoller, V. Tozzini, A. C. Ferrari, R. S. Ruoff and V. Pellegrini, Science, 2015, 347, 1246501–1246510 CrossRef PubMed.
- Z. Lin, E. Goikolea, A. Balducci, K. Naoi, P. L. Taberna, M. Salanne, G. Yushin and P. Simon, Mater. Today, 2018, 21, 419–436 CrossRef CAS.
- X. Y. Ren, D. Li, Y. Gao and Y. G. Chen, Inorg. Chem. Commun., 2018, 89, 89–93 CrossRef CAS.
- X. Zhang, X. Zeng, M. Yang and Y. Qi, ACS Appl. Mater. Interfaces, 2014, 6, 1125–1130 CrossRef CAS PubMed.
- N. A. Chernova, M. Roppolo, A. C. Dillon and M. S. Whittingham, J. Mater. Chem., 2009, 19, 2526–2552 RSC.
- F. H. Hsu and T. M. Wu, J. Mater. Sci.: Mater. Electron., 2018, 29, 382–391 CrossRef CAS.
- J. C. Icaza and R. K. Guduru, J. Alloys Compd., 2017, 726, 453–459 CrossRef CAS.
- I. Shakir, M. Shahid, U. A. Rana and M. F. Warsi, RSC Adv., 2014, 4, 8741–8745 RSC.
- S. Rajagopal, M. Bharaneswari, D. Nataraj, O. Y. Khyzhun and Y. Djaoued, RSC Adv., 2016, 6, 88287–88299 RSC.
- S. Bai, Y. Zhao, J. Sun, Z. Tong, R. Luo, D. Li and A. Chen, Sens. Actuators, B, 2017, 239, 131–138 CrossRef CAS.
- O. Y. Posudievsky, S. A. Biskulova and V. D. Pokhodenko, J. Mater. Chem., 2002, 12, 1446–1449 RSC.
- K. Shao, Y. Ma, Y. A. Cao, Z. H. Chen, X. H. Ji and J. N. Yao, Chem. Mater., 2001, 13, 250–252 CrossRef.
- M. Niederberger, F. Krumeich, H. J. Muhr, M. Muller and R. Nesper, J. Mater. Chem., 2001, 11, 1941–1945 RSC.
- M. I. Shukoor, H. A. Therese, L. Gorgishvili, G. Glasser, U. Kolb and W. Tremel, Chem. Mater., 2006, 18, 2144–2151 CrossRef CAS.
- R. Wang, X. Lu, L. Hao, W. Jiao, W. Liu, J. Zhang, F. Yuan and F. Yang, J. Mater. Chem. C, 2017, 5, 427–433 RSC.
- Y. Jing, Q. Pan, Z. Cheng, X. Dong and Y. Xiang, Mater. Sci. Eng., B, 2007, 138, 55–59 CrossRef CAS.
- M. Honda, Y. Oaki and H. Imai, Chem. Mater., 2014, 26, 3579–3585 CrossRef CAS.
- X. Liu, J. Yang, W. Hou, J. Wang and Y. Nuli, ChemSusChem, 2015, 8, 2621–2624 CrossRef CAS PubMed.
- Q. Mahmood, H. J. Yun, W. S. Kim and H. S. Park, J. Power Sources, 2013, 235, 187–192 CrossRef CAS.
- H. Ji, X. Liu, Z. Liu, B. Yan, L. Chen, Y. Xie, C. Liu, W. Hou and G. Yang, Adv. Funct. Mater., 2015, 25, 1886–1894 CrossRef CAS.
- J. F. Lambert, Z. Deng, J. B. d'Espinose and J. J. Fripiat, J. Colloid Interface Sci., 1989, 132, 337–351 CrossRef CAS.
- R. Li, PhD thesis, North Carolina Agricultural and Technical State University, 2016.
- M. C. Pazos, M. A. Castro, M. M. Orta, E. Pavón, J. S. V. Rios and M. D. Alba, Langmuir, 2012, 28, 7325–7332 CrossRef CAS PubMed.
- M. Toyoda, A. Shimizu, H. Iwata and M. Inagaki, Carbon, 2001, 39, 1697–1707 CrossRef CAS.
- S. Yoo, J. I. Lee, S. Ko and S. Park, Nano Energy, 2013, 2, 1271–1278 CrossRef CAS.
- J. Wang, L. Yao, C. Ma, X. Guo, W. Qiao, L. Ling and D. Long, ACS Appl. Mater. Interfaces, 2016, 8, 4851–4861 CrossRef CAS PubMed.
- M. S. Dresselhaus, A. Jorio, M. Hofmann, G. Dresselhaus and R. Saito, Nano Lett., 2010, 10, 751–758 CrossRef CAS PubMed.
- S. Zhang, K. Dokko and M. Watanabe, Chem. Mater., 2014, 26, 2915–2926 CrossRef CAS.
- F. Su, C. K. Poh, J. S. Chen, G. Xu, D. Wang, Q. Li, J. Lin and X. W. Lou, Energy Environ. Sci., 2011, 4, 717–724 RSC.
- R. Zhang, S. Huang and Y. Wang, Inorg. Chem.: Indian J., 2003, 48, 45–52 Search PubMed.
- E. V. Basiuk, V. A. Basiuk, J. G. Bañuelos, J. M. Saniger-Blesa, V. A. Pokrovskiy, T. Y. Gromovoy, A. V. Mischanchuk and B. G. Mischanchuk, J. Phys. Chem. B, 2002, 106, 1588–1597 CrossRef CAS.
- H. Estrade-Szwarckopf and B. Rousseau, J. Phys. Chem. Solids, 1992, 53, 419–436 CrossRef CAS.
- Q. Mahmood, W. S. Kim and H. S. Park, Nanoscale, 2012, 4, 7855–7860 RSC.
- R. Liang, H. Cao and D. Qian, Chem. Commun., 2011, 47, 10305–10307 RSC.
- L. Chen, L. J. Sun, F. Luan, Y. Liang, Y. Li and X. X. Liu, J. Power Sources, 2010, 195, 3742–3747 CrossRef CAS.
- X. Xia, Q. Hao, W. Lei, W. Wang, H. Wang and X. Wang, J. Mater. Chem., 2012, 22, 8314–8320 RSC.
- P. Iamprasertkun, A. Krittayavathananon, A. Seubsai, N. Chanlek, P. Kidkhunthod, W. Sangthong, S. Maensiri, R. Yimnirun, S. Nilmoung, P. Pannopard, S. Ittisanronnachai, K. Kongpatpanich, J. Limtrakul and M. Sawangphruk, Sci. Rep., 2016, 6, 1–12 CrossRef PubMed.
- C. Tanggarnjanavalukul, N. Phattharasupakun, K. Kongpatpanich and M. Sawangphruk, Nanoscale, 2017, 9, 13630–13639 RSC.
- P. Iamprasertkun, C. Tanggarnjanavalukul, A. Krittayavathananon, J. Khuntilo, N. Chanlek, P. Kidkhunthod and M. Sawangphruk, Electrochim. Acta, 2017, 249, 26–32 CrossRef CAS.
- I. Shakir, M. Shahid, S. Cherevko, C. H. Chung and D. J. Kang, Electrochim. Acta, 2011, 58, 76–80 CrossRef CAS.
- L. S. Aravinda, U. Bhat and B. Ramachandra Bhat, Electrochim. Acta, 2013, 112, 663–669 CrossRef CAS.
- F. N. I. Sari and J. M. Ting, ChemSusChem, 2018, 11, 897–906 CrossRef CAS PubMed.
- J. Li and X. Liu, Mater. Lett., 2013, 112, 39–42 CrossRef CAS.
- L. Zheng, Y. Xu, D. Jin and Y. Xie, Chem.–Asian J., 2011, 6, 1505–1514 CrossRef CAS PubMed.
- J. Xu, X. Gu, J. Cao, W. Wang and Z. Chen, J. Solid State Electrochem., 2012, 16, 2667–2674 CrossRef CAS.
- N. Chen, J. Zhou, G. Zhu, Q. Kang, H. Ji, Y. Zhang, X. Wang, L. Peng, X. Guo, C. Lu, J. Chen, X. Feng and W. Hou, Nanoscale, 2018, 10, 3709–3719 RSC.
- H. Peng, G. Ma, J. Mu, K. Sun and Z. Lei, J. Mater. Chem. A, 2014, 2, 10384–10388 RSC.
- F. Jiang, W. Li, R. Zou, Q. Liu, K. Xu, L. An and J. Hu, Nano Energy, 2014, 7, 72–79 CrossRef CAS.
- X. Cao, B. Zheng, W. Shi, J. Yang, Z. Fan, Z. Luo, X. Rui, B. Chen, Q. Yan and H. Zhang, Adv. Mater., 2015, 27, 4695–4701 CrossRef CAS PubMed.
- J. Noh, C. M. Yoon, Y. K. Kim and J. Jang, Carbon, 2017, 116, 470–478 CrossRef CAS.
- W. Tang, L. Liu, S. Tian, L. Li, Y. Yue, Y. Wu and K. Zhu, Chem. Commun., 2011, 47, 10058–10060 RSC.
- F. Barzegar, A. Bello, D. Y. Momodu, J. K. Dangbegnon, F. Taghizadeh, M. J. Madito, T. M. Masikhwa and N. Manyala, RSC Adv., 2015, 5, 37462–37468 RSC.
- Y. Liu, B. Zhang, Y. Yang, Z. Chang, Z. Wen and Y. Wu, J. Mater. Chem. A, 2013, 1, 13582–13587 RSC.
- Y. Liu, B. H. Zhang, S. Y. Xiao, L. L. Liu, Z. B. Wen and Y. P. Wu, Electrochim. Acta, 2014, 116, 512–517 CrossRef CAS.
- C. Yang, Y. Shi, N. Liu, J. Tao, S. Wang, W. Liu, Y. Wang, J. Su, L. Li, C. Yang and Y. Gao, RSC Adv., 2015, 5, 45129–45135 RSC.
- C. Xu, J. Liao, R. Wang, P. Zou, R. Wang, F. Kang and C. Yang, RSC Adv., 2016, 6, 110112–110119 RSC.
- P. Du, W. Wei, D. Liu, H. Kang, C. Liu and P. Liu, J. Mater. Sci., 2018, 53, 5255–5269 CrossRef CAS.
Footnote |
| † Electronic supplementary information (ESI) available. See DOI: 10.1039/c8se00454d |
| This journal is © The Royal Society of Chemistry 2018 |

