K-looping catalytic pyrolysis of unaltered and pelletized biomass for in situ tar reduction and porous carbon production†
Received
16th August 2018
, Accepted 29th September 2018
First published on 1st October 2018
Abstract
This paper studies the K-catalyzed pyrolysis of rice husk (RH) and its pelleted form (RHP) at a higher temperature (750 °C) for in situ tar reduction and porous carbon production. The mass ratio of KOH and biomass greatly affected the physicochemical property of bio-char. During carbonization with KOH, the in situ generated K2CO3 tailored the morphology and size of the self-templated SiO2, giving rise to RH-chars with open foam-like porous architecture enrich with micro- and meso-pores. KOH activation via this one-step pyrolysis could produce highly porous carbons (e.g., RH-char 1, RH-char 2, and RHP-char 1) with highly specific surface areas and high content of oxygen that have promising potential applications in energy storage and adsorption processes.
1. Introduction
The catalytic pyrolysis of biomass is an approach that is reliable for producing quality renewable fuels and chemical precursors. The bio-oil often contains high amounts of oxygenate fractions that reduce the fuel properties. Catalysts can upgrade the bio-oil via selected bond cleavage reactions including deoxygenation, cracking, decarbonylation and others. Usually, bulk and supported acid or base catalysts (e.g., ZSM-5) tailor the production of high-grade bio-oil in biomass pyrolysis at mediate-temperature.1,2 Various metal-based catalysts have been developed such as noble metals (e.g., Pt),3 and non-noble metals (e.g., Ni, Fe)4,5 for producing high-grade syngas (e.g., low tar yield, high H2 yield) during biomass pyrolysis at a relatively high temperature (>700 °C). Moreover, minerals such as alkali and alkaline-earth metals (AAEMs) have good catalytic performance for biomass pyrolysis.6–9 Significantly, pyrolysis vapours can be upgraded (e.g., tar/soot reduction).10–12Fig. 1 shows potassium (K)-looping catalysis during thermochemical conversion of biomass. K is a kind of AAEM that exists in nature (e.g., clays in soil), which is also a nutrient absorbed by plants.13 The presence/addition of K as a catalyst can improve the pyrolysis efficiency and upgrade the vapour. Furthermore, K in char enhances the gasification and activation of carbon to produce extra syngas or activated carbon.14,15 Embedded K in char can be used as a fertilizer as well.16
 |
| | Fig. 1 K-looping catalysis during thermochemical conversion (pyrolysis, gasification) of biomass. | |
In terms of porous carbon production, KOH has been widely developed for the chemical activation of bio-chars.17–19 The mechanism of KOH activation has been proposed as reactions (R1)–(R4).20 The KOH activation generally occurs at 700 °C. Therefore, the activated carbon was produced at 750 °C from RH-char.21
| | | 6KOH + 2C → 2K + 3H2 + 2K2CO3 | (R1) |
| | | K2CO3 + 2C → 2K (or K2O) + 3CO | (R3) |
Two-step synthesis has been extensively used for production of activated carbons.22 In the first step, the biomass is carbonized at relatively low temperatures (<500 °C) to produce bio-oil and bio-char. In the second step, the bio-char is activated through chemical (e.g., KOH) or physical (e.g., H2O) approaches at relatively high temperatures (>700 °C) to produce the activated carbons.23 However, the one-step synthesis of activated carbons has gained more attention by researchers.24,25 It was proven that catalytic pyrolysis of biomass with KOH could improve the decomposition efficiency and the product quality.26,27 Additionally, activated carbons from biomass via one-step synthesis can be used for gas purification28–30 and supercapacitors.31
Rice husk (RH) is a biowaste abundantly available in rice-producing countries.32 At present, combustion is a major disposal method used by grain-processing enterprises, therefore giving rise to considerable pollution.33 However, it is a lignin-rich biomass that can be converted to fuel (e.g., oil, syngas) via catalytic pyrolysis with non-noble metal catalysts.34,35 Additionally, Correa et al. found that high-quality activated carbons could be produced from the lignin-rich biomass via a two-step chemical activation with KOH.36 This paper aims to study the KOH-catalyzed pyrolysis of RH and RH-pellet (RHP), and the bio-chars are characterized in detail.
2. Materials and methods
2.1. Feedstocks and chemicals
RHs were collected from a grain-processing enterprise in Jiangsu province (China). RHPs were obtained from a biomass pellet production enterprise in Jiangsu province (China). The properties of the feedstocks such as proximate analysis, ultimate analysis and chemical composition are shown in Table 1. The bulk density of RHP was much higher than that of RH (approximately 6 times). The volatile matter and fixed carbon showed similar values. However, the ash content of RHP was lower than that of RH due to the ash loss,37 thus improving the fuel property of RH (e.g., heating value). All chemicals (e.g., KOH) used were of analytical purity and purchased from Sinopharm Group Chemical Reagent Co., Ltd (China).
Table 1 Properties of RH and RHP
|
|
RH |
RHP |
|
HHV (higher heating value) = 0.2949C + 0.825H.
By difference.
|
| Bulk density (kg m−3) |
99.6 |
600 |
| Particle size (mm) |
8 |
9 |
![[thin space (1/6-em)]](https://www.rsc.org/images/entities/char_2009.gif) |
|
Proximate analysis (wt%, as received)
|
| Moisture |
6.13 |
7.33 |
| Volatile matter (VM) |
58.17 |
62.85 |
| Fixed carbon (FC) |
19.81 |
20.42 |
| Ash |
15.89 |
9.40 |
![[thin space (1/6-em)]](https://www.rsc.org/images/entities/char_2009.gif) |
|
Ultimate analysis (wt%, dry and ash-free)
|
| Carbon |
36.99 |
38.13 |
| Hydrogen |
5.20 |
6.03 |
| Nitrogen |
0.32 |
0.66 |
| Sulfur |
0.2 |
0.1 |
| Oxygen |
35.27 |
45.68 |
| H/C |
1.69 |
1.90 |
| O/C |
0.72 |
0.90 |
| HHVa (MJ kg−1) |
15.2 |
16.2 |
![[thin space (1/6-em)]](https://www.rsc.org/images/entities/char_2009.gif) |
|
Ash composition (wt%, as received)
|
| SiO2 |
93.50 |
98.18 |
| Al2O3 |
0.18 |
0.20 |
| CaO |
0.36 |
0.13 |
| K2O |
1.20 |
0.10 |
| Na2O |
0.83 |
0.12 |
| MgO |
0.31 |
0.15 |
| Fe2O3 |
0.24 |
0.12 |
| P2O5 |
0.45 |
0.31 |
| SO3 |
0.52 |
0.24 |
| Otherb |
2.41 |
0.45 |
2.2. Biomass pyrolysis
The experimental setup for the pyrolysis process is mainly composed of four parts: the carrier gas system, pyrolysis reactor, cooling system and gas collection. Firstly, the feedstock of RH or RHP was blended with solid KOH by ball-milling with a speed rate of 1000 rpm (mass ratios of KOH and biomass: 1![[thin space (1/6-em)]](https://www.rsc.org/images/entities/char_2009.gif) :
:![[thin space (1/6-em)]](https://www.rsc.org/images/entities/char_2009.gif) 1, 2
1, 2![[thin space (1/6-em)]](https://www.rsc.org/images/entities/char_2009.gif) :
:![[thin space (1/6-em)]](https://www.rsc.org/images/entities/char_2009.gif) 1 and 3
1 and 3![[thin space (1/6-em)]](https://www.rsc.org/images/entities/char_2009.gif) :
:![[thin space (1/6-em)]](https://www.rsc.org/images/entities/char_2009.gif) 1). After that, the solid mixture was fed into the reactor. Before the pyrolysis process, the N2 gas (0.5 L min−1) was continuously introduced to the reactor for 30 min to remove the air. As the pyrolysis process started, the target temperature of the reactor was set as 750 °C with a heating rate of 20 °C min−1. The residence time was 2 h to ensure full pyrolysis at 750 °C. Finally, the products including tar, gas and char were collected separately. The char was treated with a washing process using distilled water to remove the residual alkali and salts. After vacuum filtration and drying (105 °C), the bio-chars, according to the mass ratio of KOH and biomass, were defined as RH-char, RH-char 1, RH-char 2, RH-char 3, RHP-char, RHP-char 1, RHP-char 2 and RHP-char 3.
1). After that, the solid mixture was fed into the reactor. Before the pyrolysis process, the N2 gas (0.5 L min−1) was continuously introduced to the reactor for 30 min to remove the air. As the pyrolysis process started, the target temperature of the reactor was set as 750 °C with a heating rate of 20 °C min−1. The residence time was 2 h to ensure full pyrolysis at 750 °C. Finally, the products including tar, gas and char were collected separately. The char was treated with a washing process using distilled water to remove the residual alkali and salts. After vacuum filtration and drying (105 °C), the bio-chars, according to the mass ratio of KOH and biomass, were defined as RH-char, RH-char 1, RH-char 2, RH-char 3, RHP-char, RHP-char 1, RHP-char 2 and RHP-char 3.
2.3. Analytical methods
2.3.1. Feedstock analysis.
The proximate analysis was performed with a thermogravimetric analyzer (TGA-4000, PerkinElmer, USA). 5 mg of the solid sample was placed in a ceramic crucible, which was heated from room temperature to 800 °C with a heating rate of 20 °C min−1 under N2 (100 mL min−1). Then the N2 gas was switched to air (100 mL min−1) to burnout the char. The ultimate analysis was performed with element analyzer (EA, VARIO EL III, Element, Germany). The chemical composition of ash was determined by X-ray fluorescence (XRF, Olympus Innovex X-5000, Canada). All tests were performed in triplicate and average results were used.
2.3.2. Bio-char characterization.
The specific surface area was determined using the Brunauer–Emmett–Teller (BET) method38 according to the N2-sorption isotherms at 77 K by a Micromeritics Gemini apparatus (ASAP 2020M + C, Micromeritics. Co., USA). The volume and surface area of the micro-pores were obtained using the Barrette–Joynere–Halenda (BJH) method.39 The surface microstructures were analyzed with a scanning electron microscope (SEM, SU1510, Hitachi, Japan). The surface functional groups were analyzed with an infrared spectrometer (IR, Avatar360, Nicolet, USA). In addition, the crystal structures were analyzed by X-ray diffraction (XRD-6100, Shimadzu, Japan).
3. Results and discussion
3.1. Mass fractions of pyrolytic products
The mass fractions of the pyrolytic products are shown in Fig. 2. The catalytic pyrolysis of RH with KOH could contribute to the reduction of tar and char, thus giving rise to the high-yield of syngas. In particular, the tar was completely reduced as the mass ratio of KOH and RHP was 1. Compared with RH, the catalytic pyrolysis of RHP could achieve a higher gas yield.
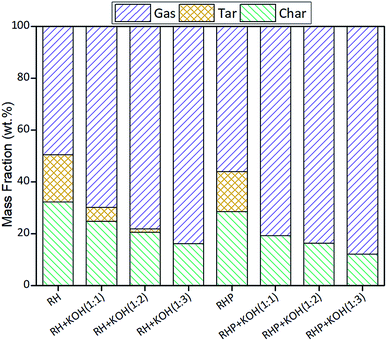 |
| | Fig. 2 Mass fractions of the pyrolytic products. | |
3.2. Proximate and ultimate analysis of the bio-chars
The bio-char is the main product from the slow pyrolysis of biomass. Table 2 shows the proximate and ultimate analysis of bio-chars from RH and RHP. The moisture of bio-char increased with increasing KOH due to the strong hydroscopic property. Small amounts of volatiles in the bio-chars indicate the complete pyrolysis. Moreover, the retained volatiles may present in the form of surface functional groups, which leads to the efficient adsorption performance.40 It was seen that the moderate KOH improved the formation of fixed carbon due to the graphitization of bio-char, which was associated with the increase of carbon content and well explained by the XRD analysis. The high content of carbon also indicated the purity of the RH bio-chars.
Table 2 Proximate and ultimate analysis of bio-chars
| Char sample |
Proximate analysis (wt%, as received) |
Ultimate analysis (wt%, dry and ash free) |
Atomic ratio |
| Moisture |
VM |
FC |
Ash |
C |
H |
N |
O |
H/C |
O/C |
| RH-char |
1.36 |
2.69 |
49.25 |
46.52 |
33.32 |
1.8 |
0.35 |
18.01 |
0.65 |
0.41 |
| RH-char 1 |
7.18 |
8.38 |
60.55 |
22.82 |
53.99 |
2.23 |
0.41 |
20.55 |
0.5 |
0.29 |
| RH-char 2 |
7.46 |
7.59 |
51.23 |
32.82 |
42.22 |
1.94 |
0.33 |
22.69 |
0.55 |
0.40 |
| RH-char 3 |
1.75 |
4.57 |
46.61 |
46.97 |
41.24 |
1.56 |
0.44 |
9.79 |
0.45 |
0.18 |
| RHP-char |
2.097 |
2.569 |
43.169 |
38.17 |
49.0 |
1.49 |
0.5 |
10.84 |
0.36 |
0.17 |
| RHP-char 1 |
2.04 |
5.236 |
59.274 |
33.29 |
49.76 |
1.61 |
0.3 |
15.04 |
0.39 |
0.23 |
| RHP-char 2 |
1.6 |
4.71 |
57.477 |
36.06 |
49.63 |
1.94 |
0.35 |
12.02 |
0.47 |
0.18 |
| RHP-char 3 |
8.842 |
5.708 |
63.39 |
21.38 |
54.76 |
2.02 |
0.72 |
21.12 |
0.44 |
0.29 |
To compare the variation in elemental composition, the atomic ratio of hydrogen to carbon (H/C) and oxygen to carbon (O/C) in the biomass and bio-char were plotted in a Van-krevelen diagram41 in Fig. 3, which provides general information on the quality and type of fuel.42 It implies that the mechanisms of dehydrogenation and deoxygenation43 in the pyrolysis are remarkable. The bio-chars exhibit low H/C and O/C ratios than the biomass. However, it was found that the H/C and O/C ratios of bio-chars were lower than those of coal, indicating that the ratio of reaction rate (i.e., decarboxylation to dehydration) is much lower in the slow-pyrolysis process.42
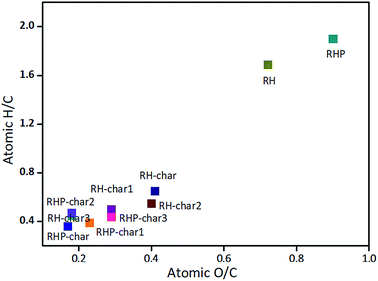 |
| | Fig. 3 Van-krevelen diagram of biomass and bio-char. | |
3.3. Morphological characterization
The photographs of RH and RHP before and after pyrolysis are shown in Fig. 4. The original morphologies of RH-char and RHP-char were kept without agglomeration during pyrolysis. However, the foaming phenomenon appeared via co-pyrolysis with KOH. So far, the one-step pyrolysis has been used for the synthesis of carbon foams from biomass.44–46 Compared to RH, RHP can foam dramatically via co-pyrolysis with KOH. On the one hand, RHP with higher bulk density and lower ash content instantaneously produces a mass of vapour via catalytic pyrolysis; on the other hand, the presence of additives (e.g., resin) as the blowing agent in RHP can promote foaming during pyrolysis. The RHP-char as a foaming core uniformly dispersed the blowing agent and improved the microstructure of the carbon foam. The foaming mechanism was described as implantation core foaming followed by the interfacial nucleation foaming,47 thus giving rise to uniform control of the size and distribution of foam cells as illustrated in the SEM micrographs. However, as the mass ratio of KOH and biomass increased to 3, agglomeration can occur, indicating that excess KOH is not beneficial for the synthesis of porous carbon via co-pyrolysis with biomass.
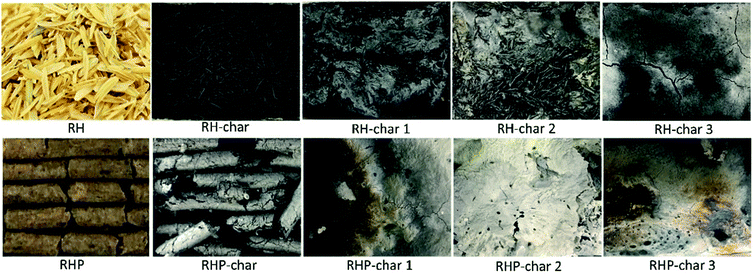 |
| | Fig. 4 Photographs of RH and RHP before and after pyrolysis. | |
SEM analysis can directly show the surface microstructures of the RH-chars. As shown in Fig. 5, the surface structures of the outer epidermis in RH is an organized corrugated structure – “vascular bundle structure”.48,49 Moreover, the fragment particles in the RH-chars were formed due to the pyrolysis of organic matter.50 The release of volatile compounds can lead to the formation of a coarse surface with less pores (e.g., the RH-char). After catalytic pyrolysis, the surface ridged-structure of bio-char is destroyed as KOH increases, contributing to the development of overlapped pores (e.g., RH-char 1 and RH-char 2). However, new macropores were formed due to the acute decomposition of bio-char with a higher amount of KOH (e.g., RH-char 3), thus leading to the decrease of SBET.
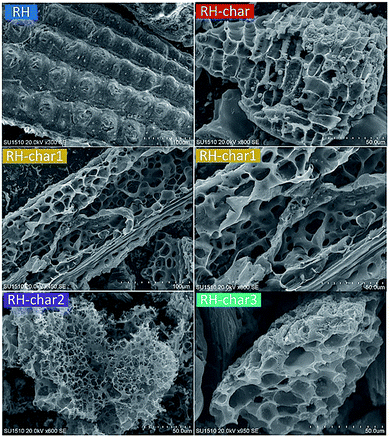 |
| | Fig. 5 SEM micrographs of RH and RH-chars. | |
Compared with RH, RHP shows a similar organized corrugated structure, but most show smooth microstructures (Fig. 6). This might be attributed to the pelleting process. After pyrolysis, the surface of the RHP-char becomes coarse due to devolatilization.51 Significantly, many ordered pores with hierarchical structure are developed via KOH activation. The porosity can be tailored by selecting an appropriate precursor (RH as a self-template of carbon-silica composite). During carbonization, the in situ generated K2CO3 can tailor the morphology and size of the nano-SiO2 template, thus giving rise to the RH-char with a foam-like porous structure with many micro- and meso-pores, e.g., hierarchical porous carbons (HPC) in RH-char 1 and RHP-char 1, which were developed via a redox reaction of (R3), and the reaction of (R5).52 The pore sizes in the outer surface became much larger, which is attributed to the pore development from outside to inside.53 Compared with the RH-chars, the RHP-chars show more ordered porous carbons. As the mass ratio of KOH and RHP is 3, many micro-pores distributed inside pore channels were formed due to acute KOH erosion.54
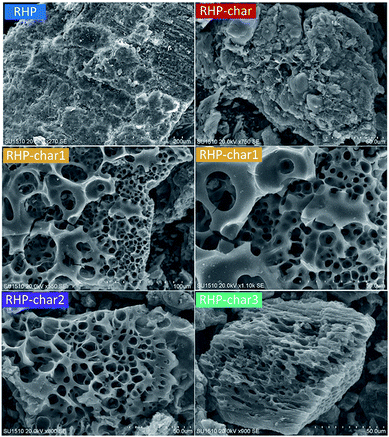 |
| | Fig. 6 SEM micrographs of RHP and RHP-chars. | |
The N2 sorption isotherms and the corresponding pore size distributions of RH-chars and RHP-chars are shown in Fig. S1 and S2.† In general, the char samples display isotherms of type I and IV according to IUPAC classification, which is attributed to the coexistence of micro- and meso-pores.55 The steep adsorption volume at a low relative pressure (below 0.1) can reflect the existence of micro-pores, while the sharp hysteresis loop in the P/P0 range of 0.45–0.90 indicates the existence of meso- or macro-pores.56 This indicates the hierarchical porous architecture of chars, such as RH-char 2, RHP-char 1, RHP-char 2 and RHP-char 3. In addition, the textural properties such as specific surface area (SBET) and porosity properties (e.g., pore volume) are shown in Table 3. It is seen that SBET was significantly increased by KOH activation. Generally, SBET increased with increasing mass ratio of KOH and biomass. RH-char and RHP-char had a lower SBET of 386 and 366 m2 g−1 without activation (Fig. S3†). However, the SBET of RH-char 3 decreased significantly due to the destruction of pore structures due to the acute decomposition of char with a higher amount of KOH.
Table 3 Textural properties of RH-chars
| Bio-char sample |
S
BET (m2 g−1) |
Porosity properties |
|
V
t
(cm3 g−1) |
V
micro
(cm3 g−1) |
V
meso
(cm3 g−1) |
V
micro/Vt (%) |
|
V
t: total pore volume (determined at relative pressure P/P0 = 0.98).
V
micro: micro-pore volume (determined by the t-plot method).
V
meso: meso-pore volume (the difference).
|
| RH-char |
386 |
0.19 |
0.16 |
0.03 |
84.2 |
| RH-char 1 |
1464 |
0.73 |
0.58 |
0.15 |
79.5 |
| RH-char 2 |
1773 |
0.88 |
0.56 |
0.32 |
63.6 |
| RH-char 3 |
696 |
0.35 |
0.19 |
0.16 |
54.3 |
| RHP-char |
366 |
0.18 |
0.15 |
0.03 |
83.3 |
| RHP-char 1 |
888 |
0.44 |
0.34 |
0.10 |
77.3 |
| RHP-char 2 |
954 |
0.47 |
0.32 |
0.15 |
68.1 |
| RHP-char 3 |
1347 |
0.68 |
0.48 |
0.20 |
70.6 |
We propose the mechanism for pore development in activated bio-chars via catalytic pyrolysis of biomass with KOH. On the one hand, the moderate conditions (e.g., mass ratio of KOH and biomass) benefit the development of pore structures.57 The formation rate of micro-pores was greater than the disappearance rate, thus contributing to the increase of SBET. As the formation and deformation rates were equal, the pore development could achieve a state of dynamic equilibrium with the maximum SBET.53 On the other hand, the extreme conditions could accelerate the micro-pore widening.58 In this work, the SiO2-rich RH is an effective self-template and can be fabricated into the HPC via one-step pyrolysis. Well-dispersed intrinsic SiO2 acts as a built-in bio-template to form large numbers of meso-pores, while the chemical activation with KOH produces plenty of micro-pores (as shown in Fig. S4†). Furthermore, the micro-pores can be destroyed via collapsing or developing into the meso- and macro-pores (Table 3), especially meso-pores giving rise to a hierarchical porous architecture. The formed HPC with a higher SBET had a reasonable meso-pore ratio and high oxygen content, which could allow the fast transport of ions, highly accessible surface area, and additional pseudocapacitive behavior for supercapacitors. It also exhibited high CO2 capture capacities.59
3.4. XRD analysis
The XRD patterns of the bio-chars are shown in Fig. 7. A significant peak appearing at 22.2° in RH is a typical silica characteristic corresponding to the cristobalite.53 After pyrolysis, the diffraction peak is common in RH-char due to devolatilization of RH. The peak at 22.2° representing the amorphous SiO2 almost disappeared, while the peaks at 28° and 34° representing K2SiO3 in RH-char 2 and RH-char 3 appeared, indicating the ash removal via KOH/K2CO3 reacting with SiO2 ((R6) and (R7)). SiO2 in the RH could also be easily extracted.60 Besides, the insignificant peak at 44.3° indicates the formation of amorphous carbon (e.g., graphite) with a turbostratic structure.61,62 Compared with the RHP-char 3, the RH-char 1 shows a similar XRD pattern, which is relevant to the contents of fixed carbon and ash.| | | 2KOH + SiO2 → K2SiO3 + H2O | (R6) |
| | | K2CO3 + SiO2 → K2SiO3 + CO2 | (R7) |
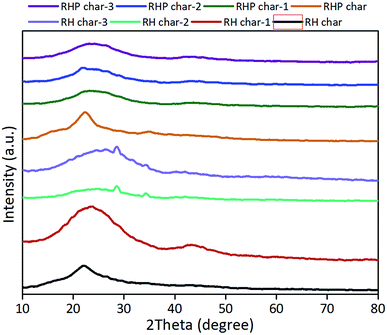 |
| | Fig. 7 XRD patterns of bio-chars derived from RH and RHP. | |
3.5. IR analysis
The IR spectra of feedstocks and bio-chars are shown in Fig. 8. It was found that a wide band appears at 3420 cm−1 indicating the O–H stretching vibration of hydroxyl groups due to the water molecules in the matrices of biomass and bio-char.63 The intense band at 2922 cm−1 represents the stretching vibrations of the C–H bonds in alkanes, and carbon was bonded with hydrogen bonds.46 The band at 2292 cm−1 represents the vibration in alkanes and alkyl groups, while the band at 1583 cm−1 represents the vibration in the aromatic groups. The peaks (e.g., 1560 cm−1) in the region of 1500–1600 cm−1 indicate the C![[double bond, length as m-dash]](https://www.rsc.org/images/entities/char_e001.gif) C bonds of the aromatic compounds. A weak intense band at 1083 cm−1 represents the ν(C–O) stretching vibration of the bonds in esters, ether or the phenolic groups. A weak band at 777 cm−1 represents the γ(C–H) vibration in the benzene derivative. The band at around 670 cm−1 was assigned to the bending vibration of the C–H bonds.64 These peaks disappeared, indicating the decomposition of organic matter during the pyrolysis of RH and RHP. Particularly, the band at around 2292 cm−1 in RH-char 3 which represents the stretching vibrations of C–H bonds in alkanes and carbons bonded with hydrogen bonds disappeared, indicating acute destruction of the surface functional groups of bio-char due to excessive KOH. The weak bands at around 2800–2900 cm−1 indicate the stretching vibrations of the C–H bonds in the methylene groups (–CH2–)65 not in RH-char and RHP-char, since the C–H bonds were decomposed to form the aromatic C
C bonds of the aromatic compounds. A weak intense band at 1083 cm−1 represents the ν(C–O) stretching vibration of the bonds in esters, ether or the phenolic groups. A weak band at 777 cm−1 represents the γ(C–H) vibration in the benzene derivative. The band at around 670 cm−1 was assigned to the bending vibration of the C–H bonds.64 These peaks disappeared, indicating the decomposition of organic matter during the pyrolysis of RH and RHP. Particularly, the band at around 2292 cm−1 in RH-char 3 which represents the stretching vibrations of C–H bonds in alkanes and carbons bonded with hydrogen bonds disappeared, indicating acute destruction of the surface functional groups of bio-char due to excessive KOH. The weak bands at around 2800–2900 cm−1 indicate the stretching vibrations of the C–H bonds in the methylene groups (–CH2–)65 not in RH-char and RHP-char, since the C–H bonds were decomposed to form the aromatic C![[double bond, length as m-dash]](https://www.rsc.org/images/entities/char_e001.gif) C bonds at a higher activation temperature.66,67 Besides, three significant peaks shouldered at 1074, 796, and 466 cm−1 were ascribed to the Si–O bonds in RH and RH-char.57 After pyrolysis with KOH (e.g., RHP-char 3), the characteristic peak of the Si–O–Si bond was eliminated (Fig. S5†), possibly caused by the removal of SiO2.68
C bonds at a higher activation temperature.66,67 Besides, three significant peaks shouldered at 1074, 796, and 466 cm−1 were ascribed to the Si–O bonds in RH and RH-char.57 After pyrolysis with KOH (e.g., RHP-char 3), the characteristic peak of the Si–O–Si bond was eliminated (Fig. S5†), possibly caused by the removal of SiO2.68
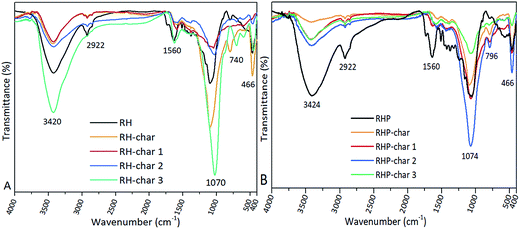 |
| | Fig. 8 IR spectra of biomass and bio-char derived from RH (A) and RHP (B). | |
4. Conclusions
Hierarchically porous carbons production and in situ tar reduction were achieved by the catalytic pyrolysis of RH and RHP with KOH at 750 °C. The mass ratio of KOH and biomass significantly influenced the properties of the bio-char. During carbonization with KOH, the in situ generated K2CO3 can tailor the morphology and size of the nano-SiO2 self-template, therefore giving rise to the chars with meso-microporous architectures. In general, catalytic pyrolysis with KOH can produce highly porous carbons (e.g., RH-char 1, RH-char 2, and RHP-char 1). Particularly, the RH-char 1 with high SBET and high content of oxygen is available for adsorption and energy storage, which will be studied in future work.
Conflicts of interest
There are no conflicts to declare.
Acknowledgements
Support from the Startup Foundation for Introducing Talent of NUIST (Grant 2243141501046), the National Natural Science Foundation of China (Grant 21607079), and the Natural Science Foundation of the Jiangsu Higher Education Institutions of China (Grant 16KJB610012) is greatly appreciated.
References
- G. Kabir and B. H. Hameed, Renewable Sustainable Energy Rev., 2017, 70, 945–967 CrossRef CAS.
- C. A. Mullen, P. C. Tarves and A. A. Boateng, ACS Sustainable Chem. Eng., 2017, 5, 2154–2162 CrossRef CAS.
- Y. Shen and K. Yoshikawa, Renewable Sustainable Energy Rev., 2013, 21, 371–392 CrossRef CAS.
- Y. Shen, P. Zhao and Q. Shao, Microporous Mesoporous Mater., 2014, 188, 46–76 CrossRef CAS.
- X. Xu, Z. Li, R. Tu, Y. Sun and E. Jiang, ACS Sustainable Chem. Eng., 2018, 6(7), 8325–8339 CrossRef CAS.
- S. Hu, L. Jiang, Y. Wang, S. Su, L. Sun, B. Xu, L. He and J. Xiang, Bioresour. Technol., 2015, 192, 23–30 CrossRef CAS PubMed.
- S. Xing, H. Yuan, Huhetaoli, Y. Qi, P. Lv, Z. Yuan and Y. Chen, Energy, 2016, 114, 634–646 CrossRef CAS.
- K. Wang, J. Zhang, B. H. Shanks and R. C. Brown, Appl. Energy, 2015, 148, 115–120 CrossRef CAS.
- F. Guo, Y. Liu, Y. Wang, X. Li, T. Li and C. Guo, Energy Convers. Manage., 2016, 130, 184–191 CrossRef CAS.
- R. S. Postma, S. R. A. Kersten and G. van Rossum, Ind. Eng. Chem. Res., 2016, 55(26), 7226–7230 CrossRef CAS.
- K. Umeki, G. Häggström, A. Bach-Oller, K. Kirtania and E. Furusjö, Energy Fuels, 2017, 31, 5104–5110 CrossRef CAS.
- A. Trubetskaya, F. H. Larsen, A. Shchukarev, K. Ståhl and K. Umeki, Fuel, 2018, 225, 89–94 CrossRef CAS.
- I. Binner, S. Duttz, M. Schellhorn and M. K. Schenk, Appl. Clay Sci., 2017, 145, 28–36 CrossRef CAS.
- M. Perander, N. DeMartini, A. Brink, J. Kramb, O. Karlström and J. Hemming, Fuel, 2015, 150, 464–472 CrossRef CAS.
- Y. Shen, D. Ma and X. Ge, Sustainable Energy Fuels, 2017, 1, 1700–1729 RSC.
- Z. Tan, L. Liu, L. Zhang and Q. Huang, Sci. Total Environ., 2017, 599–600, 207–216 CrossRef CAS PubMed.
- J. Wang and S. Kaskel, J. Mater. Chem., 2012, 22, 23710–23725 RSC.
- K. Yang, L. Zhu, J. Yang and D. Lin, Sci. Total Environ., 2018, 618, 1677–1684 CrossRef CAS PubMed.
- D.-W. Lee, M.-H. Jin, D. Oh, S.-W. Lee and J.-S. Park, ACS Sustainable Chem. Eng., 2017, 5, 9935–9944 CrossRef CAS.
- T. Otowa, R. Tanibata and M. Itoh, Gas Sep. Purif., 1993, 7, 241–245 CrossRef CAS.
- H. Nam, S. Wang and H.-R. Jeong, Fuel, 2018, 213, 186–194 CrossRef CAS.
- A. Zubrik, M. Matik, S. Hredzák, M. Lovás, Z. Danková, M. Kováčová and J. Briančin, J. Cleaner Prod., 2017, 143, 643–653 CrossRef CAS.
- M. A. Yahya, Z. Al-Qodah and C. W. Z. Nagh, Renewable Sustainable Energy Rev., 2015, 46, 218–235 CrossRef CAS.
- J. Liu, Y. Deng, X. Li and L. Wang, ACS Sustainable Chem. Eng., 2016, 4, 177–187 CrossRef CAS.
- W. Tian, H. Zhang, H. Sun, M. O. Tade and S. Wang, Chem. Eng. J., 2018, 347, 432–439 CrossRef CAS.
- M. H. Shah, L. Deng, H. Bennadji and E. M. Fisher, Energy Fuels, 2015, 29(11), 7350–7357 CrossRef CAS.
- C. Di Blasi, C. Branca and A. Galgano, Energy Fuels, 2017, 31, 6154–6162 CrossRef CAS.
- G. Singh, I. Y. Kim, K. S. Lakhi, P. Srivastava, R. Naidu and A. Vinu, Carbon, 2017, 116, 448–455 CrossRef CAS.
- N. Balahmar, A. S. Al-Jumialy and R. Mokaya, J. Mater. Chem. A, 2017, 5, 12330–12339 RSC.
- D. Saha, B. Taylor, N. Alexander, D. F. Joyce, G. I. Faux, Y. Lin, V. Shteyn and G. Orkoulas, Bioresour. Technol., 2018, 256, 232–240 CrossRef CAS PubMed.
- K. Zou, Y. Deng, J. Chen, Y. Qian, Y. Yang, Y. Li and G. Chen, J. Power Sources, 2018, 378, 579–588 CrossRef CAS.
- J. Alvarez, G. Lopez, M. Amutio, J. Bilbao and M. Olazar, Bioresour. Technol., 2014, 170, 132–137 CrossRef CAS PubMed.
- H. Yang, B. Liu, Y. Chen, B. Li and H. Chen, Energy Fuels, 2015, 29, 151 Search PubMed.
- Y. Shen, M. Chen, T. Sun and J. Jia, Fuel, 2015, 159, 570–579 CrossRef CAS.
- D. Feng, Y. Zhang, Y. Zhao and S. Sun, Energy, 2018, 152, 166–177 CrossRef CAS.
- C. R. Correa, M. Stollovsky, T. Hehr, Y. Rauscher, B. Rolli and A. Kruse, ACS Sustainable Chem. Eng., 2017, 5, 8222–8233 CrossRef.
- Q. N. Nguyen, A. Cloutier, T. Stevanovic and A. Achim, Biomass Bioenergy, 2017, 98, 206–213 CrossRef CAS.
- S. Brunauer, P. H. Emmett and E. Teller, J. Am. Chem. Soc., 1938, 60, 309–319 CrossRef CAS.
- Y. Fan, X. Yang, B. Zhu, P. F. Liu and H. T. Lu, J. Power Sources, 2014, 268, 584–590 CrossRef CAS.
- M. Vithanage, S. S. Mayakaduwa, I. Herath, Y. S. Ok and D. Mohan, Chemosphere, 2016, 150, 781–789 CrossRef CAS PubMed.
- D. W. Van Krevelen, Fuel, 1950, 29, 269–284 CAS.
- H. S. Kambo and A. Dutta, Renewable Sustainable Energy Rev., 2015, 45, 359–378 CrossRef CAS.
- W.-H. Chen, S. C. Ye and H. K. Sheng, Bioresour. Technol., 2012, 118, 195–203 CrossRef CAS PubMed.
- Z. Fan, D. Qi, Y. Xiao, J. Yan and T. Wei, Mater. Lett., 2013, 101, 29–32 CrossRef CAS.
- C. Wang, M. J. O’Connell and C. K. Chan, ACS Appl. Mater. Interfaces, 2015, 7, 8952–8960 CrossRef CAS PubMed.
- M. A. Palazzolo, M.-A. Dourges, A. Magueresse, P. Glouannec, L. Maheo and H. Deleuze, ACS Sustainable Chem. Eng., 2018, 6, 2453–2461 CrossRef CAS.
- M. Li, C. Liu, H. Cao, H. Zhao, Y. Zhang and Z. Fan, J. Mater. Chem. A, 2014, 2, 14844–14851 RSC.
- Y. Shen, P. Zhao, Q. Shao, D. Ma, F. Takahashi and K. Yoshikawa, Appl. Catal., B, 2014, 152–153, 140–151 CrossRef CAS.
- Y. Shen, P. Zhao, Q. Shao, F. Takahashi and K. Yoshikawa, Appl. Energy, 2015, 160, 808–819 CrossRef CAS.
- Y. Shen, Renewable Sustainable Energy Rev., 2017, 80, 453–466 CrossRef.
- A. Trubetskaya, P. A. Jensen, A. D. Jensen, M. Steibel, H. Spliethoff, P. Glarborg and F. H. Larsen, Biomass Bioenergy, 2016, 86, 76–87 CrossRef CAS.
- M. Sevilla, G. A. Ferrero and A. B. Fuertes, Chem. Mater., 2017, 29(16), 6900–6907 CrossRef CAS.
- X. Song, Y. Zhang and C. Chang, Ind. Eng. Chem. Res., 2012, 51, 15075–15081 CrossRef CAS.
- K. Sun and J. C. Jiang, Biomass Bioenergy, 2010, 34, 539 CrossRef CAS.
- M. E. Casco, M. Martínez-Escandell, J. Silvestre-Albero and F. Rodríguez-Reinoso, Carbon, 2014, 67, 230–235 CrossRef CAS.
- Q. Shi, R. Zhang, Y. Lv, Y. Deng, A. A. Elzatahrya and D. Zhao, Carbon, 2015, 84, 335–346 CrossRef CAS.
- T. H. Liou and S. J. Wu, J. Hazard. Mater., 2009, 171, 693 CrossRef CAS PubMed.
- V. Fierro, G. Muñiz, A. H. Basta, H. El-Saied and A. Celzard, J. Hazard. Mater., 2010, 181, 27 CrossRef CAS PubMed.
- Z. Chen, H. Zhuo, Y. Hu, L. Zhong, X. Peng and S. Jing, et al., ACS Sustainable Chem. Eng., 2018, 6, 7138–7150 CrossRef CAS.
- J. A. S. Costa and C. M. Paranhos, J. Cleaner Prod., 2018, 192, 688–697 CrossRef.
- T. H. Liou, Chem. Eng. J., 2010, 158, 129 CrossRef CAS.
- P. Barpanda, G. Fanchini and G. G. Amatucci, Carbon, 2011, 49, 2538 CrossRef CAS.
- F. Adam and A. Iqbal, Chem. Eng. J., 2010, 160, 742–750 CrossRef CAS.
- Y. Chen, Y. Zhu, Z. Wang, Y. Li, L. Wang and L. Ding, et al., Adv. Colloid Interface Sci., 2011, 163, 39–52 CrossRef CAS PubMed.
- A. L. Cazetta, A. M. M. Vargas, E. M. Nogami, M. H. Kunita, M. R. Guilherme and A. C. Martins,
et al.
, Chem. Eng. J., 2011, 174, 117–125 CrossRef CAS.
- K. Zhu, H. Fu, J. Zhang, X. Lv, J. Tang and X. Xu, Biomass Bioenergy, 2012, 43, 18–25 CrossRef CAS.
- L. Muniandy, F. Adam, A. R. Mohamed and E.-P. Ng, Microporous Mesoporous Mater., 2014, 197, 316–323 CrossRef CAS.
- H. Huang, J. Tang, K. Gao, R. He, H. Zhao and D. Werner, RSC Adv., 2017, 7, 14640–14648 RSC.
Footnote |
| † Electronic supplementary information (ESI) available. See DOI: 10.1039/c8se00419f |
|
| This journal is © The Royal Society of Chemistry 2018 |
Click here to see how this site uses Cookies. View our privacy policy here.  *
*
![[thin space (1/6-em)]](https://www.rsc.org/images/entities/char_2009.gif)
![[thin space (1/6-em)]](https://www.rsc.org/images/entities/char_2009.gif)
![[thin space (1/6-em)]](https://www.rsc.org/images/entities/char_2009.gif)
![[thin space (1/6-em)]](https://www.rsc.org/images/entities/char_2009.gif) :
:![[thin space (1/6-em)]](https://www.rsc.org/images/entities/char_2009.gif) 1, 2
1, 2![[thin space (1/6-em)]](https://www.rsc.org/images/entities/char_2009.gif) :
:![[thin space (1/6-em)]](https://www.rsc.org/images/entities/char_2009.gif) 1 and 3
1 and 3![[thin space (1/6-em)]](https://www.rsc.org/images/entities/char_2009.gif) :
:![[thin space (1/6-em)]](https://www.rsc.org/images/entities/char_2009.gif) 1). After that, the solid mixture was fed into the reactor. Before the pyrolysis process, the N2 gas (0.5 L min−1) was continuously introduced to the reactor for 30 min to remove the air. As the pyrolysis process started, the target temperature of the reactor was set as 750 °C with a heating rate of 20 °C min−1. The residence time was 2 h to ensure full pyrolysis at 750 °C. Finally, the products including tar, gas and char were collected separately. The char was treated with a washing process using distilled water to remove the residual alkali and salts. After vacuum filtration and drying (105 °C), the bio-chars, according to the mass ratio of KOH and biomass, were defined as RH-char, RH-char 1, RH-char 2, RH-char 3, RHP-char, RHP-char 1, RHP-char 2 and RHP-char 3.
1). After that, the solid mixture was fed into the reactor. Before the pyrolysis process, the N2 gas (0.5 L min−1) was continuously introduced to the reactor for 30 min to remove the air. As the pyrolysis process started, the target temperature of the reactor was set as 750 °C with a heating rate of 20 °C min−1. The residence time was 2 h to ensure full pyrolysis at 750 °C. Finally, the products including tar, gas and char were collected separately. The char was treated with a washing process using distilled water to remove the residual alkali and salts. After vacuum filtration and drying (105 °C), the bio-chars, according to the mass ratio of KOH and biomass, were defined as RH-char, RH-char 1, RH-char 2, RH-char 3, RHP-char, RHP-char 1, RHP-char 2 and RHP-char 3.
![[double bond, length as m-dash]](https://www.rsc.org/images/entities/char_e001.gif) C bonds of the aromatic compounds. A weak intense band at 1083 cm−1 represents the ν(C–O) stretching vibration of the bonds in esters, ether or the phenolic groups. A weak band at 777 cm−1 represents the γ(C–H) vibration in the benzene derivative. The band at around 670 cm−1 was assigned to the bending vibration of the C–H bonds.64 These peaks disappeared, indicating the decomposition of organic matter during the pyrolysis of RH and RHP. Particularly, the band at around 2292 cm−1 in RH-char 3 which represents the stretching vibrations of C–H bonds in alkanes and carbons bonded with hydrogen bonds disappeared, indicating acute destruction of the surface functional groups of bio-char due to excessive KOH. The weak bands at around 2800–2900 cm−1 indicate the stretching vibrations of the C–H bonds in the methylene groups (–CH2–)65 not in RH-char and RHP-char, since the C–H bonds were decomposed to form the aromatic C
C bonds of the aromatic compounds. A weak intense band at 1083 cm−1 represents the ν(C–O) stretching vibration of the bonds in esters, ether or the phenolic groups. A weak band at 777 cm−1 represents the γ(C–H) vibration in the benzene derivative. The band at around 670 cm−1 was assigned to the bending vibration of the C–H bonds.64 These peaks disappeared, indicating the decomposition of organic matter during the pyrolysis of RH and RHP. Particularly, the band at around 2292 cm−1 in RH-char 3 which represents the stretching vibrations of C–H bonds in alkanes and carbons bonded with hydrogen bonds disappeared, indicating acute destruction of the surface functional groups of bio-char due to excessive KOH. The weak bands at around 2800–2900 cm−1 indicate the stretching vibrations of the C–H bonds in the methylene groups (–CH2–)65 not in RH-char and RHP-char, since the C–H bonds were decomposed to form the aromatic C![[double bond, length as m-dash]](https://www.rsc.org/images/entities/char_e001.gif) C bonds at a higher activation temperature.66,67 Besides, three significant peaks shouldered at 1074, 796, and 466 cm−1 were ascribed to the Si–O bonds in RH and RH-char.57 After pyrolysis with KOH (e.g., RHP-char 3), the characteristic peak of the Si–O–Si bond was eliminated (Fig. S5†), possibly caused by the removal of SiO2.68
C bonds at a higher activation temperature.66,67 Besides, three significant peaks shouldered at 1074, 796, and 466 cm−1 were ascribed to the Si–O bonds in RH and RH-char.57 After pyrolysis with KOH (e.g., RHP-char 3), the characteristic peak of the Si–O–Si bond was eliminated (Fig. S5†), possibly caused by the removal of SiO2.68


