Poly(ethylene glycol) (PEG)-modified epoxy phase-change polymer with dual properties of thermal storage and vibration damping
Swati
Sundararajan
 a,
Amit
Kumar
a,
Bikash C.
Chakraborty
b,
Asit B.
Samui
a,
Amit
Kumar
a,
Bikash C.
Chakraborty
b,
Asit B.
Samui
 *a and
Prashant S.
Kulkarni
 *a
*a
aEnergy and Environment Laboratory, Department of Applied Chemistry, Defence Institute of Advanced Technology, Deemed University, Girinagar, Pune-411 025, India
bNaval Materials Research Laboratory, Shil-Badlapur Road, MIDC Area, Ambernath (E), Maharashtra 421506, India. E-mail: ps_kulkarni@rediffmail.com; absamui@gmail.com; Fax: +91 20 2691533; Tel: +91 20 24304161
First published on 12th January 2018
Abstract
A novel cross-linked self-sustaining film was prepared by reaction of carboxyl-capped poly(ethylene glycol) (PEG) with epoxy resin, followed by incorporation of the prepared material (named modified epoxy, ME) into an epoxy matrix. Self-sustaining films were obtained with up to 60 wt% ME in the epoxy matrix. Fourier-transform infrared spectroscopy (FTIR) and 13C nuclear magnetic resonance (NMR) were used for chemical characterization of the samples. Differential scanning calorimetry (DSC) study exhibited maximum enthalpy for PCM film reaching up to 41 J g−1. The X-ray diffraction (XRD) and polarized optical microscopy (POM) indicated lesser degree of crystallinity of PEG segments due to constriction by crosslinked epoxy resin. Dynamic mechanical analysis (DMA) results indicate that the blend of epoxy and ME is compatible up to 30 wt% ME and there is distinct phase separation beyond this composition.
1. Introduction
It is widely understood that non-renewable sources of energy are being continually depleted. This has prompted development of a large number of renewable energy sources such as hydro-energy, wind energy, solar cells, fuel cells, dielectric actuators etc. However, efforts to develop the concept of energy-saving are also important. This can be done by adopting methods such as economized consumption, economic designs etc. Optimal energy management is the order of the day as the climate around the globe is becoming warmer and energy costs are also constantly increasing.1 Further, eco-friendly technologies are always preferred. Under these circumstances, ‘thermal energy storage’ is a promising and practical energy storage technique which should be further explored. This technique may offer direct outcomes in many areas of daily life, such as easy thermal comfort and economy in industrial processes.2Thermal energy can be stored in a material as sensible heat, latent heat and thermochemical energy etc., and may be a combination of more than one. Latent heat storage is considered the most convenient and efficient method for this purpose. Phase-change materials (PCMs) have the further advantages of high heat-storage ability, thermal stability and easily controlled phase-change processes.3 Their common application areas include solar energy storage, smart buildings, agricultural greenhouses, temperature-regulating textiles, heat management in electronic instruments/compartments, telecommunications, systems for delivering biomedical and biological samples, and so on.4–6 Another series of materials, hydrogels, have several properties that qualify them as smart phase change materials. A bioinspired sweating-like action based on thermoresponsive hydrogels (PNIPAM) has been realized, in which the hydrogels press out their stored water when a minimum critical solution temperature is reached.7 The surface temperature reduces by 15 °C as compared to that of a conventional hydrogel (pHEMA). Further, PCM materials have recently been rediscovered in other contexts and applied to a broad range of technologies, such as smart drug delivery, information storage, bar coding, and detection.8
Because of increasing interest in these materials, combined with understanding of their potential, a large number of organic, inorganic, polymeric, and eutectic PCMs have been designed with respective advantages.9–12 In respect of phase change, the solid–liquid PCMs (SLPCM) and solid–solid PCMs (SSPCM) are the two groups which have been actively researched in recent times. When storing thermal energy in latent heat form, the former group needs a suitable container and the latter does not.10,13,14 The latter can be used as a stand-alone matrix or adopt any desired shape and does not pose any environmental problem during use. The only disadvantage of these materials is the lower latent heat as compared to the corresponding solid–liquid PCMs.
The SSPCMs are fabricated by chemical grafting, based on a crosslinking reaction between the non-PCM solid frameworks as the hard segment and PCMs as the soft segment in the polymer. Poly(ethylene glycol) (PEG) is a well-defined macromolecule having properties such as large latent heat, non-toxicity, good biocompatibility, biodegradability, hydrophilicity, and chemical reactivity of free hydroxyl groups at the chain ends. PEG can be grafted on polystyrene via bromine-grafted polystyrene chains.10 The synthesized SSPCMs exhibit solid–solid phase transition temperatures in the range of 55–58 °C and high latent heat enthalpy in the range of 116–174 J g−1. Other reported PEG-based copolymers are cellulose-graft-poly(ethylene oxide),15 cross linked PEG/MDI/PE,16 polyurethane-graft-PEG,14 cellulose diacetate-graft-PEG,17,18 poly(vinyl alcohol)-graft-PEG19 and polyethylene terephthalate–PEG,20etc. Epoxy resin has been utilized in the preparation of solid–solid phase change materials by Chen et al. wherein the carboxyl groups of modified PEG were reacted with poly(glycidyl methacrylate).21 In another study by Fang and co-workers, a PEG-epoxy composite was prepared as a form-stable blend with latent enthalpy reaching 132 J g−1.22
Thin metal parts and structures easily undergo structural vibration when impacted, or when affected by natural resonance when acoustic energy creates excitation. These vibrating or resonating metals usually create structural vibration problems in industrial and commercial environments and also in underwater warfare. These structural vibrational problems can be easily solved by applying a damping material to these metal surfaces. Around the glass transition temperature or at a particular frequency, the polymers experience maximum segmental motion. The vibrational energy is utilized for the segmental motion and damping is the resultant outcome. The absorbed vibrational energy is converted into heat. For crystalline materials, crystalline melting occurs around the phase transition temperature. The molten segment does not flow away in the case of solid–solid phase transition. This phenomenon lowers the storage modulus,23 which in turn enhances tan![[thin space (1/6-em)]](https://www.rsc.org/images/entities/char_2009.gif) δ and consequently the loss factor. This indicates that solid–solid phase transition can function in the dual role of thermal storage and vibration damping. This dual role of thermal energy storage and vibration damping remains inherent in the system. It can be utilized as the application demands. The material can be designed as a film or tape, so that the resultant PCM can directly be used for thermal management without need of any further processing or any container.
δ and consequently the loss factor. This indicates that solid–solid phase transition can function in the dual role of thermal storage and vibration damping. This dual role of thermal energy storage and vibration damping remains inherent in the system. It can be utilized as the application demands. The material can be designed as a film or tape, so that the resultant PCM can directly be used for thermal management without need of any further processing or any container.
In this paper, PEG is introduced into an epoxy matrix via chemical reaction with the epoxy moiety. A free-standing film is prepared, and characterized for mechanical, thermal and damping properties.
2. Experimental
2.1 Materials
PEG (mol. wt 8000) was used after heat treatment at 100 °C for 2 h. Titanium isopropoxide, phenolphthalein indicator, pyridinium hydrochloride, pyridine, diglycidyl ether of bisphenol A (DGEBA) resin, with the commercial name Lapox L-12 (epoxide eq. 182–192, viscosity (25 °C) 9000–12![[thin space (1/6-em)]](https://www.rsc.org/images/entities/char_2009.gif) 000 mPa s), and Jeffamine D-400 polyetheramine (hardener) were used as received. Ethyl methyl ketone (butan-2-one), ethanol, toluene, chloroform, potassium hydroxide, triphenyl phosphine and maleic anhydride (MAn), all AR grade, were purified as per standard procedures.
000 mPa s), and Jeffamine D-400 polyetheramine (hardener) were used as received. Ethyl methyl ketone (butan-2-one), ethanol, toluene, chloroform, potassium hydroxide, triphenyl phosphine and maleic anhydride (MAn), all AR grade, were purified as per standard procedures.
2.2 Method
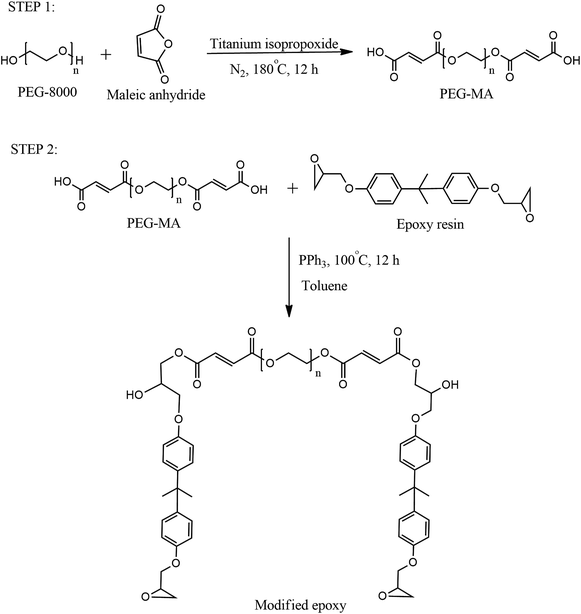
The phase-change material was incorporated in epoxy resin via two-step chemical reactions as depicted by Scheme 1.2.3 Characterization
| Acid value = (volume of KOH × normality of KOH)/weight of sample in g | (1) |
During heating, all epoxy rings present in the sample were opened up by pyridinium hydrochloride, and the amount of unreacted pyridinium hydrochloride was estimated by conducting back titration of the cooled mixture against ethanolic KOH (0.1 N) using phenolphthalein as an indicator. The epoxide equivalent of the sample was calculated as:
| Epoxy value = (volume of KOH × normality of KOH)/weight of sample in g | (2) |
3. Results and discussion
It is well known that the carboxyl group easily reacts with epoxy. If PEG is incorporated into a dicarboxylic acid molecule, the modified diacid can further react with epoxy resin to impart phase-change properties to the epoxy resin film. The acid value of the PEG and MA reaction product was calculated using eqn (1) and found to be 4031. The epoxy value of ME was calculated using eqn (2) and found to be 8012, suggesting the presence of epoxy groups, which are required for curing of epoxy resin.3.1 FTIR analysis
Fig. 1(a) shows the FTIR spectra of the reaction product of PEG with maleic anhydride and the product of reaction of acid with epoxy resin. PEG shows absorption peaks at 3455 cm−1 for –O–H stretching, 2869 cm−1 for –C–H stretching, 1461 cm−1 for –C–H bending and 1099 cm−1 for –C–O stretching. In the spectrum of the PEG–MA reaction product, a peak appears at 1723 cm−1, characteristic of carbonyl stretching vibration. The deconvolution of the peak at 1723 cm−1 was performed using origin and is presented in Fig. 1(b). The presence of 1721 and 1740 cm−1 peaks was observed for the carboxylic acid and ester groups, respectively. The peak appearing at 1643 cm−1 indicates the presence of alkene bonding. PCM epoxy film shows a broad hydroxyl peak at 3502 cm−1, carbonyl peak at 1725 cm−1, –C![[double bond, length as m-dash]](https://www.rsc.org/images/entities/char_e001.gif) C– peak at 1606 cm−1 and –C–O peak at 1098 cm−1. The peaks at 3057, 952 and 832 cm−1 correspond to –C–H stretching of the methylene group, –C–O– stretching and –C–O–C– stretching of the oxirane ring of epoxy resin respectively. This confirms that the modified epoxy resin has an oxirane ring, which can co-cure with epoxy resin.
C– peak at 1606 cm−1 and –C–O peak at 1098 cm−1. The peaks at 3057, 952 and 832 cm−1 correspond to –C–H stretching of the methylene group, –C–O– stretching and –C–O–C– stretching of the oxirane ring of epoxy resin respectively. This confirms that the modified epoxy resin has an oxirane ring, which can co-cure with epoxy resin.
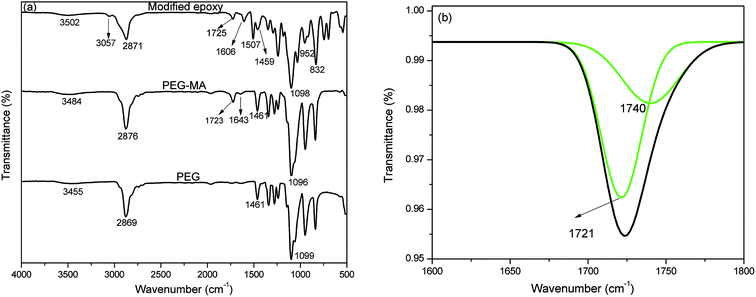 | ||
| Fig. 1 (a) FTIR spectra of PEG, PEG modified by maleic anhydride and ME and (b) deconvoluted peak of PEG–MA at 1700 cm−1. | ||
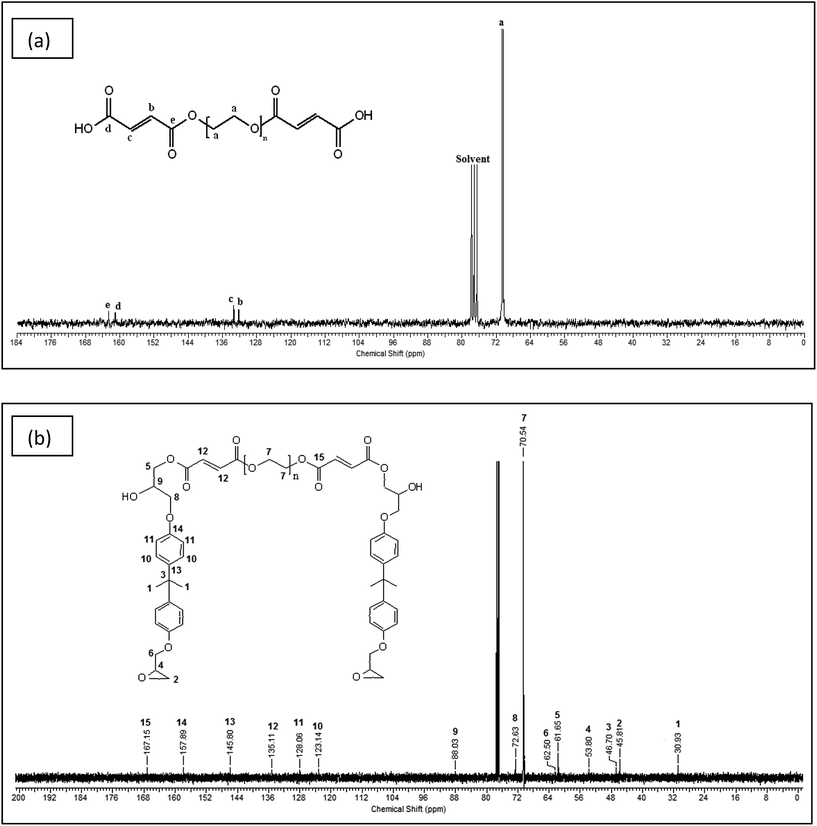
13C NMR of the PEG modified by maleic anhydride and modified epoxy was performed to determine the product formation and is shown in Fig. 2(a) and (b) respectively. The methylene groups of PEG show a peak at a chemical shift of 70.49 ppm in Fig. 2(a). The resonances at 132.33 and 133.24 ppm occur due to the presence of alkene double bonds. The signals at 161.04 and 162.53 ppm correspond to the carbonyl group of acid and the ester group respectively. In Fig. 2(b), the aromatic peaks of DGEBA are observed at 157.89, 145.80, 128.06 and 123.14 ppm, whereas the peaks of the oxirane group occur at 45.81 and 53.80 ppm. The carbonyl group is observed at 167.15 ppm and the alkene peak is observed at 135.11 ppm. The methylene carbons of PEG are seen at 70.54 ppm. The methylene carbon linking the epoxy chain to the dicarboxylic acid product is clearly visible at 61.65 ppm. The above information from the 13C NMR spectrum indicates the formation of both dicarboxylic acid and modified epoxy product.
3.2 Thermal properties
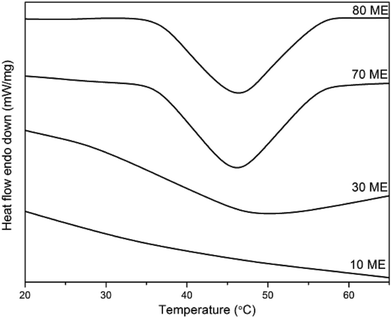
The DSC thermograms of PCM epoxy films with various percentages of modified epoxy are shown in Fig. 3 and the phase transition values are listed in Table 1. Pure PEG demonstrates a melting enthalpy of 190 J g−1 with a melting temperature of 63 °C. The fusion enthalpy and phase transition temperature of the PCM epoxy samples vary from 5–41 J g−1 and 35–46 °C respectively. The enthalpy values are much lower than that of pure PEG, due to the constriction of PEG molecules in the cross-linked matrix of epoxy film. The PEG chains must crystallize in normal fashion if the enthalpy is to retain its maximum value. However, the present system creates hindrance to orientation/reorientation of polymer chains, due to the formation of a blend matrix interconnected via crosslinks. The PEG chains are constricted at both ends and are surrounded by the crosslinked matrix, which minimizes the crystallization ability of the system. Thus the enthalpy drops to a very low value. Also, the phase-change (melting) temperature drops drastically from 63 to 35–46 °C. This occurs due to the restricted mobility of chain segments, which minimizes the number of chains stacked together. Under this situation, the segmental mobility is facilitated as compared to the case where large numbers of chains orient together, which would need higher energy for segmental motion.| Sample name | Fusion enthalpy (ΔHm, J g−1) | Melting temperature (Tm, °C) |
|---|---|---|
| PEG | 189.50 | 62.99 |
| 10 ME | 4.96 | 34.49 |
| 30 ME | 14.34 | 47.99 |
| 50 ME | 28.00 | 57.00 |
| 60 ME | 37.00 | 58.00 |
| 70 ME | 25.70 | 46.21 |
| 80 ME | 40.77 | 46.38 |
When the blend of ME and pure epoxy is co-cured together and the crosslinks are formed, the crystallization of PEG segments is impeded. This reduces the enthalpy drastically. However, with increasing ME concentration in the blend, there is a higher PEG content and greater possibility of crystallization. Thus, the increase of ME content increases both the enthalpy and melting temperature.24,25 Beyond 60 wt% ME there is a decreasing trend in both, which may be due to phase segregation. With 80 wt% ME, the soft PEG segments dominate heavily and the film loses its self-sustaining property. Due to the presence of high PEG concentration, the phase-change enthalpy was found to be highest for 80 wt% ME.
3.3 Crystallization studies using XRD and POM
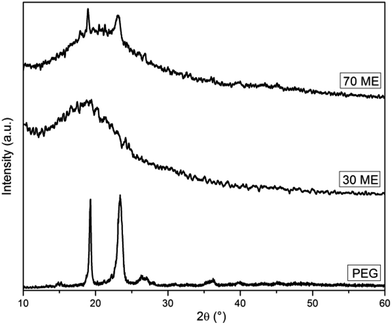
The diffraction patterns of PCM epoxy film are presented in Fig. 4. Pure epoxy is amorphous in nature exhibiting a broad peak at 20.26°.26 Pristine PEG, having a crystalline nature, shows well-defined diffraction peaks at 19.10°, 23.43° and 26.25°. The XRD pattern of PCM epoxy film with 70 wt% PEG displays peaks at 19.10°, 20.65° and 23.12°. At lower weight percentage of PEG, the epoxy peak is prominent and overshadows the diffraction peaks of PEG. As the PEG wt% is increased beyond 60%, the intensity of the peaks reduces and crystallinity of PEG improves, which is in agreement with the DSC results. The presence of an increasing number of PEG segments facilitates the orientation of chains, leading to higher crystallinity.27Fig. 5 shows POM images of PEG and PCM epoxy film. PEG shows cross-extinction patterns with spherulitic crystals. The POM images of PCM epoxy films indicate that the crystalline nature of PEG is preserved but the crystal size has reduced drastically due to the strong cross-linked network. In Fig. 5(b), the crystals disappear on heating (70 °C) above the phase transition temperature and liquid leakage does not take place, demonstrating solid–solid phase-change behaviour of the PCM epoxy film. In Fig. 5(c), the solidification process takes place on cooling, and PEG crystals are observed in Fig. 5(d), bound by the epoxy network.
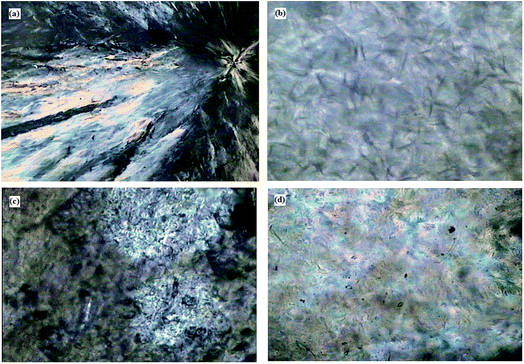 | ||
| Fig. 5 POM images of (a) PEG and 30 ME PCM film at (b) 70 °C, (c) 40 °C and (d) room temperature (33 °C) after crystallization. | ||
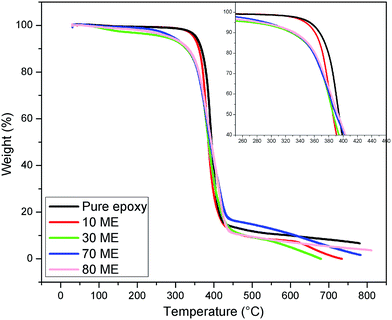
3.4 Thermal stability
The TGA curves of the modified epoxy films are illustrated in Fig. 6 and the degradation data has been summarized in Table 2. Pure epoxy was found to undergo degradation in the range of 369–431 °C. During thermal degradation, these films display single-stage decomposition with weight loss of the entire PCM epoxy network. With the 10 ME sample, there is a marginal decrease of the initial degradation temperature due to the introduction of soft PEG segments, which continues to decrease further on increasing the content of ME, with the associated increase of PEG segments. All these prepared PCM epoxy films show no degradation below 300 °C. With increasing PEG content in the epoxy matrix, the initial degradation temperature reduces, but all films were found to be stable below 300 °C. Based on the TGA results, it can be concluded that these PCMs show good thermal stability and can be utilized for various thermal energy storage applications.| Material name | Degradation interval (°C) | T max (°C) |
|---|---|---|
| 10 ME | 358.71–421.95 | 390 |
| 30 ME | 339.31–436.89 | 381 |
| 70 ME | 332.79–436.77 | 377 |
| 80 ME | 312.52–436.89 | 370 |
3.5 Morphology analysis
SEM images (Fig. 7) indicate uniform distribution of PCM within the epoxy matrix. PEG is well dispersed in all the modified epoxy films and it shows a river-like morphology. At low concentration of ME, the interface shows a smooth morphology. As the ME content is increased, there is greater distribution of PEG in the matrix. The epoxy matrix adds to the thermal and mechanical stability of the film, thereby acting as supporting material by restricting the movement of molten PEG.AFM micrographs of pure epoxy, 10 and 30 wt% ME-containing epoxy blends can be observed in Fig. 8. It is observed that pure epoxy maintains a mostly smooth morphology, with an average roughness of 1.692 nm. With 10 wt% ME addition, there is a drastic change in the morphology, which becomes very irregular with sudden peaks arising irregularly. In the 30 wt% ME-loaded sample, the morphology is mostly regular with big islands appearing, which may be due to crystallized PEG segments. The roughness value also increases greatly for the 10 wt% ME-containing sample and decreases for the 30 wt% ME-containing sample, having values of 12.022 nm and 4.939 nm respectively.
It is known that the viscoelastic nature is not the only mechanism for damping. Defects such as dislocations, phase boundaries, grain boundaries and various interfaces also contribute to damping.28 The defects are expected to move slightly and surfaces may slip with respect to one another during vibration, which results in dissipation of energy. Thus, the microstructure plays a vital role in affecting the damping characteristics of the material. In the present case, a single peak indicates complete miscibility. It can be observed in the FESEM and, particularly, AFM microstructures that the domains are finely distributed in the matrix. This ensures a large number of interfaces, which dissipates energy due to friction during application of vibration.29 Further, it can be observed that in pure epoxy the domain sizes are smaller, which ensures high damping (high tan![[thin space (1/6-em)]](https://www.rsc.org/images/entities/char_2009.gif) δ). With 10% ME addition, the domain size increases and agglomeration takes place. This lowers the tan
δ). With 10% ME addition, the domain size increases and agglomeration takes place. This lowers the tan![[thin space (1/6-em)]](https://www.rsc.org/images/entities/char_2009.gif) δ peak. With increasing ME to 30%, the domain size as well as agglomeration decreases. Thus, the tan
δ peak. With increasing ME to 30%, the domain size as well as agglomeration decreases. Thus, the tan![[thin space (1/6-em)]](https://www.rsc.org/images/entities/char_2009.gif) δ peak increases.
δ peak increases.
3.6 Dynamic mechanical analysis
The dynamic moduli and loss factor curves are shown in Fig. 9. It can be seen from the graphs that the pure epoxy-Jeffamine system and blends up to 30% ME have sharp glass transitions, while the 50% and 60% ME blends have a broad transition region with two diffuse peaks in each composition, indicating phase separation. Secondly, the loss tangent peak has shifted from 50 °C to about 36 °C for 10% ME and to 63.5 °C for the 30% ME blend. For the 50 and 60% ME blends, the diffuse peak ranges from approximately 32 °C to 67 °C. The lower shift of the loss peak could be due to soft segments of the modified PEG, which has a major amorphous content. The temperatures of maximum loss factor are almost identical to the melting point or phase-change point of the blends observed in the DSC results, except for the 10% ME blend, indicating that the loss spectra encompass the phase change. Table 3 lists the results of DMA experiments together with the compositions. The area under the loss tangent–temperature curve is given in the table to qualitatively compare the vibration damping or viscoelastic loss by the blends. It is seen that the pure epoxy composition and the blend of 30% ME showed the best damping properties compared to the others. As the proportion of ME is increased, two parameters vary in opposite directions. On one hand, the flexibility increases due to the existence of long PEG chains, together with the decrease in crosslink density. On the other hand, crystallization occurs, coupled with hydrogen bonding of PEG segments. The first effect acts in the direction of reducing the modulus, while the combination of the first and second effects increases the width of damping. A further explanation can be put forward that the PEG crystallites, along with the hydrogen bonding, shift the overall damping to higher temperature with a wider temperature range. The 30 ME sample shows optimum damping property, useful for practical application. As the ME content is increased the damping width is further widened. However, the crosslink density decreases so much that the response of the polymer network is too sluggish and its response to incoming frequency is weak, which leads to significant reduction in vibration damping.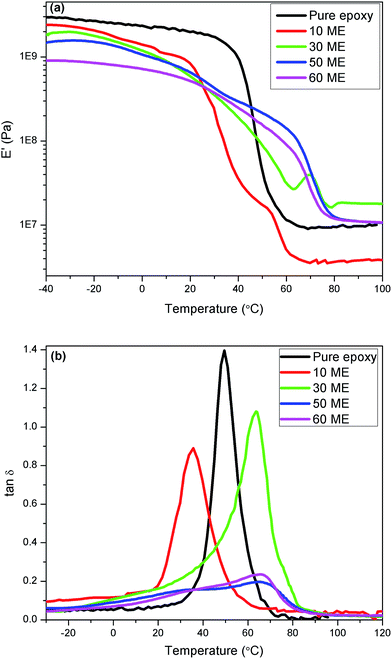 | ||
| Fig. 9 (a) Dynamic storage modulus and (b) viscoelastic loss factor of pure epoxy and modified epoxy networks. | ||
| DMA characteristics | % ME in the epoxy-ME blend | ||||
|---|---|---|---|---|---|
| 0 | 10 | 30 | 50 | 60 | |
| E′ at 30 °C, MPa | 1720 | 248 | 385 | 418 | 374 |
| α-Relaxation temperature, °C | 50 | 35.7 | 63.5 | 33.6 & 65.7 | 32 & 67 |
| Loss factor area, °C | 23.80 | 15.2 | 23.85 | 8.25 | 12 |
| Energy loss at α-relaxation, W m−3 | 187 | 134 | 104 | 78 | 45 |
A prominent effect of ME blending into the epoxy network is drastic reduction of the dynamic modulus upon incorporating ME. This could offer the advantage of higher shear deformation for the damping treatment of any rigid vibrating structure, for example, a constrained layer damping system. As such, the pure epoxy network is very hard, having a dynamic modulus of about 1.72 GPa as against 248–418 MPa for the blends at ambient temperature (30 °C), as can be seen from the modulus curves. The energy dissipation by the blends of different compositions are calculated by using eqn (3) (ref. 30) for the α-relaxation peak region at the experimental vibrational frequency of 1 Hz and strain of 0.05%.
| Ed = πfε2E′η watt m−3 | (3) |
The study of phase-change behaviour and dynamic mechanical analysis reveals that select blends, especially the 30% ME-containing epoxy-Jeffamine cured network, can have dual functionality, viz. heat absorber (for thermal energy storage) as well as a potential vibration damper in a broad temperature range. Further, the heat build-up due to vibration damping is far less than the phase-change enthalpy, which is as expected since damping is associated with a second-order transition (Tg) and phase change is a first-order transition (melting). In addition, heat produced due to vibration will be absorbed by the material during phase change so that degradation or thermal fatigue will be minimised. Thus, although the modulus is much lower than that of pure epoxy, it adds an additional property to the system. The modulus is within acceptable limits for acting as a film, while functioning as a vibration damping material and phase-change material as and when required.
4. Conclusions
PEG-modified epoxy resin was synthesized via sequential reactions with maleic anhydride followed by epoxy resin. The modified epoxy (ME) was blended and co-cured with pure epoxy to obtain a free-standing film. The melting point and enthalpy vary with ME (PEG content), drastically decreasing from pure PEG to 10 wt% ME-blended epoxy. With further increasing ME content, both values increase slowly. However, they remain much lower than pure PEG, due to the crosslinked network. The thermal stability is quite high, with the initial degradation temperature remaining at around 300 °C. Pure epoxy and the blend of 30% ME showed the best damping properties compared to the other compositions. Drastic reduction of the dynamic modulus was observed on incorporating ME. This could offer the advantage of higher shear deformation for the damping treatment of any rigid vibrating structure, for example, a constrained layer damping system.Conflicts of interest
There are no conflicts to declare.Acknowledgements
Swati Sundararajan greatly appreciates the fellowship provided by Defence Institute of Advanced Technology (DIAT), Pune. This work was supported by Defence Research and Development Organization (DRDO) via project grant (ERIP/ER/1003883/M/01/908/2012/D, R&D/1416, dated 28-3-2012), New Delhi, India.References
- IPCC: Climate Change 2014: Synthesis Report. Contribution of Working Groups I, II and III to the Fifth Assessment Report of the Intergovernmental Panel on Climate Change, ed. Core Writing Team, R. K. Pachauri and L. A. Meyer, Geneva, Switzerland, p. 151 Search PubMed.
- I. Bonadies, A. Izzo Renzi, M. Cocca, M. Avella, C. Carfagna and P. Persico, Ind. Eng. Chem. Res., 2015, 54, 9342–9350 CrossRef CAS.
- K. Pielichowska and K. Pielichowski, Prog. Mater. Sci., 2014, 65, 67–123 CrossRef CAS.
- Z. Liu, X. Fu, L. Jiang, B. Wu, J. Wang and J. Lei, Sol. Energy Mater. Sol. Cells, 2016, 147, 177–184 CrossRef CAS.
- S. Sundararajan, A. B. Samui and P. S. Kulkarni, J. Mater. Chem. A, 2017, 5, 18379–18396 CAS.
- Y. Wang, B. Tang and S. Zhang, Adv. Funct. Mater., 2013, 23, 4354–4360 CrossRef CAS.
- A. C. C. Rotzetter, C. M. Schumacher, S. B. Bubenhofer, R. N. Grass, L. C. Gerber, M. Zeltner and W. J. Stark, Adv. Mater., 2012, 24, 5352–5356 CrossRef CAS PubMed.
- D. C. Hyun, N. S. Levinson, U. Jeong and Y. Xia, Angew. Chem., Int. Ed., 2014, 53, 3780–3795 CrossRef CAS PubMed.
- R. K. Sharma, P. Ganesan, V. V. Tyagi, H. S. C. Metselaar and S. C. Sandaran, Energy Convers. Manage., 2015, 95, 193–228 CrossRef CAS.
- A. Sarı, C. Alkan and A. Biçer, Mater. Chem. Phys., 2012, 133, 87–94 CrossRef.
- M. Li, Z. Wu and H. Kao, Appl. Energy, 2011, 88, 3125–3132 CrossRef CAS.
- S. Sundararajan, A. B. Samui and P. S. Kulkarni, Sol. Energy Mater. Sol. Cells, 2016, 149, 266–274 CrossRef CAS.
- A. Sarı, A. Biçer and A. Karaipekli, Mater. Lett., 2009, 63, 1213–1216 CrossRef.
- X. Du, H. Wang, X. Cheng and Z. Du, RSC Adv., 2016, 6, 42643–42648 RSC.
- A. Kuru and S. A. Aksoy, Text. Res. J., 2014, 84, 337–346 CrossRef.
- W.-D. Li and E.-Y. Ding, Sol. Energy Mater. Sol. Cells, 2007, 91, 764–768 CrossRef CAS.
- Y. Jiang, E. Ding and G. Li, Polymer, 2002, 43, 117–122 CrossRef CAS.
- Y. Guo, Z. Tong, M. Chen and X. Liang, J. Appl. Polym. Sci., 2003, 88, 652–658 CrossRef CAS.
- X.-M. Zhou, J. Appl. Polym. Sci., 2009, 113, 2041–2045 CrossRef CAS.
- J. Hu, H. Yu, Y. Chen and M. Zhu, J. Macromol. Sci., Part B: Phys., 2006, 45, 615–621 CrossRef CAS.
- C. Chen, W. Liu, H. Yang, Y. Zhao and S. Liu, Sol. Energy, 2011, 85, 2679–2685 CrossRef CAS.
- Y. Fang, H. Kang, W. Wang, H. Liu and X. Gao, Energy Convers. Manage., 2010, 51, 2757–2761 CrossRef CAS.
- Q. Meng and J. Hu, Sol. Energy Mater. Sol. Cells, 2008, 92, 1260–1268 CrossRef CAS.
- J. Tang, M. Yang, W. Dong, M. Yang, H. Zhang, S. Fan, J. Wang, L. Tan and G. Wang, RSC Adv., 2016, 6, 40106–40114 RSC.
- K. Peng, C. Chen, W. Pan, W. Liu, Z. Wang and L. Zhu, Sol. Energy Mater. Sol. Cells, 2016, 145, 238–247 CrossRef CAS.
- S. Swarup, Mater. Sci. Appl., 2011, 2, 1516–1519 CAS.
- S. Andjelić and R. C. Scogna, J. Appl. Polym. Sci., 2015, 132, 42066 CrossRef.
- P. K. Senthil kumar and T. Raja, Int. J. Mech. Mechatron. Eng., 2015, 15, 42–47 Search PubMed.
- C.-L. Qin, W.-M. Cai, J. Cai, D.-Y. Tang, J.-S. Zhang and M. Qin, Mater. Chem. Phys., 2004, 85, 402–409 CrossRef CAS.
- G. Vinogradov and A. Malkin, Rheology of Polymers. (Reologi [j] a Polimerov). Viscoelasticity and Flow of Polymers. (Transl. by Artavaz Beknazarov), Mir-Springer XII, 1980 Search PubMed.
| This journal is © The Royal Society of Chemistry 2018 |

