
Functionalization of graphene oxide with naphthalenediimide diamine for high-performance cathode materials of lithium-ion batteries†
Yidan
Song
a,
Yuanrui
Gao
b,
Hongren
Rong
a,
Hao
Wen
a,
Yanyong
Sha
a,
Hanping
Zhang
a,
Hong-Jiang
Liu
*b and
Qi
Liu
 *ac
*ac
aSchool of Petrochemical Engineering, Jiangsu Key Laboratory of Fine Petrochemical Engineering, Advanced Catalysis and Green Manufacturing Collaborative Innovation Center, Changzhou University, 1 Gehu Road, Changzhou, Jiangsu 213164, P. R. China. E-mail: liuqi62@163.com
bDepartment of Chemistry, College of Science, Shanghai University, No. 99 Shangda Road, Shanghai, 200444, P. R. China. E-mail: liuhj@shu.edu.cn
cState Key Laboratory of Coordination Chemistry, Nanjing University, Nanjing, Jiangsu 210093, China
First published on 11th January 2018
Abstract
Through the covalent bonding between naphthalenediimide diamine (NDIDA) and graphene oxide (GO), we synthesize NDIDA-functionalized graphene oxide (NDIDA-GO). The as-synthesized NDIDA-GO is characterized by powder X-ray diffraction, Fourier transform infrared spectroscopy, thermogravimetric analysis, Raman spectroscopy, X-ray photoelectron spectroscopy, scanning electron microscopy, transmission electron microscopy, and the Brunauer–Emmett–Teller surface area analysis. As a cathode material for lithium-ion batteries, within a voltage window of 4.5–1.5 V, NDIDA-GO exhibits a high specific capacity, good cyclic stability, and rate capability, keeping a specific capacity of 240 mA h g−1 after 50 cycles at 50 mA g−1. This work provides an effective route for the development of high-performance organic-based cathode materials for lithium-ion batteries.
1. Introduction
The prosperity of the economy, the progress of science and technology, and the concept of sustainable development all have requested us to search for environmentally friendly energy sources to replace the increasingly exhausted fossil energy.1–3 The desire for the renewable and clean energy resources, such as solar energy and wind power, has promoted the development of energy storage systems, especially the rechargeable lithium-ion batteries (LIBs). LIBs are the frontier technology in the field of batteries for their long life, high specific energy, and high efficiency.4–8 Many studies were devoted to finding the novel materials to improve the performance of the lithium-ion batteries.9–16 Among them, a large number of works have been focused on the inorganic electrode materials such as LiCoO2, LiMn2O4, and LiFePO4 for the cathode.14 However, their capacities are not high enough to meet the future need, which leads to the bottleneck hampering the further development of the LIBs.15–18 On the other hand, if all cars rely on the electric-driven engines in the several decades, we will face the challenges of the short supply, like what is happening with the fossil fuels. Thus, M. Armand and M. Tarascon proposed the electrodes prepared from the natural resources, like the fuel cells that use methanol and hydrogen from biomass.9 It should be a good choice to use the electroactive organic materials synthesized from biomass in LIBs.19Over the past several decades, many organic compounds have been investigated as the cathode materials for their potential use in LIBs.12,20,21 Conductive organic polymers,22 organosulfur compounds,23 free radical compounds,24,25 and carbonyl compounds26,27 are four major classes. Among them, the carbonyl compounds are considered as the most promising candidate as the cathode materials for LIBs because of their fast kinetics and high capacity.28,29 Unfortunately, in most cases, these cathode materials usually exhibit a low cycling performance and fast capacity decay owing to their severe dissolution in the organic electrolyte and a poor electrical conductivity.30 To solve the dissolution problem, many strategies are proposed including polymerization of small molecule carbonyls,30,31 employing the solid-state electrolytes,32,33 and optimizing the molecular structure.34
Besides those strategies, constructing the carbon-supported organic composites is a good route, which may overcome the two main issues mentioned above simultaneously.35–38 Graphene and graphene oxide (GO)-based materials, as the carbon-based materials, have attracted a considerable interest within the scientific community due to their excellent electrical and mechanical properties, as well as their applications in many fields, such as LIBs, solar batteries, sodium-ion batteries, and the composite materials etc.39–44
Herein, we focus our attention on 1,4,5,8-naphthalenetetracarboxylic dianhydride (referred as NTCDA herein). As a polycarbonyl compound, NTCDA can be used as a suitable electrode for LIBs owing to its high theoretical specific capacity of 400 mA h g−1 (considering that NTCDA has four electrons to transfer).30 To overcome the dissolution problem of NTCDA and guarantee the efficient electron transfer in the electrochemical reactions, we designed and synthesized naphthalenediimide diamine-functionalized graphene oxide (NDIDA-GO) as a new organic cathode material for LIBs via the amide formation between NDIDA and GO (Fig. 1). Consequently, the resultant NDIDA-GO exhibited a higher specific capacity (240 mA h g−1 after 50 cycles) when compared to the LiFePO4 cathode material (with a theoretical capacity of 170 mA h g−1), excellent cyclability, and better rate capability. Importantly, this convenient and elegant method can be extended to assemble GO with many other multiple carbonyl compounds to find the higher capacity and better cyclability organic cathode materials to promote the development and application of the LIBs.
 | ||
| Fig. 1 General synthetic route of NDIDA-GO. | ||
2. Experimental section
Materials
The chemicals were of analytical purity purchased from Shanghai Chemical Reagent Company and used without further purification unless otherwise stated.Synthesis of graphene oxide (GO)
Graphene oxide was synthesized by a modified Hummer's method.45,46Preparation of naphthalenediimide diamine
Naphthalenediimide diamine (NDIDA) was synthesized by the previously reported method with some modifications.47 First, 50 mL of anhydrous MeOH was added to a three-necked flask. Then, under an inert gas protection and stirring condition, 1,4,5,8-naphthalenetetracarboxylic dianhydride (NTCDA, 750 mg, 2.8 mmol) and diaminobenzene (3.02 g, 28 mmol) were added to the anhydrous MeOH and dissolved gradually. The reaction was heated to reflux for 16 h. Finally, the reaction mixture was cooled to room temperature, filtered, rinsed with EtOH, and dried in a vacuum drying oven to obtain a brownish solid in an 85% yield.Synthesis of NDIDA-GO
60 mg of GO and 36 mg of NDIDA were added to 20 mL of anhydrous N,N′-dimethylformamide (DMF) and sonicated for 15 min. Then the suspension was transferred to the three-necked flask. 40 mL of DMF and 36 mg of dicyclohexylcarbodiimide (DCC) were added. The reaction was heated to 65 °C and refluxed for 24 h under stirring. Finally, the suspension was cooled to room temperature, filtered, washed with EtOH, and dried under vacuum for 4 h at 50 °C. The dark gray powder was obtained.Characterization
The as-prepared materials were characterized by X-ray diffraction (D/max 2500PC, Rigaku) with a Cu-Kα radiation (λ = 0.15406 nm). The Fourier transform infrared (FT-IR) spectra were recorded on a Nicolet 460 spectrophotometer (in the KBr pellets). Thermogravimetric analysis (TGA) was carried out using a Dupont thermal analyzer from room temperature to 800 °C under a nitrogen atmosphere at a heating rate of 5 °C min−1. The X-ray photoelectron spectrum (XPS) of the sample was taken on an ESCALABMK II X-ray photoelectron spectrometer. The FESEM images were taken on a Zeiss Supra 55 field emission scanning electron microscopy. The transmission electron microscopy (TEM) studies were conducted on a JEM-2100 TEM facility operated at 200 kV. The nitrogen adsorption isotherm was measured on a Micromeritics ASAP 2010C pore analyzer at the 77 K continuous adsorption conditions. The Brunauer Emmett and Teller (BET) and Barrett–Joyner–Halenda (BJH) methods were used to calculate the specific surface area, pore size, and pore volume. The Raman spectra were recorded on a Raman spectrometer (Renishaw, Britain) with a 514.5 nm Ar laser excitation.Electrochemical measurements
The electrochemical measurements were implemented by using the coin-type cells. The CR 2016 coin-type cells were assembled in an argon-filled glovebox (Mbraun, Unilab, Germany) to study the electrochemical performances of NDIDA-GO, GO, and NDIDA as the cathode materials of LIBs. The electrodes were fabricated as follows: 70 wt% active material (NDIDA-GO/GO/NDIDA), 15 wt% acetylene black, and 15 wt% polytetrafluoroethylene binder were dissolved in N-methylpyrolidinone (NMP) and coated onto an Al foil current collector. The coated electrodes were dried at 80 °C in a vacuum oven for 12 h and then pressed. The average load of active material was about 1 mg per cm2 on the electrode. All of the specific capacities were calculated according to the active material mass from the electrode materials. The electrolyte was 1 M LiPF6–ethylene carbonate (EC) + dimethyl carbonate (DMC) (1![[thin space (1/6-em)]](https://www.rsc.org/images/entities/char_2009.gif) :1, volume ratio). Cyclic voltammetry (CV) and electrochemical impedance spectroscopy (EIS) were performed using a CHI 660D electrochemical analyzer. CV was tested at a scanning rate of 1 mV s−1 in the potential range of 1.5–4.5 V. EIS was tested in a frequency range of 10−2 to 105 Hz with an amplitude of 5 mV at the open-circuit voltage. The galvanostatic charge/discharge measurement was carried out within the voltage range from 1.5 to 4.5 V (vs. Li/Li+) by using a Newwell cell test system (Newwell CT 3008W) at different current rates.
:1, volume ratio). Cyclic voltammetry (CV) and electrochemical impedance spectroscopy (EIS) were performed using a CHI 660D electrochemical analyzer. CV was tested at a scanning rate of 1 mV s−1 in the potential range of 1.5–4.5 V. EIS was tested in a frequency range of 10−2 to 105 Hz with an amplitude of 5 mV at the open-circuit voltage. The galvanostatic charge/discharge measurement was carried out within the voltage range from 1.5 to 4.5 V (vs. Li/Li+) by using a Newwell cell test system (Newwell CT 3008W) at different current rates.
3. Results and discussion
Preparation and characterization of NDIDA-GO
To synthesize NDIDA-GO, GO and NDIDA were firstly synthesized by the acid oxidation of graphite powder and the reaction of NTCDA and diaminobenzene, respectively. Subsequently, in the presence of DCC, the reactions between the carboxy and epoxy groups in GO and the amine groups in NDIDA can result in the production of NDIDA-GO (Fig. 1). Fig. 2a shows the Fourier transform infrared (FT-IR) spectra of NDIDA, GO, and NDIDA-GO. The spectrum of GO presents the absorption bands at 3420 cm−1 (C–OH), 1730 cm−1 (C![[double bond, length as m-dash]](https://www.rsc.org/images/entities/char_e001.gif) O), and 1087 cm−1 (C–O), corresponding to the results in the previous report.48 For NDIDA, the stretching vibration peaks of N–H appear at 3435 and 3332 cm−1, while the absorption peaks at 1702 and 1250 cm−1 correspond to the stretching vibration of CO and C–N, respectively.47 Compared with NDIDA, for NDIDA-GO, the absorption peak of N–H at 3332 cm−1 disappears, the peak of CO shifts from 1702 to 1736 cm−1, while the peak strength of C–N stretch at 1245 cm−1 is obviously enhanced. These results verify that the amidation reaction between GO and NDIDA has happened.49,50Fig. 2b shows the XRD patterns of GO, NDIDA, and NDIDA-GO. For GO, a strong diffraction peak locates at 2θ = 11.20°, meaning that an interlayer distance is about 0.79 nm due to the presence of oxygen-containing functional groups. The pattern of NDIDA-GO shows a strong band at about 2θ = 10.0° and the interlayer distance increases to 0.88 nm. The increase of the interlayer space observed further confirms the combination of NDIDA and GO after the functionalization. Because this increase is small, the covalent attachment may take place at the edges of the GO layers. In addition, the diffraction peaks of NDIDA do not appear in the XRD pattern of NDIDA-GO, which also indicates that the reaction between NDIDA and GO has produced a new material.
O), and 1087 cm−1 (C–O), corresponding to the results in the previous report.48 For NDIDA, the stretching vibration peaks of N–H appear at 3435 and 3332 cm−1, while the absorption peaks at 1702 and 1250 cm−1 correspond to the stretching vibration of CO and C–N, respectively.47 Compared with NDIDA, for NDIDA-GO, the absorption peak of N–H at 3332 cm−1 disappears, the peak of CO shifts from 1702 to 1736 cm−1, while the peak strength of C–N stretch at 1245 cm−1 is obviously enhanced. These results verify that the amidation reaction between GO and NDIDA has happened.49,50Fig. 2b shows the XRD patterns of GO, NDIDA, and NDIDA-GO. For GO, a strong diffraction peak locates at 2θ = 11.20°, meaning that an interlayer distance is about 0.79 nm due to the presence of oxygen-containing functional groups. The pattern of NDIDA-GO shows a strong band at about 2θ = 10.0° and the interlayer distance increases to 0.88 nm. The increase of the interlayer space observed further confirms the combination of NDIDA and GO after the functionalization. Because this increase is small, the covalent attachment may take place at the edges of the GO layers. In addition, the diffraction peaks of NDIDA do not appear in the XRD pattern of NDIDA-GO, which also indicates that the reaction between NDIDA and GO has produced a new material.
 | ||
| Fig. 2 (a) FT-IR spectra of NDIDA, GO, and NDIDA-GO. (b) XRD spectra, (c) Raman spectra, and (d) XPS spectra of GO and NDIDA-GO. High-resolution XPS spectra of C 1s (e) and O 1s (f) for NDIDA-GO. | ||
The functionalization of GO with NDIDA was further examined by Raman spectroscopy (Fig. 2c). As presented in the Raman spectra, GO exhibits the D band at 1348 cm−1 and the G band at 1602 cm−1. The D band corresponds to a breathing mode of A1g symmetry and the G band can be assigned to the E2g vibration mode of the sp2 C atoms. The Raman spectrum of NDIDA-GO shows the similar spectral feature with that of GO, which is the D band at 1333 cm−1 and the G band at 1598 cm−1. Meanwhile, the band-intensity ratio (ID/IG) increases from 0.87 to 1.15, indicating that the structure distortion arises from the covalent bonding interaction between GO and NDIDA.48,49 The shift of the Raman peak should be attributed to the charge transfer between GO and the newly grafted NDIDA moieties.49 The X-ray photoelectron spectroscopy (XPS) technique was applied to examine the elemental composition of the sample. Fig. 2d exhibits the XPS spectra of GO and NDIDA-GO for comparison. Based on the calculation, the ratio of the intensity of the C 1s peak to that of the O 1s peak in the spectrum of NDIDA-GO is larger than that for GO, also indicating the successful bonding between NDIDA and GO. Furthermore, the N content increases from 0.74 atomic% for GO to 4.27 atomic% for NDIDA-GO due to the amidation reaction between GO and NDIDA (Table S1†). The changes of the intensity of the N 1s peak intensities for NDIDA-GO and GO also further confirm this fact (Fig. S1†). The elemental composition analysis indicates that the contents of C, N, and O atoms in NDIDA-GO are 72.95, 4.27, and 22.77 atomic%, respectively (Table S1†). Based on these data, it can be concluded that there is one NDIDA group per 43 carbon atoms on a GO sheet. Accordingly, there is about 35.8 wt% of NDIDA in NDIDA-GO. The high-resolution XPS spectra of C 1s and O 1s for NDIDA-GO are shown in Fig. 2e and f, respectively. As seen from these figures, the spectrum of C 1s can be divided into five peaks located at 283.6, 285.3, 285.7, 286.4, and 287.3 eV, corresponding to C–C bonding (sp2 carbon), C–C bonding in the defect graphite lattice (sp3 carbon), C–N bonding, C–O bonding, and CO bonding, respectively.48,49 The spectrum of O 1s can be divided into two peaks centered at 531.7 and 530.9 eV, attributing to C–O bonding and CO bonding, respectively.48,49 Besides, according to the reported spectra, the binding energy of N 1s for NDIDA is 401.01 eV,47 while the binding energy of N 1s for NDIDA-GO is shifted to 398.76 eV, as shown in Fig. S1.† This fact further verifies the linking between NDIDA and GO. The formation of the amide groups can increase the electron density on the N atoms of NDIDA-GO, resulting in the decrease of the binding energy of N 1s.51 The similar shifts have been observed for the NDI-TFP polymer.47
TGA was used to further investigate the presence of the functional groups in NDIDA-GO. The TGA curves of GO, NDIDA, and NDIDA-GO are shown in Fig. S2.† It can be seen that GO shows a little mass loss of about 2.5% at the temperature under 100 °C and about 16.5% at the temperature lower than 200 °C. The two mass losses should be ascribed to the removal of the adsorbed water and the decomposition of the oxygen-containing functional groups on the GO structure, respectively.46 In comparison, the TGA curve of NDIDA-GO shows nearly 27% mass loss at the temperature lower than 200 °C, resulting from the removal of the adsorbed water and the pyrolysis of the NDIDA grafted onto GO and the oxygen-containing functional groups on GO. It is worthwhile to mention that the mass loss of NDIDA is lower than that of GO and NDIDA-GO at the temperature lower than 580 °C. This phenomenon may be related to the hydrogen bonding and π–π interactions between the NDIDA molecules, which results in the better thermal stability of NDIDA. After the reaction of NDIDA and GO, since no original hydrogen bonding and π–π interactions exist, the thermal stability of NDIDA-GO is lower than that of NDIDA at the temperature under 580 °C.
The microstructure and morphology of NDIDA-GO were investigated by field emission scanning electron microscopy (FESEM) and transmission electron microscopy (TEM). The FESEM image of NDIDA-GO (Fig. 3a, S3a and b†) reveals that the NDIDA-GO sample is composed of a large number of nanosheets and each sheet has a wrinkled and folded structure, indicating that it also consists of many ultrathin sheets. Compared with the morphology of GO (Fig. S3c and d†), the morphology of NDIDA-GO shows no obvious change. From the TEM image of NDIDA-GO (Fig. 3b), a multilayer structure can be observed, further confirming that it is composed of many ultrathin sheets.
 | ||
| Fig. 3 (a) FESEM and (b) TEM images of the NDIDA-GO sample. | ||
The surface area and porosity of NDIDA-GO were characterized by the nitrogen adsorption–desorption technique. The adsorption–desorption isotherm is shown in Fig. 4. The isotherm for NDIDA-GO exhibits a typical type-III sorption isotherm, indicating the existence of macropores. The surface area and total pore volume of the NDIDA-GO sample are 14.15 m2 g−1 and 0.026 cm3 g−1, respectively. The average pore diameter is calculated with the BJH method to be 24.42 nm. The macropores originated from the interspaces of the nanosheets. Thus, an abundant porous structure provides an excellent condition for the ion storage and diffusion. The surface area, total pore volume, and average pore diameter of the GO sample are 11.38 m2 g−1, 0.01 cm3 g−1, and 7.58 nm, respectively (Fig. S4†), less than those of the NDIDA-GO sample.
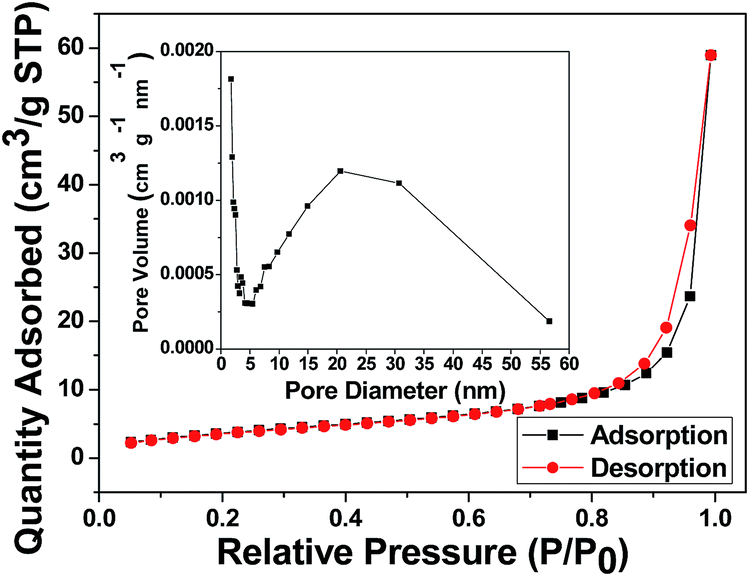 | ||
| Fig. 4 Nitrogen adsorption–desorption isotherm for the synthesized NDIDA-GO. The inset: pore size distribution. | ||
Electrochemical performance
Fig. 5a displays the charge/discharge profiles of NDIDA-GO at a rate of 50 mA h g−1. The first discharge capacity of NDIDA-GO is 240 mA h g−1, which is higher than the second discharge capacity (218 mA h g−1), and the irreversible capacity loss (ICL) is 9.2%. The ICL may originate from the formation of the electrolyte decomposition and a SEI film on the electrode surface. | ||
| Fig. 5 (a) Charge–discharge profiles of the NDIDA-GO electrode at a current density of 50 mA g−1. (b) Cyclic performances of the NDIDA-GO, GO, and NDIDA electrodes. (c) Charge–discharge performances of the NDIDA-GO electrode at various current densities. (d) CV curves of the NDIDA-GO, GO, and NDIDA electrodes. | ||
The cycling performances of the NDIDA-GO, GO, and NDIDA electrodes were measured at 50 mA g−1 in the range of 1.5–4.5 V versus Li/Li+. As shown in Fig. 5b, the first discharge capacity of the NDIDA electrode is only 30.6 mA h g−1 and decreases to 3.8 mA h g−1 after 50 cycles, indicating that it has a poor Li storage behavior due to its low conductivity and solubility in the electrolyte. For GO, it displays the discharge capacity of 98 mA h g−1 after 50 cycles, meaning that it has a poorer Li storage performance. On the contrary, the NDIDA-GO electrode shows a good cycling stability along with a high capacity. The initial discharge capacity is 240 mA h g−1. After 5 cycles, the NDIDA-GO electrode shows a stable capacity. After 50 cycles, the discharge capacity of the electrode maintains at 240 mA h g−1, which is 100% of the discharge capacity in the first cycle.
The value is superior or comparable to that of some previously reported carbon-based cathodes,37,38 organic cathodes, and organic/carbon composite cathodes.35,52,53 The improvement of the electrochemical performances of the NDIDA-GO electrode should be attributed to its electrical conductivity improvement and insolubility in the electrolyte. The solubility experiment of the NDIDA electrode and the NDIDA-GO electrode verifies that NDIDA from the NDIDA electrode dissolves easily in the electrolyte, while NDIDA-GO is insoluble (Fig. S5†) due to the combination of NDIDA and GO via the covalent bonding. As shown in Fig. S6,† the high reversible capacity may mainly originate from the reversible reaction between the CO and epoxide functional groups in NDIDA-GO and Li+ ions,12,54 where the conjugated carbonyl groups from NDIDA joins a multistep reduction during the discharge process and then the as-formed alkoxide groups are reoxidized in the subsequent charge process, showing the potential of NDIDA-GO as a future cathode material in LIBs.
The battery was further cycled at different current densities to study the rate performance. As shown in Fig. 5c, the average reversible capacities of the NDIDA-GO electrode obtained at 100, 200, 500, and 1000 mA g−1 are about 180, 153, 112, and 101 mA h g−1, respectively. It is worth pointing out that the capacity can be returned to 181 mA h g−1 when the current density is back to 100 mA g−1 after such higher current cycling, revealing that the NDIDA-GO electrode has a better rate capability.
The cyclic voltammetry (CV) curves of the second cycle for the NDIDA-GO, GO, and NDIDA electrodes tested in the voltage range of 1.5–4.0 V at 1 mV s−1 are shown in Fig. 5d. Compared with NDIDA and GO, NDIDA-GO presents a significantly improved gravimetric current, indicating that the electrical conductivity of NDIDA-GO is higher than that of NDIDA and GO. This result should be ascribed to the covalent combination between NDIDA and GO via the amide formation and the possible partial reduction of GO in the process of the amidation reaction.50 The removal of some oxygen-containing functional groups from GO can result in the electrical conductivity increase of NDIDA-GO. Evidently, two pairs of the redox peaks can be observed in the CV curve of the first cycle of NDIDA (Fig. S7†), corresponding to the lithiation and delithiation of two conjugated carbonyl groups.55,56 But in the CV curve of the second cycle, only a pair of the redox peaks can be clearly observed (Fig. 5d). From the CV curve of NDIDA-GO, we only see a pair of the relatively broad redox peaks at around 2.4 and 2.70 V. The formation of the broad peaks is relative to the multistep reaction processes,57,58 which is also confirmed by the charge/discharge curves without obvious plateaus of NDIDA-GO (Fig. 5a). In addition, from the CV curve of GO, the redox peaks are not seen (Fig. 5d). Fig. S8† is the CV curves of the NDIDA-GO electrode from the first to the fourth cycle. Obviously, the cycles of CV for the NDIDA-GO electrodes show the similar features during lithiation and delithiation after the second cycle. This means that NDIDA-GO has the excellent cycle stability. Because the NDIDA-GO electrode has the wide voltage window as well as the rapid charge–discharge curves without obvious plateaus, NDIDA-GO may be used as an electrode material in lithium-ion hybrid supercapacitors.59,60
Electrochemical impedance spectroscopy (EIS) of the NDIDA-GO electrode was performed in the frequency range from 100 Hz to 0.01 Hz for investigating the kinetics of electrochemical reactions on the electrode.
As shown in Fig. 6, each Nyquist plot is composed of two partially overlapped semicircles and a straight line in the low-frequency range. The semicircle in the high-frequency range should be assigned to the formation of the SEI film (Rs) and the other semicircle can be ascribed to the charge-transfer process (Rct). An equivalent circuit model is presented in the inset of Fig. 6. Here, R1 stands for the internal resistance containing the battery component resistance and the electrolyte solution resistance, Rs represents the SEI passivating film resistance, Rct is the charge transfer resistance, while W, Q1, and Q2 represent the Warburg impedance and CPE constant phase elements, respectively.61,62 For a better comparison, the simulated values of EIS obtained by Zview software are displayed in Table 1. It can be observed that all R1 values after 1 and 50 cycles are small, 6.3 and 3.1 Ω, respectively; the Rs and Rct values after 50 cycles are 81.4 and 52.8 Ω, respectively, higher than those corresponding values after 1 cycle. This result may be ascribed to the loss of some active materials on the current collector in the process of charge–discharge.63 The phase angles after 1 and 50 cycles at the low-frequency range are all larger than 45°, showing that the Li+ ions have better mobility.57 For comparison, the Nyquist plot of the NDIDA electrode after 1 cycle is presented in Fig. S9.† As seen in Fig. S9,† only a large semicircle appears in the Nyquist plot, which is attributed to the combination of Rs and Rct (Rs+ct). The Rs+ct value of the NDIDA electrode is 4366 Ω, which is much higher than the Rs and Rct values of the NDIDA-GO electrode, indicating that the migration kinetics of Li+ ions through the SEI film is enhanced and the velocity of the charge transfer reaction in the NDIDA-GO electrode becomes faster compared to those with the NDIDA electrode. As shown in Fig. S10,† the R1, Rs, and Rct values of the GO electrode are also larger than those of the NDIDA-GO electrode, meaning that the migration ability of Li+ ions in the NDIDA-GO electrode is also stronger than that in the GO electrode.
 | ||
| Fig. 6 The Nyquist plots of the NDIDA-GO electrode. | ||
| Sample | R 1 | R s | CPE1-T | CPE1-P | W 1-R | R ct | CPE2-T | CPE2-P | W 2-R |
|---|---|---|---|---|---|---|---|---|---|
| After 1 cycle | 6.3 | 35.9 | 4.550 × 10⁻³ | 0.46 | 0.92 | 17.3 | 2.5 × 10⁻⁴ | 0.62 | 0.62 |
| After 50 cycles | 3.1 | 81.4 | 2.700 × 10⁻⁵ | 0.67 | 261 | 52.8 | 456.8 | 5.28 | 1.00 × 10⁻² |
4. Conclusion
In summary, for the first time, we have successfully synthesized naphthalenediimide diamine (NDIDA)-functionalized graphene oxide (GO) via the amide formation between NDIDA and GO. The specific capacity and cycle stability of the NDIDA-GO as a cathode material are significantly enhanced compared to those of NDIDA owing to the insolubility of the NDIDA-GO material in the electrolyte and its increased electrical conductivity. At a current density of 50 mA g−1, its reversible capacity still remains 240 mA h g−1 after 50 cycles. We believe that this work will open an effective approach for combining graphene oxide with other organic carbonyl compounds as the cathode materials of LIBs. Relative research works are in progress in our laboratory.Conflicts of interest
There are no conflicts to declare.Acknowledgements
We thank the financial support from the National Natural Science Foundation of China (No. 20971060 and 21101018), the Natural Science Research Key Project of Jiangsu Colleges and Universities (No. 16KJA430005), Jiangsu Province Key Laboratory of Fine Petrochemical Engineering and the Natural Science Foundation of State Key Laboratory of Coordination Chemistry.References
- D. Larcher and J. M. Tarascon, Nat. Chem., 2015, 7, 19–29 CrossRef CAS PubMed.
- M. S. Whittingham, MRS Bull., 2008, 33, 411–419 CrossRef CAS.
- Z. Yang, J. Zhang, M. C. Kintnermeyer, X. Lu, D. Choi, J. P. Lemmon and J. Liu, Chem. Rev., 2011, 111, 3577–3578 CrossRef CAS PubMed.
- B. Scrosati and J. Garche, J. Power Sources, 2010, 195, 2419–2430 CrossRef CAS.
- R. Marom, S. F. Amalraj, N. Leifer, D. Jacob and D. Aurbach, J. Mater. Chem., 2011, 21, 9938–9954 RSC.
- J. M. Tarascon and M. Armand, Nature, 2001, 414, 359–367 CrossRef CAS PubMed.
- N. S. Choi, Z. Chen, S. A. Freunberger, X. Ji, Y. K. Sun, K. Amine, G. Yushin, L. F. Nazar, J. Cho and P. G. Bruce, Angew. Chem., Int. Ed., 2012, 51, 9994–10024 CrossRef CAS PubMed.
- J. B. Goodenough and K. S. Park, J. Am. Chem. Soc., 2013, 135, 1167–1176 CrossRef CAS PubMed.
- M. Armand and J. M. Tarascon, Nature, 2008, 451, 652–657 CrossRef CAS PubMed.
- B. Xu, D. Qian, Z. Wang and Y. S. Meng, Mater. Sci. Eng., R, 2012, 73, 51–65 CrossRef CAS.
- W. Walker, S. Grugeon, O. Mentre, S. Laruelle, J. M. Tarascon and F. Wudl, J. Am. Chem. Soc., 2010, 132, 6517–6523 CrossRef CAS PubMed.
- Y. Liang, Z. Tao and J. Chen, Adv. Energy Mater., 2012, 2, 742–769 CrossRef CAS.
- X. Han, G. Qing, J. Sun and T. Sun, Angew. Chem., Int. Ed., 2012, 51, 5147–5151 CrossRef CAS PubMed.
- A. Manthiram, J. Phys. Chem. Lett., 2011, 2, 176–184 CrossRef CAS.
- Q. Liu, L. Yu, Y. Wang, Y. Ji, J. Horvat, M. L. Cheng, X. Jia and G. Wang, Inorg. Chem., 2013, 52, 2817–2822 CrossRef CAS PubMed.
- M. S. Whittingham, Chem. Rev., 2014, 114, 11414–11443 CrossRef CAS PubMed.
- F. Wu and G. Yushin, Energy Environ. Sci., 2017, 10, 435–459 CAS.
- F. Wu, O. Borodin and G. Yushin, MRS Energy & Sustainability, 2017, 4, 1–15 Search PubMed.
- Z. Song, H. Zhan and Y. Zhou, Chem. Commun., 2009, 5, 448–450 RSC.
- P. Poizot and F. Dolhem, Energy Environ. Sci., 2011, 4, 2003–2019 CAS.
- Z. Song and H. Zhou, Energy Environ. Sci., 2013, 6, 2280–2301 CAS.
- P. Novák, K. Müller, K. S. Santhanam and O. Haas, Chem. Rev., 1997, 28, 207–282 CrossRef.
- K. Naoi, K. I. Kawase, M. Mori and M. Komiyama, J. Electrochem. Soc., 1997, 144, L173–L175 CrossRef CAS.
- K. Nakahara, S. Iwasa, M. Satoh, Y. Morioka, J. Iriyama, M. Suguro and E. Hasegawa, Chem. Phys. Lett., 2002, 359, 351–354 CrossRef CAS.
- K. Oyaizu, T. Suga, K. Yoshimura and H. Nishide, Macromolecules, 2008, 41, 6646–6652 CrossRef CAS.
- T. Takeda, R. Taniki, A. Masuda, I. Honma and T. Akutagawa, J. Power Sources, 2016, 328, 228–234 CrossRef CAS.
- L. Fedele, F. Sauvage, J. Bois, J. M. Tarascon and M. Becuwe, J. Electrochem. Soc., 2013, 161, 46–52 CrossRef.
- B. Häupler, A. Wild and U. S. Schubert, Adv. Energy Mater., 2015, 5, 1402034–1402068 CrossRef.
- Y. Liang, P. Zhang and J. Chen, Chem. Sci., 2013, 4, 1330–1337 RSC.
- X. Han, C. Chang, L. Yuan, T. Sun and J. Sun, Adv. Mater., 2007, 19, 1616–1621 CrossRef CAS.
- T. Nokami, T. Matsuo, Y. Inatomi, N. Hojo, T. Tsukagoshi, H. Yoshizawa, A. Shimizu, H. Kuramoto, K. Komae and H. Tsuyama, J. Am. Chem. Soc., 2015, 134, 19694–19700 CrossRef PubMed.
- Y. Hanyu, Sci. Rep., 2012, 2, 453–459 CrossRef PubMed.
- Y. Hanyu, Y. Ganbe and I. Honma, J. Power Sources, 2013, 221, 186–190 CrossRef CAS.
- Y. Morita, S. Nishida, T. Murata, M. Moriguchi, A. Ueda, M. Satoh, K. Arifuku, K. Sato and T. Takui, Nat. Mater., 2011, 10, 947–951 CrossRef CAS PubMed.
- M. Lee, J. Hong, H. Kim, H. D. Lim, S. B. Cho, K. Kang and C. B. Park, Adv. Mater., 2014, 26, 2558–2565 CrossRef CAS PubMed.
- M. S. Kwon, A. Choi, Y. Park, J. Y. Cheon, H. Kang, Y. N. Jo, Y. J. Kim, S. Y. Hong, S. H. Joo, C. Yang and K. T. Lee, Sci. Rep., 2014, 4, 7404–7411 CrossRef CAS PubMed.
- W. Ai, Z. Du, Z. Fan, J. Jiang, Y. Wang, H. Zhang, L. Xie, W. Huang and T. Yu, Carbon, 2014, 76, 148–154 CrossRef CAS.
- S. B. Sertkol, B. Esat, A. A. Momchilov, M. B. Yılmaz and M. Sertkol, Carbon, 2017, 116, 154–166 CrossRef.
- Z. Zhu and J. Chen, J. Electrochem. Soc., 2015, 162, A2393–A2405 CrossRef CAS.
- A. K. Geim and K. S. Novoselov, Nat. Mater., 2007, 6, 183–191 CrossRef CAS PubMed.
- S. Stankovich, D. A. Dikin, G. H. Dommett, K. M. Kohlhaas, E. J. Zimney, E. A. Stach, R. D. Piner, S. T. Nguyen and R. S. Ruoff, Nature, 2006, 442, 282–286 CrossRef CAS PubMed.
- D. Chen, H. Zhang, Y. Liu and J. Li, Energy Environ. Sci., 2013, 6, 1362–1387 CAS.
- S. Chen, W. Yeoh, Q. Liu and G. Wang, Carbon, 2012, 50, 4557–4565 CrossRef CAS.
- J.-H. Shim, Y.-M. Kim, M. Park, J. Kim and S. Lee, ACS Appl. Mater. Interfaces, 2017, 9, 18720–18729 CAS.
- W. S. Hummers and R. E. Offeman, J. Am. Chem. Soc., 1958, 80, 1339 CrossRef CAS.
- Y. Ji, Q. Liu, M. Cheng, L. Lai, Z. Li, Y. Peng and Y. Yang, Mater. Sci. Eng., C, 2013, 33, 3811–3816 CrossRef CAS PubMed.
- C. R. DeBlase, K. Hernández-Burgos, J. M. Rotter, D. J. Fortman, D. D. S. Abreu, R. A. Timm, P. I. C. N. Diógenes, L. T. Kubota, P. H. D. Abruña and P. W. R. Dichtel, Angew. Chem., Int. Ed., 2015, 54, 13225–13229 CrossRef CAS PubMed.
- G. He, H. Chen, J. Zhu, F. Bei, X. Sun and X. Wang, J. Mater. Chem., 2011, 21, 14631–14638 RSC.
- H. Cao, X. Wu, G. Yin and J. H. Warner, Inorg. Chem., 2012, 51, 2954–2960 CrossRef CAS PubMed.
- S. Song, Y. Xue, L. Feng, H. Elbatal, P. Wang, C. N. Moorefield, G. R. Newkome and L. Dai, Angew. Chem., Int. Ed., 2014, 53, 1415–1419 CrossRef CAS PubMed.
- S. Liu, D. Wang and S. Pan, Analysis of X-ray Photoelectron Spectroscopy, Science Press, Beijing, 1988 Search PubMed.
- C. Luo, R. Huang, R. Kevorkyants, M. Pavanello, H. He and C. Wang, Nano Lett., 2014, 14, 1596–1602 CrossRef CAS PubMed.
- Z. Song, T. Xu, M. L. Gordin, Y. B. Jiang, I. T. Bae, Q. Xiao, H. Zhan, J. Liu and D. Wang, Nano Lett., 2012, 12, 2205–2211 CrossRef CAS PubMed.
- D. W. Wang, C. Sun, G. Zhou, F. Li, L. Wen, B. C. Donose, G. Q. Lu, H. M. Cheng and I. R. Gentle, J. Mater. Chem. A, 2013, 1, 3607–3612 CAS.
- D. J. Kim, S. H. Je, S. Sampath and J. W. Choi, RSC Adv., 2012, 2, 7968–7970 RSC.
- G. S. Vadehra, R. P. Maloney, M. A. Garcia-Garibay and B. Dunn, Chem. Mater., 2014, 26, 7151–7157 CrossRef CAS.
- W. Ai, W. Zhou, Z. Du, C. Sun, J. Yang, Y. Chen, Z. Sun, S. Feng, J. Zhao, X. Dong, W. Huang and T. Yu, Adv. Funct. Mater., 2016, 27, 1603603 CrossRef.
- Z. Zhu, M. Hong, D. Guo, J. Shi, Z. Tao and J. Chen, J. Am. Chem. Soc., 2014, 136, 16461–16464 CrossRef CAS PubMed.
- M. Yang and Z. Zhou, Adv. Sci., 2017, 4, 1600408 CrossRef PubMed.
- Q. Xie, H. Yang, M. Wang, M. Yang, Q. Guo, L. Wan, H. Xia and Y. Yu, Adv. Energy Mater., 2017, 1701336 CrossRef.
- C. Shi, Q. Xia, X. Xue, Q. Liu and H.-J. Liu, RSC Adv., 2016, 6, 4442–4447 RSC.
- Y. Lu, J. Wu, J. Liu, M. Lei, S. Tang, P. Lu, L. Yang, H. Yang and Q. Yang, ACS Appl. Mater. Interfaces, 2015, 7, 17433–17440 CAS.
- C. Shi, Y. Gao, L. Liu, Y. Song, X. Wang, H.-J. Liu and Q. Liu, J. Nanopart. Res., 2016, 18, 371–381 CrossRef.
Footnote |
| † Electronic supplementary information (ESI) available: The XPS spectra of N 1s for NDIDA-GO and GO, TGA curves of GO, NDIDA, and NDIDA-GO, FESEM images of NDIDA-GO and GO, N2 adsorption–desorption isotherm for GO, CV curves of NDIDA and NDIDA-GO, Nyquist plot of the NDIDA and proposed electrochemical Li storage mechanism for the NDIDA-GO electrode. See DOI: 10.1039/c7se00543a |
| This journal is © The Royal Society of Chemistry 2018 |