Repurposing paper by-product lignosulfonate as a sulfur donor/acceptor for high performance lithium–sulfur batteries†
Lu
Li
 a,
Liping
Huang
b,
Robert J.
Linhardt
 c,
Nikhil
Koratkar
ab and
Trevor
Simmons
 *de
*de
aDepartment of Mechanical, Aerospace and Nuclear Engineering, Rensselaer Polytechnic Institute, 110 8th Street, Troy, NY 12180, USA
bDepartment of Materials Science and Engineering, Rensselaer Polytechnic Institute, 110 8th Street, Troy, NY 12180, USA
cDepartments of Chemistry and Chemical Biology, Chemical and Biological Engineering, Biology and Biomedical Engineering, Center for Biotechnology and Interdisciplinary Studies, Rensselaer Polytechnic Institute, 110 8th Street, Troy, NY 12180, USA
dCenter for Future Energy Systems, Rensselaer Polytechnic Institute, 110 8th Street, Troy, NY 12180, USA. E-mail: simmot@rpi.edu
eHeparin Applied Research Center, Rensselaer Polytechnic Institute, 110 8th Street, Troy, NY 12180, USA
First published on 9th November 2017
Abstract
The recovery and repurposing of biomass are critically important and make a significant contribution to environmental preservation. Lignosulfonate, a by-product of the paper manufacturing industry, is an abundant low cost material with unique potential as a sulfur precursor for high performance cathode materials. In this work, we develop a practical green method of using lignosulfonate as both the donor (decomposition of sulfonic groups (–SO3H)) of sulfur and the sulfur acceptor in lignosulfonate derived activated carbon. Through a circulatory pyrolysis process with carbon activation and sulfur capture, a high surface area carbon/sulfur composite was obtained. This material was successfully developed into a cathode for a lithium–sulfur battery, which demonstrates outstanding cycling stability with a capacity decay rate as low as 0.1% per cycle over 200 cycles. When the sulfur loading was further increased to 68 wt%, the capacity still reaches as high as 1100 mA h g−1, suggesting its promising potential for applications in the field of high energy storage devices.
1. Introduction
Driven by the rapid technology advancement and requirement for ever decreasing size of portable electronic devices, the development of high-energy-density and long-lasting rechargeable batteries is a constant research priority. There is a great need to go beyond the energy density limits (∼180 W h kg−1) of conventional lithium ion battery technology.1 In order to address the imbalance of supply and demand, various advanced electrode materials are broadly developed. Examples of such materials are nanostructured silicon anodes and transition metal oxide cathodes.2,3 Novel energy storage systems including Li–air (energy density: ∼500–900 W h kg−1) and Li–sulfur (energy density: ∼400–600 W h kg−1) are expected to provide much higher energy density than traditional battery systems with graphite anodes and metal oxide cathodes.4–7 Carbon materials such as activated carbon, carbon nanotubes, and graphene have played an important role as an electrode material in energy storage devices due to their superior electrical conductivity, high surface area, controllable surface chemistry, and low cost.8–10 Besides, carbon based materials are easy to combine with other materials to achieve synergistic effects and improve the electrochemical performances of batteries further.11–14 Nanoporous carbon structures can also be used as a gas diffusion channel for fast oxygen transport in promoting the performance of Li–air cells,10 confining the diffusion of soluble lithium polysulfides, and improving the kinetics of sulfur redox in Li–S batteries.15,16Porous activated carbon is one of the promising materials for lithium sulfur (Li–S) batteries, which can be prepared from various precursors, such as biomass materials that are abundant, inexpensive, and environmentally friendly compared with expensive precursors and artificial templates.17 Recent studies have sought to employ biomass materials to improve the performance of lithium sulfur batteries. For example, Yao et al. used crab shells as sustainable templates for nanostructured electrodes with nanochannel arrays to host sulfur.18 Zhang et al. obtained hierarchical porous carbon materials derived from silk cocoons, which were combined with commercial sulfur in different proportions for use as sulfur cathodes.19 Porous activated carbon with a large pore volume and high specific surface area was prepared from waste litchi shells and used as a sulfur host for Li–S batteries.20 Typically in these studies, nanostructured carbon is first synthesized and then mixed with commercial sulfur from the petroleum industry by melt–diffusion processes to construct carbon–sulfur composite cathodes.
Lignin is a complex polyphenol present in vascular plants and algae and comprises approximately 20–40% of the dry mass of wood where it plays an important structural role in cell walls.21,22 The pulping of wood fibers in the paper industry typically includes the removal of lignin through the use of sulfuric acid (kraft process) or sulfurous acid (sulfite process), which converts insoluble lignin to soluble lignosulfonates. As a principal by-product of the modern papermaking industry, lignosulfonates are produced in excess in most industrial facilities and are typically burned for sulfur recovery and heat generation. In this work, inspired by the chemical component of lignosulfonate (ESI, Fig. S1†), we develop a simple and practical method of using lignosulfonate as the donor (sulfonic groups (–SO3H)) of sulfur as well as the sulfur acceptor in lignosulfonate derived activated carbon. Through a circulatory pyrolysis, activation, and sulfur capture, a porous carbon/sulfur composite was obtained. This material was successfully employed as a cathode material for a Li–S battery system with high capacity and long cycle life.
2. Experimental
2.1. Synthesis of pyrolytic lignosulfonate (PyLs)
Water-based solutions of as-produced lignosulfonate (Ls) “brown liquor” were provided by Finch Paper LLC (Glens Falls, NY, USA). The brown liquor (ESI, Fig. S2†) was dried in a vacuum oven and then mechanically pulverized with a ceramic mortar and pestle. The powder was pyrolyzed at 250 °C for 1 h followed by treating at 700 °C under an inert argon atmosphere for several hours in a quartz tube furnace (the pyrolytic reaction flow diagram of lignosulfonate is shown in ESI, Fig. S3a†). The PyLs powder was collected and then placed into a 50 mL alumina jar with zirconia balls (mixture of 8, 10, and 11.5 mm diameter) and ball-milled for 1 h in a high-speed vibrating ball mill (MTI, Richmond, CA, USA).2.2. Synthesis of activated PyLs (Act PyLs)
The as-synthesized PyLs was further activated with KOH, which was carried out by heating the mixture of carbon and KOH with a mass ratio of 1![[thin space (1/6-em)]](https://www.rsc.org/images/entities/char_2009.gif) :
:![[thin space (1/6-em)]](https://www.rsc.org/images/entities/char_2009.gif) 3. The mixture was heated to the activation temperature of 700 °C under an argon atmosphere in a quartz tube furnace. Finally, the mixture was washed several times with diluted hydrochloric acid and then with sufficient de-ionized water at room temperature. After drying at 80 °C in an oven for 12 h, Act PyLs was collected for the next steps. The yield of Act PyLs was 60% of the reactant PyLs.
3. The mixture was heated to the activation temperature of 700 °C under an argon atmosphere in a quartz tube furnace. Finally, the mixture was washed several times with diluted hydrochloric acid and then with sufficient de-ionized water at room temperature. After drying at 80 °C in an oven for 12 h, Act PyLs was collected for the next steps. The yield of Act PyLs was 60% of the reactant PyLs.
2.3. Synthesis of the Act PyLs/sulfur composite
An Act PyLs captured sulfur (Act PyLs-Cap S) sample was obtained after the sulfur capture process. During the second pyrolysis step, the as-synthesized Act PyLs was put into the downstream cold zone of the quartz tube furnace during the pyrolysis of fresh lignosulfonate powder. Therefore, the Act PyLs-Cap S sample, and a new batch of PyLs which could be used as the raw material in the next activation process, were obtained. Additional sulfur was impregnated into the Act PyLs-Cap S sample by mixing (weight ratio of 1![[thin space (1/6-em)]](https://www.rsc.org/images/entities/char_2009.gif) :
:![[thin space (1/6-em)]](https://www.rsc.org/images/entities/char_2009.gif) 1) with elemental sulfur (Alfa Aesar) and heating to 155 °C for several hours, and the Act PyLs-Cap S + S sample was obtained.
1) with elemental sulfur (Alfa Aesar) and heating to 155 °C for several hours, and the Act PyLs-Cap S + S sample was obtained.
2.4. Cathode preparation and electrochemical testing
Coin cells (2032-type) were used to assemble test cells in an Ar-filled glovebox (MBraun Labstar). A homogeneous slurry (80 wt% Act PyLs-Cap S or Act PyLs-Cap S + S as the active material, 10 wt% carbon black as the conductive agent and 10 wt% PVDF as the binder dissolved in N-methyl-2-pyrrolidone (NMP)) was spread on Al foil by using a doctor blade. The thickness of the electrodes was adjusted with the height of the coating blade (ESI, Fig. S4†). For comparison, a pure S electrode was also fabricated with a similar sulfur concentration to the Act PyLs-Cap S + S electrode (56 wt% sulfur (Alfa Aesar) as the active material, 34 wt% carbon black as the conductive agent and 10 wt% PVDF as the binder dissolved in NMP). A total of 40 μL (20 μL on the cathode side and 20 μL on the anode side) of 1 M lithium bis(trifluoromethanesulfonyl)imide in 1,3-dioxolane and 1,2-dimethoxyethane (1![[thin space (1/6-em)]](https://www.rsc.org/images/entities/char_2009.gif) :
:![[thin space (1/6-em)]](https://www.rsc.org/images/entities/char_2009.gif) 1 by volume) with a 0.1 mol L−1 LiNO3 additive was used as the electrolyte. The mass loading of the electrodes was ∼2 mg cm−2 unless otherwise stated. As for the high loading electrode test, the sulfur loading of the Act PyLs-Cap S + S electrode was ∼3.5 mg cm−2. And the specific capacities were calculated using the weight of sulfur. An Arbin BT2000 battery instrument was used to perform galvanostatic charge–discharge cycles at various current densities over the voltage range from 1.5 to 2.8 V (vs. Li/Li+). A Gamry Instruments potentiostat was used to perform cyclic voltammetry at a scan rate of 0.2 mV s−1.
1 by volume) with a 0.1 mol L−1 LiNO3 additive was used as the electrolyte. The mass loading of the electrodes was ∼2 mg cm−2 unless otherwise stated. As for the high loading electrode test, the sulfur loading of the Act PyLs-Cap S + S electrode was ∼3.5 mg cm−2. And the specific capacities were calculated using the weight of sulfur. An Arbin BT2000 battery instrument was used to perform galvanostatic charge–discharge cycles at various current densities over the voltage range from 1.5 to 2.8 V (vs. Li/Li+). A Gamry Instruments potentiostat was used to perform cyclic voltammetry at a scan rate of 0.2 mV s−1.
2.5. Material characterization
The morphology and structure of the materials were investigated by using a scanning electron microscope (SEM) (Nova Nano SEM 430, 10 kV/5 kV). Semi-quantitative elemental analysis was performed by energy dispersive X-ray spectroscopy (EDX). Transmission electron microscopy (TEM) was carried out with a JEOL JEM-2011. X-ray photoelectron spectroscopy (XPS) was performed by using a PHI 5400 X-ray photoelectron spectrometer equipped with a monochromatic Al Kα source (λ = 1486.7 eV). Raman spectroscopy was performed by using a Witec Alpha 300R confocal Raman imaging system. X-ray diffraction (XRD) was performed by using a Bruker D8-DISCOVER with a Cu Kα radiation source and a pyrolytic graphite monochromator. The surface area and sample porosity were evaluated by using nitrogen adsorption/desorption isotherms obtained with a Quantachrome ASiQ. The samples are evaluated by physisorption with liquid nitrogen at 77 K using Barrett–Emmett–Teller calculations for the estimation of the surface area. Density functional theory was used to analyze the pore size distribution. Thermogravimetric analysis was performed using a computer-controlled TA Instruments TGA Q50 apparatus under a nitrogen atmosphere.3. Results and discussion
The whole pyrolysis process of lignosulfonate (Ls) was divided into three steps in our experiment (ESI, Fig. S3a†). In the first step (150 °C), water was evaporated. During the second step (250 °C), several reactions occur including full dehydration, demethoxylation, demethylation and decarboxylation of lignosulfonate, thereby releasing water, alkyls, CO2 and CO at this stage.23 Besides, due to the presence of sulfonic acid groups (ESI, Fig. S1†), a large amount of SO2 would also be released during this step,24 as shown in the following reaction:| R-SO3H → R′ + ′SO3H → SO2 + ′OH | (1) |
Furthermore, SO2 would be reduced to S by a series of reducing gases formed in this step, such as alkyls (CH4) and CO.25
| SO2 + CH4 → CO2 + 2H2O + 2S | (2) |
| SO2 + 2CO → S + 2CO2 | (3) |
We could see sulfur condensed on the reaction quartz tube clearly (ESI, Fig. S3b†). Further increasing temperature (the third step) will promote the complete thermal decomposition of Ls. So during the pyrolysis process of Ls, the elemental sulfur will gasify and spread out. Meanwhile, the PyLs that remains forms an activated carbon-like structure. Inspired by the strong gas adsorption capability of porous activated carbon, we recognized that PyLs could serve as a good host to capture the escaped sulfur vapor after pyrolysis followed by activation. After the sulfur capture process, the obtained PyLs could be used as the raw material for the subsequent activation step. After treatment with potassium hydroxide (KOH), PyLs will turn into a porous carbon material with a high specific surface area (Act PyLs). The Act PyLs can be recycled in the further sulfur capture process. The schematic illustration of the synthesis procedure of the activated carbon/sulfur composite (Act PyLs-Cap S, captured sulfur) is shown in Fig. 1. Pyrolysis, capturing sulfur and activation constitute a sustainable and green process without consuming any expensive reagents.
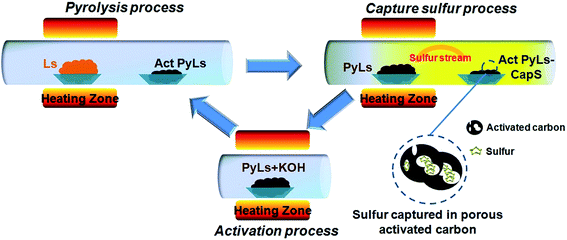 | ||
| Fig. 1 Schematic illustration of the circulatory synthesis procedure of the Act PyLs-Cap S composite. | ||
High surface area materials with relatively large micropore diameters are required to achieve high levels of sulfur deposition in the porous carbon framework of the carbon/sulfur composite.26,27 In this work, KOH activation was used to substantially increase the surface area and to tune the pore sizes present in the PyLs. After heating the mixture of PyLs and KOH with a mass ratio of 1![[thin space (1/6-em)]](https://www.rsc.org/images/entities/char_2009.gif) :
:![[thin space (1/6-em)]](https://www.rsc.org/images/entities/char_2009.gif) 3 at 700 °C for 2 h under an argon atmosphere, carbon was oxidized to carbon oxide/carbonate and potassium hydroxide can be completely transformed to potassium carbonate and then decomposed into carbon dioxide and potassium oxide. The reaction equations could be described as follows:27
3 at 700 °C for 2 h under an argon atmosphere, carbon was oxidized to carbon oxide/carbonate and potassium hydroxide can be completely transformed to potassium carbonate and then decomposed into carbon dioxide and potassium oxide. The reaction equations could be described as follows:27
| 6KOH + 2C → 2K + 3H2 + 2K2CO3 | (4) |
| K2CO3 → K2O + CO2 | (5) |
Scanning electron microscopy (SEM) and transmission electron microscopy (TEM) were used to investigate the structure of PyLs and Act PyLs. As shown in Fig. 2a and b, there is no obvious change in the surface morphology after the activation procedure. After washing with acid and deionized water, there are no residual impurities left in the Act PyLs sample (ESI, Fig. S5†). The disordered porous structure of Act PyLs is apparent in the TEM images (Fig. 2c and d), confirming that a dense network of pores has been formed within the carbon framework, which is also consistent with the N2 adsorption/desorption isotherms shown in Fig. 3.
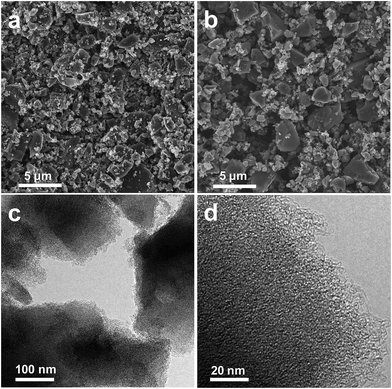 | ||
| Fig. 2 SEM images of (a) PyLs and (b) Act PyLs. (c, d) TEM images of Act PyLs under different magnifications. | ||
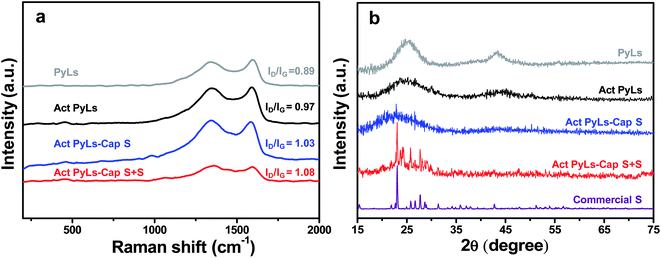 | ||
| Fig. 3 (a) Raman spectra of the PyLs, Act PyLs, Act PyLs-Cap S and Act PyLs-Cap S + S samples. (b) XRD patterns of the PyLs, Act PyLs, Act PyLs-Cap S, Act PyLs-Cap S + S and commercial S samples. | ||
After capturing sulfur, the Act PyLs-Cap S shows no significant change in the morphology; however, energy dispersive X-ray (EDX) mapping indicates that substantial quantities of sulfur have been captured by the Act PyLs sample (Fig. S6a–d†). From to the elemental mappings, we could see that the sulfur distribution is consistent with carbon. To further investigate the sulfur adsorption capacity in the Act PyLs, sulfur was added at a mass ratio of 1![[thin space (1/6-em)]](https://www.rsc.org/images/entities/char_2009.gif) :
:![[thin space (1/6-em)]](https://www.rsc.org/images/entities/char_2009.gif) 1 to the Act PyLs-Cap S sample, resulting in a sulfur saturated material Act PyLs-Cap S + S. From the micrograph shown in Fig. S6e,† the material surface did not exhibit any apparent aggregation of sulfur outside the carbon matrix, suggesting that the Act PyLs-Cap S is capable of adsorbing the majority of the added sulfur. Aggregated sulfur would be relatively easy to observe as these aggregates would accumulate charge during SEM imaging (no such charging phenomenon was observed) and sulfur elemental mapping (Fig. S6g†). The surface characteristics of the Act PyLs-Cap S sample were further investigated by XPS (X-ray photoelectron spectroscopy) as presented in ESI Fig. S7.† As shown in Fig. S7a,† O 1s (∼532.6 eV), C 1s (∼284.8 eV), S 2s (∼228.2 eV) and S 2p (∼164.5 eV) signals were detected in the XPS survey spectrum.9,28 Gaussian fits to the C 1s spectra of the Act PyLs-Cap S sample show three peaks but in different ratios (Fig. S7b†). The high-resolution C 1s profile consists of component peaks at 284.7, 285.6 and 288.1 eV, corresponding to carbon species of C–C/C
1 to the Act PyLs-Cap S sample, resulting in a sulfur saturated material Act PyLs-Cap S + S. From the micrograph shown in Fig. S6e,† the material surface did not exhibit any apparent aggregation of sulfur outside the carbon matrix, suggesting that the Act PyLs-Cap S is capable of adsorbing the majority of the added sulfur. Aggregated sulfur would be relatively easy to observe as these aggregates would accumulate charge during SEM imaging (no such charging phenomenon was observed) and sulfur elemental mapping (Fig. S6g†). The surface characteristics of the Act PyLs-Cap S sample were further investigated by XPS (X-ray photoelectron spectroscopy) as presented in ESI Fig. S7.† As shown in Fig. S7a,† O 1s (∼532.6 eV), C 1s (∼284.8 eV), S 2s (∼228.2 eV) and S 2p (∼164.5 eV) signals were detected in the XPS survey spectrum.9,28 Gaussian fits to the C 1s spectra of the Act PyLs-Cap S sample show three peaks but in different ratios (Fig. S7b†). The high-resolution C 1s profile consists of component peaks at 284.7, 285.6 and 288.1 eV, corresponding to carbon species of C–C/C![[double bond, length as m-dash]](https://www.rsc.org/images/entities/char_e001.gif) C, C–O/C–S, and C
C, C–O/C–S, and C![[double bond, length as m-dash]](https://www.rsc.org/images/entities/char_e001.gif) O, respectively.29 Furthermore, by analyzing the S 2p spectrum in Fig. S7c,† the binding energy of S–S/S–C is at 163.7 eV and 164.9 eV.28,30 The peaks at 168.2 and 169.5 eV are due to the sulfate species formed by the sulfite oxidation in air, which come from SO2 in the S capture process.
O, respectively.29 Furthermore, by analyzing the S 2p spectrum in Fig. S7c,† the binding energy of S–S/S–C is at 163.7 eV and 164.9 eV.28,30 The peaks at 168.2 and 169.5 eV are due to the sulfate species formed by the sulfite oxidation in air, which come from SO2 in the S capture process.
Raman spectroscopy (Fig. 3a) was used to elucidate the specific chemical structure of the synthesized materials. Peaks were observed around 1340 cm−1, a region widely known as the D-band, and correspond to disordered/defective graphitic structures. Peaks at around 1590 cm−1, known as the G-band, correspond to highly ordered graphitic layers, and arise from the tangential vibration of the carbon atoms.29,31,32 The intensity ratio of these two peaks (ID/IG) of the PyLs (ID/IG = 0.89) is lower than that of Act PyLs (ID/IG = 0.97), which is likely due to the increase of the defects during the KOH activation process. After the incorporation of sulfur into the pores of the carbon matrix, the value of this ratio continues to increase, as the sulfur generates more disordered graphitic structures through deformation of the sp2 carbon lattice.33 The absence of sulfur peaks in the range of 100–500 cm−1, which are related to the symmetrical mode of the S–S bond vibration, suggests that sulfur has been well-dispersed in the Act PyLs-Cap S and Act PyLs-Cap S + S samples without long-range ordering.34,35 The reduced overall signal observed for Act PyLs-Cap S + S is due to increased absorbance of photons by the increased elemental sulfur within the sample. Fig. 3b shows the X-ray diffraction (XRD) patterns of the PyLs, Act PyLs, Act PyLs-Cap S, Act PyLs-Cap S + S and commercial S samples. Compared with PyLs and Act PyLs samples, the decreased intensity of the broadened (002) and (100) reflections (corresponding to diffraction peaks at around 2θ = 24°and 43°in the XRD patterns) suggested a lower degree of order due to KOH activation. This phenomenon is also consistent with the ID/IG ratio in Raman spectra (Fig. 3a). After sulfur capture and sulfur adding processes, XRD patterns of sulfur (JCPDS no. 08-0247) could be observed more clearly with the sulfur content increased in the Act PyLs-Cap S and Act PyLs-Cap S + S samples. No trace of other impurities was found within the detection limit of the instrument.
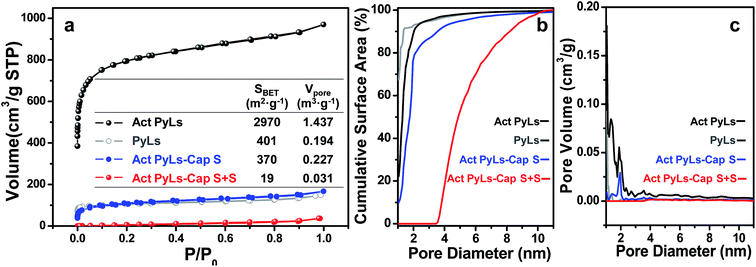
Nitrogen adsorption–desorption isotherms (Fig. 4) were obtained to evaluate the effect of each stage of processing on the pore structure of the samples. IUPAC type I isotherms without significant desorption hysteresis loops were observed as shown in Fig. 4a. As shown in the inset table, the Brunauer–Emmett–Teller (BET) specific surface area of Act PyLs calculated from this isotherm is ∼2970 m2 g−1 with a pore volume of ∼1.4 m3 g−1. Compared with the PyLs sample (∼400 m2 g−1 and ∼0.2 m3 g−1), the specific surface area and pore volume have been greatly enhanced after the KOH activation process. During the sulfur capture process, the abundant micropores of the Act PyLs sample effectively trapped sulfur vapor during the pyrolytic process of PyLs. The pronounced decrease in the surface area and loss of micropores (Fig. 4b and c) of the Act PyLs-Cap S sample confirm the subsequent sulfur impregnation, with sulfur occupying nearly all of the micropores and most of the mesopores in the Act PyLs.
The amount of sulfur loading was measured by thermogravimetric analysis (TGA, Fig. 5). During the sulfur capture process, the sulfur loading in the Act PyLs-Cap S sample could be up to 35 wt%. Additional sulfur saturation post-pyrolysis increased this value to nearly 70 wt%. To further confirm the sulfur capture ability of this material, a second capture process was carried out. It showed that the sulfur loading could be further increased (ESI, Fig. S8†). Compared with the thermo-gravimetric curve of commercial bulk sulfur (S8 allotrope), sulfur present in the micropores of the carbon matrix sublimes at a higher temperature, which is likely due to the strong interaction between micropores and sulfur.34
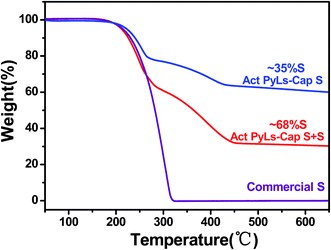 | ||
| Fig. 5 TGA results of sulfur loading in the Act PyLs-Cap S, Act PyLs-Cap S + S and commercial sulfur. | ||
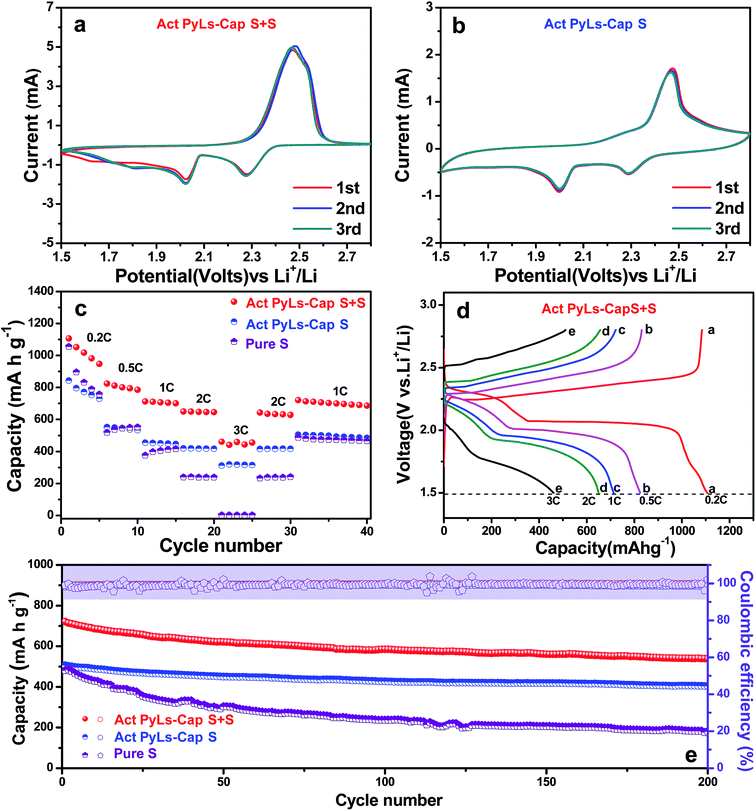
The electrochemical performance of the Act PyLs-Cap S and Act PyLs-Cap S + S as a cathode material for Li–S batteries was investigated in a coin-cell configuration countered with a metallic lithium anode. The cyclic voltammetry (CV) curves of the battery were obtained over a voltage range from 1.5 to 2.8 V at a scan rate of 0.2 mV s−1, as shown in Fig. 6a and b. Both electrodes show two reduction peaks at around 2.3 V (the transformation of sulfur (S8) to high-order lithium polysulfides (Li2Sx, 3 ≤ x ≤ 8)) and 2.0 V (the transformation of high-order lithium polysulfides (Li2Sx, 3 ≤ x ≤ 8) to Li2S2/Li2S).36 The wide oxidation peak during the anodic scan could be ascribed to the oxidation of Li2S2/Li2S to lithium polysulfides (Li2Sx, 3 ≤ x ≤ 8) and then to elemental sulfur.37 The rate capability is shown in Fig. 6c. The Act PyLs-Cap S + S electrode exhibits an initial capacity above 1100 mA h g−1, which is higher than that of the Act PyLs-Cap S electrode (∼850 mA h g−1) at 0.2C. This is mainly due to the fact that we have controlled similar sulfur areal loading (∼2 mg cm−2) of different samples (Act PyLs-Cap S, Act PyLs-Cap S + S and pure S electrodes), and the electrodes have different thicknesses through adjusting the coating blade (ESI, Fig. S4†). The thickness of the Act PyLs-Cap S electrode was nearly twice the thickness of the Act PyLs-Cap S + S electrode, which will affect the capacity. Secondly, in the Act PyLs-Cap S sample, the sulfur mainly existed as small clusters deep within the micropores which will influence the utilization ratio of sulfur due to its location deep within the tortuous micropores. Upon increasing the current density, the specific capacities of the Act PyLs-Cap S + S electrode are about 810, 710, 650 and 450 mA h g−1 at rates of 0.5, 1.0, 2.0 and 3.0C, respectively. When the rates return to the lower current densities, the capacities could be restored to their former levels suggesting that the physical and chemical structure of the electrodes remains stable at high current densities. While the initial specific capacity of the pure S electrode could reach above 1000 mA h g−1 (similar to that of the Act PyLs-Cap S + S electrode), the specific capacities decrease very fast as the current density is increased. The galvanostatic charge/discharge curves of the Act PyLs-Cap S + S electrode at different current densities have also been presented in Fig. 6d. The typical two-plateau discharge behavior corresponds to the formation of lithium polysulfides (Li2Sx, 3 ≤ x ≤ 8) at the high plateau and the conversion of Li2Sx (3 ≤ x ≤ 8) to Li2S2/Li2S at the lower plateau,38 which correspond to the CV results (Fig. 6a). Due to the increased over-potential with large kinetic barriers caused by the porous electrode material, separations between the discharge plateaus and charge plateaus were enlarged with increasing current density.39 The cycling performance of these cells is shown in Fig. 6e. In the case of the Act PyLs-Cap S + S electrode, the discharge capacity in the first cycle at 1C is 720 mA h g−1. Interestingly, after 200 cycles, the reversible capacity remains at around 540 mA h g−1 with a coulombic efficiency of 99%, demonstrating a capacity decay rate of 0.14% per cycle. In contrast, the discharge capacity of the Act PyLs-Cap S cathode changes from 506 to 405 mA h g−1 with a capacity decay rate of 0.1% per cycle after 200 cycles. This reduced loss of performance for the Act PyLs-Cap S materials is likely because the majority of the sulfur is located within the micropores. These micropores effectively trap the sulfur during the charge and discharge processes accompanied by the electrolyte flushing, while the Act PyLs-Cap S + S cathode has a substantial amount of sulfur present in the macropores which is susceptible to wash out during cycling. To further improve the energy density of the whole battery, an Act PyLs-Cap S + S electrode with an increased active material loading from ∼2.0 mg cm−2 to ∼3.5 mg cm−2 was used. The initial capacity was about 1000 mA h g−1, and with increasing current density, the specific capacities of this high sulfur loading Act PyLs-Cap S + S electrode are about 650, 540, 460 and 290 mA h g−1 at rates of 0.5, 1.0, 2.0 and 3.0C, respectively (ESI, Fig. S9a†). After 200 cycles, the reversible capacity remains at around 410 mA h g−1 with a capacity decay rate of 0.18% per cycle, which is slightly larger than that of the Act PyLs-Cap S + S electrode with 2 mg cm−2 sulfur loading (ESI, Fig. S9b†), while the capacity decay of the pure S electrode is very large accompanied by unstable coulombic efficiency.
4. Conclusion
As a proof-of-concept demonstration, we have developed a carbon/sulfur cathode by using raw lignosulfonate brown liquor as a precursor material that yields a high surface area carbon loaded sulfur cathode. The initial pyrolysis generates a porous carbon matrix that then acts as a sulfur acceptor while fresh lignosulfonate acts as a sulfur donor. Through this circulatory pyrolysis process, sulfur is effectively trapped in the highly porous structure of activated pyrolyzed lignosulfonate. The micropores provide sufficient space to capture substantial amounts of sulfur and accommodate the large volume change of sulfur during cycling. By introducing additional sulfur, the energy density was further improved. This work demonstrates the potential of using industrial paper mill byproducts for the rational design of advanced electrode materials for Li–S batteries.Conflicts of interest
There are no conflicts to declare.Acknowledgements
N.·K., T. S. and L. H. acknowledge funding support (contract number is 38314) from the New York Energy Research and Development Authority (NYSERDA), along with matching funds from Empire State Development's Division of Science, Technology and Innovation (NYSTAR) for the New York State Center for Future Energy Systems (CFES).References
- Y. Tang, Y. Zhang, W. Li, B. Ma and X. Chen, Chem. Soc. Rev., 2015, 44, 5926–5940 RSC.
- L. Ji, Z. Lin, M. Alcoutlabi and X. Zhang, Energy Environ. Sci., 2011, 4, 2682–2699 CAS.
- Z.-S. Wu, G. Zhou, L.-C. Yin, W. Ren, F. Li and H.-M. Cheng, Nano Energy, 2012, 1, 107–131 CrossRef CAS.
- P. G. Bruce, S. A. Freunberger, L. J. Hardwick and J.-M. Tarascon, Nat. Mater., 2012, 11, 19–29 CrossRef CAS PubMed.
- A. Manthiram, Y. Fu and Y.-S. Su, Acc. Chem. Res., 2012, 46, 1125–1134 CrossRef PubMed.
- L. Carbone, S. G. Greenbaum and J. Hassoun, Sustainable Energy & Fuels, 2017, 1, 228–247 CAS.
- T. Zhou, W. Lv, J. Li, G. Zhou, Y. Zhao, S. Fan, B. Liu, B. Li, F. Kang and Q.-H. Yang, Energy Environ. Sci., 2017, 10, 1694–1703 CAS.
- D.-W. Wang, Q. Zeng, G. Zhou, L. Yin, F. Li, H.-M. Cheng, I. R. Gentle and G. Q. M. Lu, J. Mater. Chem. A, 2013, 1, 9382–9394 CAS.
- T. Liu, R. Kavian, Z. Chen, S. S. Cruz, S. Noda and S. W. Lee, Nanoscale, 2016, 8, 3671–3677 RSC.
- Z. Wen, C. Shen and Y. Lu, ChemPlusChem, 2015, 80, 270–287 CrossRef CAS.
- T. Chen, B. Cheng, G. Zhu, R. Chen, Y. Hu, L. Ma, H. Lv, Y. Wang, J. Liang, Z. Tie, Z. Jin and J. Liu, Nano Lett., 2017, 17, 437–444 CrossRef CAS PubMed.
- T. Chen, L. Ma, B. Cheng, R. Chen, Y. Hu, G. Zhu, Y. Wang, J. Liang, Z. Tie, J. Liu and Z. Jin, Nano Energy, 2017, 38, 239–248 CrossRef CAS.
- L. Ma, R. Chen, G. Zhu, Y. Hu, Y. Wang, T. Chen, J. Liu and Z. Jin, ACS Nano, 2017, 11, 7274–7283 CrossRef CAS PubMed.
- T. Chen, Z. Zhang, B. Cheng, R. Chen, Y. Hu, L. Ma, G. Zhu, J. Liu and Z. Jin, J. Am. Chem. Soc., 2017, 139, 12710–12715 CrossRef CAS PubMed.
- X. Ji, K. T. Lee and L. F. Nazar, Nat. Mater., 2009, 8, 500–506 CrossRef CAS PubMed.
- D.-W. Wang, G. Zhou, F. Li, K.-H. Wu, G. Q. Lu, H.-M. Cheng and I. R. Gentle, Phys. Chem. Chem. Phys., 2012, 14, 8703–8710 RSC.
- M. K. Rybarczyk, H.-J. Peng, C. Tang, M. Lieder, Q. Zhang and M.-M. Titirici, Green Chem., 2016, 18, 5169–5179 RSC.
- H. Yao, G. Zheng, W. Li, M. T. McDowell, Z. Seh, N. Liu, Z. Lu and Y. Cui, Nano Lett., 2013, 13, 3385–3390 CrossRef CAS PubMed.
- B. Zhang, M. Xiao, S. Wang, D. Han, S. Song, G. Chen and Y. Meng, ACS Appl. Mater. Interfaces, 2014, 6, 13174–13182 CAS.
- S. Zhang, M. Zheng, Z. Lin, N. Li, Y. Liu, B. Zhao, H. Pang, J. Cao, P. He and Y. Shi, J. Mater. Chem. A, 2014, 2, 15889–15896 CAS.
- C. O. Tuck, E. Pérez, I. T. Horváth, R. A. Sheldon and M. Poliakoff, Science, 2012, 337, 695–699 CrossRef CAS PubMed.
- Y. Zhai, C. Li, G. Xu, Y. Ma, X. Liu and Y. Zhang, Green Chem., 2017, 19, 1895–1903 RSC.
- B. Li, W. Lv, Q. Zhang, T. Wang and L. Ma, J. Anal. Appl. Pyrolysis, 2014, 108, 295–300 CrossRef CAS.
- W. M. G. M. van Loon, J. J. Boon and B. de Groot, Environ. Sci. Technol., 1993, 27, 2387–2396 CrossRef CAS.
- T. Zhu, L. Kundakovic, A. Dreher and M. Flytzani-Stephanopoulos, Catal. Today, 1999, 50, 381–397 CrossRef CAS.
- N. Jayaprakash, J. Shen, S. S. Moganty, A. Corona and L. A. Archer, Angew. Chem., Int. Ed., 2011, 123, 6026–6030 CrossRef.
- J. Wang and S. Kaskel, J. Mater. Chem., 2012, 22, 23710–23725 RSC.
- G. Zhou, E. Paek, G. S. Hwang and A. Manthiram, Nat. Commun., 2015, 6, 7760 CrossRef CAS PubMed.
- G. M. Zhou, L.-C. Yin, D.-W. Wang, L. Li, S. Pei, I. R. Gentle, F. Li and H.-M. Cheng, ACS Nano, 2013, 7, 5367–5375 CrossRef CAS PubMed.
- Z. Wang, Y. Dong, H. Li, Z. Zhao, H. Bin Wu, C. Hao, S. Liu, J. Qiu and X. W. Lou, Nat. Commun., 2014, 5, 5002 CrossRef CAS PubMed.
- Z. Li, Z. Xu, X. Tan, H. Wang, C. M. B. Holt, T. Stephenson, B. C. Olsen and D. Mitlin, Energy Environ. Sci., 2013, 6, 871–878 CAS.
- J. Xu, Q. Gao, Y. Zhang, Y. Tan, W. Tian, L. Zhu and L. Jiang, Sci. Rep., 2014, 4, 5545 CrossRef CAS PubMed.
- T. Bordjiba, M. Mohamedi and L. H. Dao, Adv. Mater., 2008, 20, 815–819 CrossRef CAS.
- L. Li, G. Zhou, L. Yin, N. Koratkar, F. Li and H.-M. Cheng, Carbon, 2016, 108, 120–126 CrossRef CAS.
- Y. Dong, S. Liu, Z. Wang, Y. Liu, Z. Zhao and J. Qiu, Nanoscale, 2015, 7, 7569–7573 RSC.
- Y. Lai, P. Wang, F. Qin, M. Xu, J. Li, K. Zhang and Z. Zhang, Energy Storage Materials, 2017, 9, 179–187 CrossRef.
- L. Li, L. Chen, S. Mukherjee, J. Gao, H. Sun, Z. Liu, X. Ma, T. Gupta, C. V. Singh, W. Ren, H.-M. Cheng and N. Koratkar, Adv. Mater., 2017, 29, 1602734 CrossRef PubMed.
- Z. Zhang, G. Wang, Y. Lai, J. Li, Z. Zhang and W. Chen, J. Power Sources, 2015, 300, 157–163 CrossRef CAS.
- K. Yang, Q. Gao, Y. Tan, W. Tian, W. Qian, L. Zhu and C. Yang, Chem.–Eur. J., 2016, 22, 3239–3244 CrossRef CAS PubMed.
Footnote |
| † Electronic supplementary information (ESI) available. See DOI: 10.1039/c7se00394c |
| This journal is © The Royal Society of Chemistry 2018 |

