New insights into evaluating catalyst activity and stability for oxygen evolution reactions in alkaline media†
Guangfu
Li
a,
Lawrence
Anderson
a,
Yanan
Chen
 ab,
Mu
Pan
b and
Po-Ya
Abel Chuang
 *a
*a
aDepartment of Mechanical Engineering, University of California, Merced, CA 95343, USA. E-mail: abel.chuang@ucmerced.edu
bState Key Laboratory Advanced Technology for Materials Synthesis and Processing, Wuhan University of Technology, Wuhan, 430070, China
First published on 27th October 2017
Abstract
The growing development of oxygen-evolution-reaction (OER) catalysts has increased the demand for robust evaluation protocols to identify promising candidates. In this work, we successfully establish an effective experimental protocol to quantify the intrinsic performance of OER catalysts in a standard thin-film rotating-(ring)-disk-electrode system. Furthermore, a new insight into the electric double layer (EDL) microstructure is gained to illustrate all experimental observations in alkaline media. The results indicate that IrO2 has 2.6-times higher activity than NiCo2O4, due to the improved reaction kinetics, charge transfer and O2-transport occurring in the EDL. However, after 10![[thin space (1/6-em)]](https://www.rsc.org/images/entities/char_2009.gif) 000 cycles of cyclic voltammetry (CV), NiCo2O4 shows much higher stability due to continuous EDL structural modifications. In particular, it is revealed that the EDL charging process, accompanied by the electrocatalytic OER, has a strong effect on catalyst–electrolyte interfacial behaviors, which, in turn, determine the accuracy of electrochemical measurement results. It is further found that the electrochemical surface area (ECSA) obtained from traditional CV measured capacitance cannot accurately reflect the actual reaction sites of various catalysts during the OER. This discrepancy exists mainly because of the EDL capacitance, which is referred to as the inner capacitance caused by less accessible active sites. Alternatively, a novel method based on in situ electrochemical impedance spectroscopy has demonstrated improved accuracy in obtaining potential-dependent ECSAs, comparable to ex situ Brunauer–Emmett–Teller surface area measurements.
000 cycles of cyclic voltammetry (CV), NiCo2O4 shows much higher stability due to continuous EDL structural modifications. In particular, it is revealed that the EDL charging process, accompanied by the electrocatalytic OER, has a strong effect on catalyst–electrolyte interfacial behaviors, which, in turn, determine the accuracy of electrochemical measurement results. It is further found that the electrochemical surface area (ECSA) obtained from traditional CV measured capacitance cannot accurately reflect the actual reaction sites of various catalysts during the OER. This discrepancy exists mainly because of the EDL capacitance, which is referred to as the inner capacitance caused by less accessible active sites. Alternatively, a novel method based on in situ electrochemical impedance spectroscopy has demonstrated improved accuracy in obtaining potential-dependent ECSAs, comparable to ex situ Brunauer–Emmett–Teller surface area measurements.
Introduction
The oxygen evolution reaction (OER) and hydrogen evolution reaction (HER) are pair electrochemical reactions for splitting water to generate oxygen and hydrogen, respectively. Compared with the HER, the OER suffers from major overpotential losses and thus has been the focus of extensive research efforts.1–5 Currently, among the major limitations for commercial application of proton exchange membrane water electrolysis are the usage of noble metal catalysts (such as IrO2 and RuO2) and their low performance.2,6,7 When the OER occurs in an alkaline medium, the loading of noble metal catalysts can be significantly reduced or completely removed. Over the past decade, significant progress in alkaline anion exchange membrane (AAEM) based techniques for water electrolysis has further increased the demand for more advanced OER catalysts.6–9 Unfortunately, reliable protocols to accurately evaluate catalysts are still lacking, which poses a challenge in quantifying and comparing the catalyst active area and performance.10 Common ex situ tools used in classical heterogeneous catalysis, such as the Brunauer–Emmett–Teller (BET) method and X-ray photoelectron spectra, are not credible due to the overlapping of electric double layers (EDLs) and blockage of active sites by the reactant, product, intermediates and/or supporting inert electrolyte.11–14 Furthermore, the EDL microstructure is constantly changed due to oxidation/dissolution of the oxide film during the OER.11–14 Moreover, in situ methods for evaluating the active catalyst area also pose significant challenges due to (i) unstable reaction interfaces arising from the high potential and strong oxidizing conditions, (ii) a multistep electron-transfer process with various intermediates, and (iii) varied transport behaviors depending on operating conditions and catalyst materials.15The primary goals of electrocatalytic research are to understand the interfacial behaviors of both faradaic electron-transfer reactions and non-faradaic charging processes in the EDL.16 One approach to achieving these goals is to develop state-of-the-art testing and diagnostic methods to explore the nature of the EDL. In general, major indicators for the OER should involve the redox couple potential, EDL capacitance, kinetic overpotential, Tafel slope, interfacial transport, polarization resistance, etc. When studying OER catalysts, an essential issue is how to precisely determine the electrochemical surface area (ECSA), which is currently known to be related to EDL capacitance.17,18 Cyclic voltammetry (CV) is the most popular way to determine the EDL capacitance of catalysts. This approach assumes that EDL charging is the only process in the studied potential range and no faradaic reaction takes place.17,19–22 However, for oxide materials, the dependence of capacitance on the applied potential and testing conditions, such as electrolyte pH and electron conductivity, is not clear, so the resulting error might be very large.17
In addition to initial catalyst activity, the stability of OER catalysts is equally important for commercial applications.1,14,23 Nonetheless, there are three key issues related to stability that are rarely addressed: (i) how to establish standardized testing protocols that can be used for assessing the stability of various OER catalysts, (ii) how to precisely quantify the performance change after stability tests, and (iii) how to understand the fundamental relationship between catalyst activity and stability.
Since Stonehart and Ross reported their novel work in 1976,24 thin film rotating disk (TF-RDE) and rotating ring-disk electrode (TF-RRDE) approaches in half cell testing have gained significant popularity and, to date, become the most widely used methods for electrocatalysis study.25,26 Compared to full cell testing, TF-RDE/RRDE does not require sophisticated skills and equipment to evaluate the electrocatalytic properties of newly developed materials, and provides a reliable means to study reaction kinetics and mechanisms in a well-controlled environment.26,27 In addition, the advantages of TF-RDE/RRDE include (i) quick sample evaluation, (ii) minimum catalyst quantity required, (iii) minimal influence of ohmic and mass diffusion losses, and (iv) facile electrode fabrication.
Researchers from a wide variety of backgrounds are devoting their attention to developing catalytic materials with a lower noble metal content and/or a more efficient utilization of the existing noble metal content. In alkaline media, IrO2 and Ni/Co based oxides have emerged as the most commonly studied electrocatalysts, due to their potential for OER application.9,21,28–30 However, there is a lack of benchmarking protocols, so the valid data in the open literature are highly scattered and performance comparison between various materials is difficult without a baseline material.2,30–33
Herein, we report our efforts to establish a benchmarking protocol to evaluate and compare the intrinsic performance of IrO2 and Ni/Co based materials in an alkaline medium. Based on TF-RDE observations, IrO2 shows higher OER activity but much lower stability than NiCo2O4. The newly developed measurement and diagnostic procedures in this work enable the difference in electrocatalytic behavior between the two materials to be explained in terms of EDL effects and resistance to OH−-, electron- and O2-transport at the reaction interface. Particularly, an in situ impedance-based method is developed to calculate the ECSA, which is related to the wide activity of OER catalysts.
Results and discussion
Reaction interface and benchmarking protocols
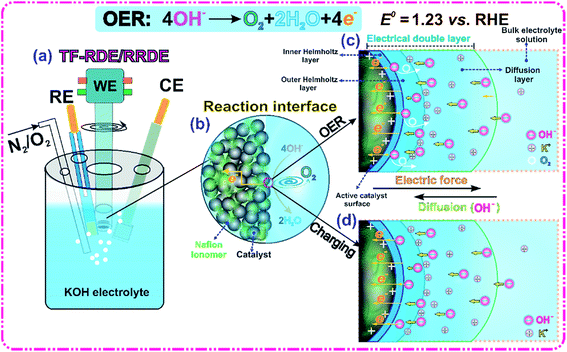
Our primary goal is to benchmark and compare the performance of various OER catalysts in alkaline media. A typical TF-RDE/RRDE system, shown in Fig. 1(a), was used to conduct the major electrochemical measurements. The potential calibration of the reference electrode (RE) against the reversible hydrogen electrode (RHE) was performed by CV in a H2-saturated 1 M KOH solution at room temperature. The calibration results are shown in Fig. S1 of the ESI.† Accordingly, all measured potentials in this work are reported relative to the RHE, which allows us to directly evaluate the OER overpotential independently of electrolyte pH.34A schematic representation of the reaction interface and EDL is shown in Fig. 1(b–d). At the applied OER potential, the active catalyst layer (CL) surface has excess positive charge that can enhance the adsorption of OH− ions through coulombic attraction. The major function of OER electrocatalysts is to facilitate the faradaic transition from OH− ions to electrons, water and O2 gas. The measured reaction rate is directly related to the number of active electrocatalyst sites, and the OH−-, electron- and O2-transport resistances in the EDL.11,35 The process of manufacturing the catalyst ink also has a significant impact on the electrode structure, which, in turn, determines the accessibility, stability and number of EDLs. To maximize catalyst utilization, the deposition of a thin film onto the conductive substrate is required to produce a uniformly distributed CL. Adding the Nafion ionomer to the CL can extend the reaction interface and serve as a catalyst binder.32,36,37 Furthermore, it is found that the zeta potential changes from −6.2 mV to −25.5 mV with increasing the ionomer to IrO2 catalyst weight ratio from 0 to 0.5. In principle, the measured zeta potential can be used to indicate the degree of electrostatic repulsion/attraction between particles in dispersion solution.38 The increase of absolute zeta potential demonstrates that adding Nafion improves ink stability and prevents large particle aggregation.
The interaction of adsorbed OH− ions with the charged interface forms an EDL, which is the location where the electrocatalytic OER occurs.16 Its thickness is generally on the order of several nanometers and a potential difference is generated across this thin layer.16 As illustrated in Fig. 1(c and d), the EDL is commonly known to consist of three layers: an inner Helmholtz plane (IHP), an outer Helmholtz plane and a diffusion layer.11,16,39 To maintain the rate of the OER, OH− ions should be supplied continuously to the IHP where electrons are transferred to the solid catalyst surface and the O2 produced diffuses into the bulk electrolyte solution. The transport resistance within the EDL should be minimized in the design of a high performance catalyst to allow efficient supply and removal of reactants and products. The EDL acts as a dielectric capacitor, which has the ability to accumulate aqueous OH− ions when an electric force is applied. It is worth pointing out that the capacitive current increases with the potential scan rate and cannot be ignored, especially at low faradaic reaction rates.16 Compared with pure capacitor charging processes, the presence of the OER complicates the EDL behavior because of uncertainties in O2 coverage, metal surface oxidation, reaction intermediate (MOH, MO and MOOH) adsorption, EDL microstructure reconstruction, etc.
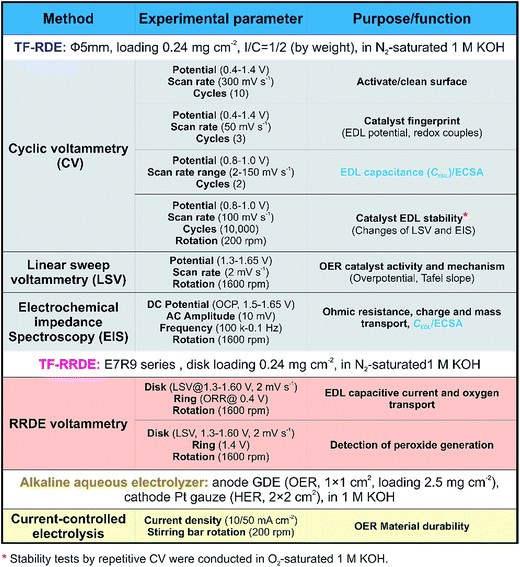
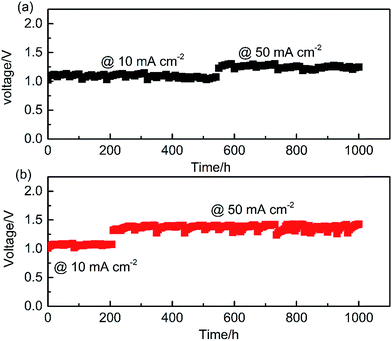
To characterize the activity, reaction mechanisms and long-term stability of OER catalysts, the proposed benchmarking protocol includes typical experiments using RDE, RRDE, and alkaline aqueous electrolyzer systems. The typical testing methods employed, and their corresponding experimental parameters, are presented in Fig. 2. For each method, proper design of experimental parameters is essential to producing accurate and reliable results. In this work, all measurements were conducted in 1 M KOH due to its high OH− activity.40 Before the TF-RDE/RRDE characterization, the material durability was evaluated using a gas diffusion electrode in an alkaline aqueous electrolyzer system, as shown in Fig. S2.† During 1000 hours of continuous operation at 10/50 mA cm−2, the measured cell voltage, shown in Fig. 3, remained stable, with minimum loss detected for both the IrO2 and NiCo2O4 catalysts.
Electrocatalyst activity
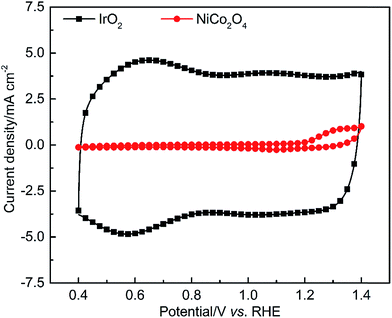
Experimental tests were performed using a TF-RDE to quantitatively study the electrocatalytic behaviors of IrO2 and NiCo2O4 in alkaline media. In cyclic voltammetry, the electrode potential is swept linearly between a lower and an upper potential, and the voltammograms obtained are often referred to as the unique electrochemical “fingerprint” spectra of various materials.16 In our measurements, an upper potential of 1.4 V was selected to prevent the OER and catalyst dissolution, while a lower potential of 0.4 V was selected to prevent any unexpected reduction reactions, such as the HER. A scan rate of 50 mV s−1 was selected to both efficiently avoid the limitation of mass transport in the EDL and reduce the time consumption for conducting such measurements. Since this is a non-steady state technique, the electrodes should be immobile and sit in the unstirred solution to maintain a controlled double layer interface. In this case, species diffusion is the only contributor to mass transport.16The current densities as a function of potential are plotted in Fig. 4. The detected current mainly results from (i) EDL capacitive current due to the charging/discharging process and (ii) faradaic pseudocapacitive current due to the solid-state redox reactions.41,42 In a potential window of 0.8–1.0 V, the CV shape of each studied material is close to a rectangular shape, confirming the EDL capacitive behavior. The overall CV curve of IrO2 appears more symmetric than that of NiCo2O4, indicating more reversible electrochemical behavior both in the EDL charging process and faradaic redox reaction due to lower polarization, ohmic and mass transport resistance.
Another important feature observed from CV is related to the pseudocapacitive behavior due to faradaic redox reactions of active elements. The characteristic curve of IrO2 exhibits broad oxidation peaks at around 0.65 V and 1.05 V, corresponding to the redox couples of IrIII/IrIV and IrIV/IrV (eqn (1)), respectively. In the case of Ni–Co oxide, only one well-defined oxidation/reduction peak is observed at ca. 1.30 V, which is attributed to the redox reactions of CoIII/CoIV as well as MII/MIII transitions (where M represents Ni or Co) at the reaction interface,43,44 as described in eqn (2) and (3), respectively. The potentials of these redox peaks are so close that a broader overlapping peak appears in the CV pattern.43,44 Furthermore, it is found that the current density of NiCo2O4 increases drastically when the redox reactions occur. This observation points to a transition from a non-conducting species of NiII (or CoII) to a conducting species of NiIII (or CoIII). The formation of NiII (or CoII) thus suppresses the EDL capacitive behavior, as reported by Costentin and coworkers.45
| IrOa(OH)b + δOH− ↔ IrOa(OH)(b+δ) + δe− | (1) |
| CoOOH + OH− ↔ CoO2 + H2O + e− | (2) |
| NiCo2O4 + OH− + H2O ↔ NiOOH + 2CoOOH + e− | (3) |
To further identify the pseudocapacitive characteristics of NiCo2O4, additional CV measurements were performed in an extended potential window of 0.8–1.45 V with increasing scan rates. Fig. 5 shows the relationship of current density (j) and potential (E) in the forms of j, j/ν0.5 and j/ν and their alterations with the scan rate (ν). It is assumed that j ∝ ν0, ν0.5 and ν1 can qualitatively indicate the kinetic control by catalytic reaction, diffusion-controlled redox reaction and EDL charging capacitance, respectively.45 At the CV positive/negative peak position, the relationship of j ∝ ν0.5, in Fig. 5(b), is confirmed at a relatively high scan rate, substantiating the pseudocapacitive behavior of NiCo2O4. In the first few CV scans (5–100 mV s−1), the increased value of j/ν0.5 with the scan rate can be ascribed to the increasing oxyhydroxide coverage and EDL reconstruction.1,46–48 However, Fig. 5(b) reveals that the pseudocapacitance decreases by 75% when the scan rate increases from 5 mV s−1 to 300 mV s−1, confirming the slow charge transfer process in the bulk material of NiCo2O4. At high scan rates, there is shorter time to respond to the rapid potential perturbation. For NiCo2O4, the high charge transfer resistance increases the difficulty for the redox reaction of solid-state catalysts to happen. As a result, only the outer surface is accessible for the reaction. In addition, the observed redox peak potential shifts with increasing scan rate; this demonstrates that polarization and transport resistance exist in the EDL during the potential scanning process.
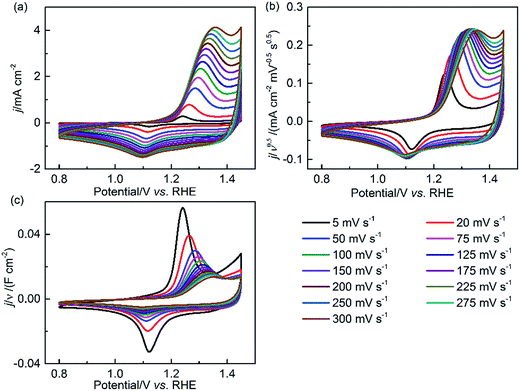 | ||
| Fig. 5 CV curves of NiCo2O4 in the 0.8–1.45 V potential window at various scan rates (ν) in 1 M KOH. The current density (j) is normalized by (a) ν0, (b) ν0.5 and (c) ν1, respectively. | ||
To quantify the OER activity, potential-controlled LSV tests were conducted in the TF-RDE system. The characteristics of the LSV curve depend on several key parameters, including the applied potential window, the scan rate, and the rotating speed of the working electrode (WE). Measurements began at 1.3 V, which is much lower than the onset potential of the OER. The final potential was set to 1.65 V, where mass transport is not yet a key factor for determining the reaction rate. Note that the potential scan rate (2 mV s−1) is much lower than that of the above fingerprint CV, since the non-faradaic capacitance current has a linear relationship with the scan rate. Therefore, the EDLs are closer to steady-state conditions, which limits the contribution of the EDL capacitive current. The electrode rotating speed was set to 1600 rpm, as reported in most literature studies, which facilitates O2 removal and OH− transport in EDLs.8,19,30 To characterize the influence of the WE substrate, the bared disk electrode was also examined using the same technique. As shown in Fig. 6(a), the current density of the bare RDE is negligible compared to that of the catalyst-loaded electrodes.
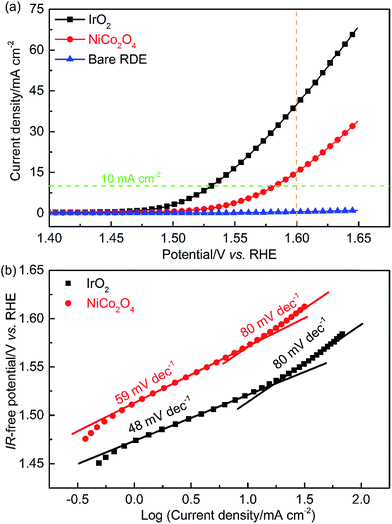 | ||
| Fig. 6 Evaluation of catalyst activity. (a) LSV curves at a scan rate of 2 mV s−1 and (b) IR-corrected Tafel plots. Symbols – raw data; lines – linear fit to the data. | ||
By integrating LSV results within the measured potential window,49 it was found that the IrO2 activity is around 2.6-times higher than that of NiCo2O4. At a current density of 10 mA cm−2, at which performance comparisons of a wide variety of catalysts have been commonly reported in the literature,9,12,19 the overpotentials without ohmic resistance correction were 300 and 350 mV, for IrO2 and NiCo2O4, respectively. These values agree with previously reported results.19,37 The specific and mass activity of IrO2 (NiCo2O4) at 1.6 V were about 39.0 (15.1) mA cm−2 and 162.5 (62.9) A g−1, respectively. It is important to note that the mass activity is strongly related to catalyst utilization. Our research further demonstrates that effective utilization of active species decreases as the catalyst loading increases (Fig. S3†). IrO2 with 0.08 mg cm−2 loading had around 3 times the mass activity of the same material with 0.72 mg cm−2 loading. It is highly possible that the combined effects of mass diffusion and EDL resulted in lower catalyst utilization at higher loading. Loading for evaluating novel OER catalysts typically ranges from 0.2 to 0.3 mg cm−2, as reported in the literature.50–52 Therefore, a loading of 0.24 mg cm−2 was selected for all TF-RDE and TF-RRDE measurements in this work to compare the performance of different catalysts.
To gain insights into the kinetics of the OER processes of the various catalysts, LSV performance curves were plotted as the IR-free potential vs. log(current density) as shown in Fig. 5(b). Two distinct linear trends can be observed in the lower and higher overpotential regions. The slope is referred to as the Tafel slope, which can be calculated according to the following equation:
| η = b × log(j) + a | (4) |
To determine the appropriate potential region for Tafel fitting, it is important to ensure that the current densities result from faradaic kinetic reactions. Both high potentials, at which oxygen bubbles block the active sites, and low potentials, at which the non-faradaic capacitive current results in an obvious contribution to the detected current, should be avoided.30 Prior to fitting, the potentials of each studied sample were corrected for ohmic resistance, which was obtained using EIS at the open circuit potential (OCP, 0 V vs. the RHE). In the TF-RDE system, the major contribution of ohmic resistance came from the bulk electrolyte solution and the distance between the RE and the WE. Nevertheless, a slight difference due to catalyst electrical resistance was observed between IrO2 and NiCo2O4 catalysts, as shown in Fig. S4.† The fitted ohmic resistances are 0.951 and 1.002 Ω cm2 for IrO2 and NiCo2O4, respectively, suggesting a lower electrical resistance of IrO2. Actually, IrO2 possesses metallic conductivity with an electrical resistivity of 6 × 10⁻⁵ Ω cm (for the bulk single crystal at 300 K), which is much smaller than that of the transition metal oxide, NiCo2O4 (∼0.016 Ω cm).42,53
It is well known that the OER is a 4-electron transfer reaction, which involves a sequence of steps and many intermediates, such as MO, MOOH or physisorbed peroxide species.1,15,54 Over the past several decades, various possible mechanisms have been proposed with notable early work. One of the most famous mechanisms is Krasil'shchikov's Path, which is described by eqn (5)–(8) with the corresponding Tafel slopes.55
| M + OH− ↔ MOH + e−, b = 120 mV dec−1 | (5) |
| MOH + OH− ↔ MO− + H2O, b = 60 mV dec−1 | (6) |
| MO− → MO + e−, b = 45 mV dec−1 | (7) |
| 2MO → 2M + O2, b = 19 mV dec−1 | (8) |
Based on the fitted Tafel slope, the rate-determining step (RDS) can be deduced reasonably. As shown in Fig. 6(b), at the near onset potential for the OER, the curves deviate from linearity due to the EDL charging current. The major difference between the two Tafel slopes appears in the low current density region, where the values are 48 and 59 mV dec−1 for IrO2 and NiCo2O4, corresponding to the RDS shown in eqn (7) and (6), respectively. The lower Tafel slope of IrO2 indicates reduced kinetic overpotential losses. On the one hand, this can be attributed to the increase of bond strength for OH− adsorption on IrO2, which accelerates the rate of the first electron reaction step shown in eqn (5) and, accordingly, improves electrocatalytic kinetics.1 On the other hand, the change in Tafel slopes can reflect the concentration of active sites and their contribution. For IrO2, the increase of active sites and their contribution may be the second reason for the reduced Tafel slope.
At higher current densities, the Tafel slopes changed to 80 mV dec−1 for both materials. This increase of Tafel slope can be attributed to four mechanisms: (i) increased mass transport resistances of OH−, electrons and/or O2, (ii) change in the RDS, (iii) adsorption of the reaction intermediates, and (iv) change of active sites and their contribution due to EDL reconstruction. The produced O2 bubbles blocking the available reaction interface will produce extra mass transport resistance, which prevents OH− adsorption and electron transport in the EDLs. To efficiently remove O2 bubbles and improve mass transport, a common practice is to increase the rotating speed of the WE. The data in Fig. S5(a)† indicate that the OER performance was slightly enhanced by increasing the rotating speed. Upon further analysis (results shown in Fig. S5(b)†), the Tafel slopes in the low (2–10 mA cm−2) and high (30–55 mA cm−2) current density regions decreased slightly as the rotating speed increased, except for that at 500 rpm at high current density. This confirms that, at a baseline rotating speed of 1600 rpm, the mass transport resistance caused by O2 bubbles was minimized.
ECSA evaluation via CV
Accurately quantifying the ECSA is important for determining catalyst activity, since the morphology-dependent OER predominantly occurs at the active surface. For an ideal compact oxide catalyst without a surface hydroxide phase, the surface area can be estimated from low-temperature N2 adsorption–desorption isotherms. Using the BET method, the results show that the surface area of IrO2 (32.5 mg cm−2) is 1.3 times higher than that of NiCo2O4 (24.7 mg cm−2). However, BET results cannot directly be used to determine the ECSA available for the OER.12 The discrepancy is often attributed to the blocking of pores, adsorbing of H2O molecules and hydrated OH− anions, and EDL reconstruction at the reaction interface during the OER.12,17Alternatively, it is commonly accepted that the ECSA has a linear relationship with the EDL capacitance caused by the interfacial charging process.18 For OER catalysts, the standard CV technique is often used in the literature to obtain surface capacitance.19,37,56,57 Note that it is significantly important to separate the solid-state pseudocapacitive and EDL capacitive contributions, namely, no faradaic oxidation/reduction reaction exists for studying the EDL capacitive behavior. In this case, the measured current is ascribed only to the surface-controlled capacitive behaviour, which is independent of the potential, as illustrated in Fig. 1(d). The EDL potential range (0.8–1.0 V) within which the CV curve exhibits a rectangular shape was determined from the “fingerprint” spectra in Fig. 4. Representative CV data for both catalysts are shown as a function of scan rate in Fig. S6.† This capacitive response is closely related to the EDL active area, which can be quantified as an impedance for electron transfer and OH− adsorption. The measured currents of IrO2 at the center of the applied potential window remained constant in each positive/negative scan segment. This reveals that the EDL charging process is sufficiently fast and stable. In contrast, a continuous increase of NiCo2O4 current was observed in a positive CV scan especially at a higher scan rate, confirming that this material cannot quickly respond to the applied potential to form a steady EDL for surface charge accumulation. The possible reasons are related to the slow charge transport in the less accessible EDLs and/or the continuously varied EDL microstructure during the voltammetry process. Based on the CV method, the EDL capacitance (C) can be calculated from the following the equation,19,58
 | (9) |
 is the total voltammetric area obtained by integration of positive and negative sweeps in each CV curve, and ν is the potential scan rate.
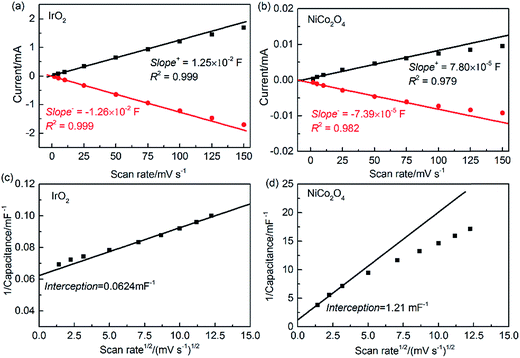
The single-point current at 0.898 V for each scan rate is reported in Fig. 7(a and b). According to eqn (9), the EDL capacitance can be estimated by linearly fitting the slopes of the scan rate data below 75 mV s−1. Taking the average of the absolute slope values from the anodic and cathodic sweeps, the resulting EDL capacitance values are 12.5 and 0.076 mF for IrO2 and NiCo2O4, respectively. Moreover, it can be observed that the deviation from linearity increases with the scan rate, which can be ascribed to the inner capacitance (Ci) caused by slow OH− penetration into the less accessible areas (such as micro-pores, corners, cracks and grain boundaries) and/or slow electron transfer. These capacitances cannot be fully measured at high scan rates, because the OH− diffusion and/or electron transport timescales are slower than the potential changing rate.18 Furthermore, in comparison to IrO2, NiCo2O4 shows more deviation from linearity at high scan rates. The pore structure of each catalyst sample was characterized using low-temperature N2 adsorption/desorption measurements. As shown in Table S1,† NiCo2O4 has a much lower total pore volume (0.0767 cm3 g−1) and smaller average pore diameter (18 nm) than IrO2 (pore volume, 0.248 cm3 g−1, and diameter, 30.2 nm). For these nanoscale pores, Knudson diffusion is the dominant transport mechanism and the diffusivity decreases with decreasing pore diameter.59 Therefore, NiCo2O4 should have increased OH− diffusion resistance compared to IrO2. Furthermore, the lower electron conductivity shown in Fig. S4† suggests that NiCo2O4 with increased inner capacitance would require more time for each of the charging/discharging processes to reach a steady state. Unfortunately, this single-point current method does not provide quantitative measures of inner capacitance.
Alternatively, the EDL capacitance can also be obtained by integrating the CV curve over the entire potential range for each scan rate using eqn (9). In order to quantify the total capacitance (Ct), the outer capacitance (Co), and their difference, Ci, we have developed a thorough analysis procedure (refer to the ESI†). Compared with the above single-point current method, this procedure has several advantages, including the following: (i) the integration method utilizes the entire range of CV data, (ii) a single capacitance is obtained for each scan rate, and (iii) C is measured as a function of scan rate. In principle, because of the low EDL resistance of IrO2, the linear fit should be avoided at low scan rates due to potential overlapping adsorption of OH− ions in the same position as well as the adsorption occurring at the inner and less accessible sites for the OER. In contrast, only the experimental data at low scan rates were taken into account for NiCo2O4. At high scan rates, distortion of the CV curve for EDL measurement occurs due to high charge transport resistances.
As shown in Fig. 7(c and d), the calculated Ct values are 16.0 and 0.826 mF for IrO2 and NiCo2O4, respectively. It is noteworthy that, using the integration method, the resulting Ct of NiCo2O4 is over 10 times larger than the capacitance obtained using the single-point current method. In addition, as the scan rate approaches infinity, it is assumed that OH− ions can diffuse only to the outer accessible active area during the charging/discharging process, so the inner and less accessible active sites are excluded.18,60 The values of Co obtained by extrapolating the integrated C as a function of ν from the plot of C vs. ν−1/2 are 6.71 and 0.0409 mF for IrO2 and NiCo2O4, respectively, as given in Fig. S7.† The ability to transfer OH− ions and electrons in the EDL can be expressed by the ratio of Co/Ct.60 This ratio is around 44% for IrO2 and 5% for NiCo2O4. This evaluation is consistent with the fact that NiCo2O4 has a much lower pore volume, smaller pore size and higher electron resistance, all of which are expected to increase the EDL resistance during the charging/discharging process.
The capacitance obtained is then compared to the reference areal capacitance Cs so that the ECSA can be calculated as
| ECSA = C/mCs | (10) |
In the case of IrO2, the much higher ECSA obtained by the CV integration method can be attributed to the interaction between the evaluation method and the nature of the material. This implies over-prediction of total capacitance and/or under-prediction of standard capacitance, Cs. The integration method provides an estimate of total capacitance (Ct), which also includes the capacitance due to OH− ion adsorption and intercalation in the inner and less accessible active sites. In this case, the capacitance is a result of the steady charging process and cannot be used to represent real active sites that are available at the fast rate of the OER. Furthermore, the standard capacitance, Cs, used to estimate the ECSA depends strongly on the applied materials and has a range of 0.2–1.3 F m−2 in 1 M OH− solution, as reported in the literature.19 Using the same standard capacitance Cs implies that the catalyst materials have similar EDL behaviors for charge transfer. Based on our study, IrO2 and NiCo2O4 have distinctly different EDL capacitive and pseudocapacitive behaviors and, therefore, should use different standard capacitances (Cs) for determining their ECSA. If alternative values of C (Co, 6.71 mF and Cs, 1.3 F m−2) are used, the ECSA of IrO2 can be estimated to be 110 m2 g−1, which is comparable to the BET measurement results. It is worth noting that the ECSA obtained from CV might change with the OER potential due to EDL reconstruction and/or gas bubble effects. In addition, the adsorption of reaction intermediates can further influence the actual active area during the OER.
ECSA evaluation via EIS
In order to address potential issues using the CV method, an in situ EIS method was developed to evaluate the ECSA. EIS is a useful analytical diagnostic tool, which is capable of evaluating various resistances associated with charge-transfer processes in the EDL.16,61 In an EIS test, the DC potential and AC perturbation are two key parameters, which determine the rate of the OER and EDL dynamic behavior, respectively.16 Based on the LSV results, four DC potentials (including 1.50, 1.55, 1.60 and 1.65 V) with an AC perturbation of 10 mV were selected for EIS testing and the Nyquist plots are shown in Fig. 8.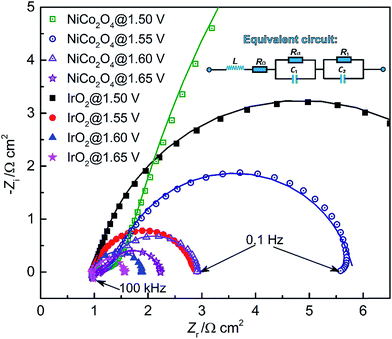 | ||
| Fig. 8 EIS spectra of IrO2 and NiCo2O4 at four applied DC potentials. Symbols – raw data; lines – linear fit to the data. The inset is the equivalent circuit. | ||
A full semi-circular loop was observed for each study case, indicating that no mass transport limitation occurred in the studied potential range.61 With the increase of applied DC potential, a decreased semi-circular diameter was observed, corresponding to an increase in the overpotential to drive interfacial OER processes. The intercept of high-frequency spectra and x-axis at zero imaginary impedance gives an estimate of the ohmic resistance, mainly arising from the bulk electrolyte solution. Meanwhile, the ohmic resistance increases slightly with the applied potential. This is caused by the generation of gas bubbles, which impedes the transport of OH−. In all Nyquist plots of NiCo2O4, the impedance at high frequency shows an increase at 45°, which corresponds to the effective OH− transport resistance.25 Such a response suggests that the OH− adsorption of NiCo2O4 is a limiting factor for the OER, which is consistent with the study of the RDS based on Tafel slopes.
An equivalent circuit is often introduced to study the impedance contribution from the faradaic process and EDL charging. The equivalent circuit we used is LRΩ (RctC1) (R1C2), where L, RΩ, Rct and C1 symbolize inductance, ohmic resistance, charge transfer resistance and EDL capacitance, respectively. The (R1C2) circuit represents the diffusion/adsorption of reaction intermediates due to slow diffusion through the reaction interface in a porous material.62 The intermediates, such as MOH, can be oxidized to MO during OER, resulting in the (R1C2) impedance in the low-frequency region in the semi-circle. The capacitive components are frequently replaced with constant phase elements (CPEs) to model depressed semi-circles arising from heterogeneities and porous surfaces.63 The CPE behavior may also be ascribed to a variation of properties in the direction normal to the catalyst surface. Such variability may involve changes in oxide conductivity and/or microstructure reconstruction.
In general, the impedance of a CPE can be expressed as
| ZCPE = 1/[Cf(iw)n] | (11) |
As shown in Fig. 8, the fitted results from the selected equivalent circuit coincide well with the experimental data. The fit values for each circuit element/parameter are given in Table S2 and S3 (refer to the ESI†). This reveals that the resistances (including RΩ, Rct and R1) of IrO2 are lower than those of NiCo2O4, which results in the enhanced OER performance of the IrO2 catalyst.
The EDL capacitance can be derived from the values fit to the impedance measurements. Combining electron transfer and OH− transport, the OER occurs on an oxidized catalyst surface that OH− can easily access.65 According to Chassaing et al.66 and Bidóia et al.,67 the CPE behavior associated with a surface distribution of time constants requires the contribution of ohmic and polarization resistances. Therefore, the EDL capacitance can be calculated using the equation63,64
 | (12) |
Fig. 9 shows the dependence of EDL capacitance on the applied potential, which reflects the actual surface area available at different OER rates. The capacitances of IrO2 and NiCo2O4 ranged between 1.77–1.51 and 1.17–0.70 mF, respectively. The calculated capacitance values of both samples decrease with increasing potential, which can be primarily attributed to increased O2 coverage on the CL surface. Compared to IrO2, NiCo2O4 exhibits a steeper decrease of EDL capacitance with increasing applied potential, confirming the increased EDL resistance to O2, electron and OH− transport. For comparison, the impedance results measured at the OCP (Fig. S4†) were also used to calculate the values of C (Table S4†). In the absence of the OER, the contribution of (R1C2) at the OCP can be neglected when fitting the data to the equivalent circuit. It is found that both the OCP capacitances, i.e. IrO2 5.82 μF and NiCo2O4 3.41 μF, are much smaller (<1/300) than those obtained at other potentials at which the OER is occurring. The faradaic impedance (Rct) approaches infinity without the OER. Therefore, the corresponding AC current measured is extremely small, which significantly limits the accuracy of this method.16
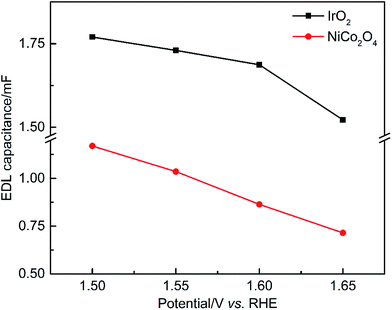 | ||
| Fig. 9 EDL capacitance of the OER catalysts calculated from EIS data as a function of applied DC potentials. | ||
According to the LSV results in Fig. 6(a), the lowest potential tested in EIS (i.e. 1.5 V) is close to the onset of the OER, and the transport resistance caused by O2 gas bubbles is low. The ECSAs derived at this potential based on eqn (10) are 29.0 and 19.1 m2 g−1 for IrO2 and NiCo2O4, respectively, when Cs is equal to 1.3 F m−2. Compared with the above CV-based techniques (Table S4†), it is clear that the ECSA results from EIS are more comparable to the corresponding BET surface area. Despite the uncertainties caused by Cs, the collective results confirmed that the newly developed EIS approach provides an effective and reliable way to calculate the EDL capacitance, which can be used for a wide variety of catalysts. This is because the capacitance obtained by EIS is from a realistic operating potential and accounts for active surface areas and their alterations due to EDL reconstruction during the OER, as compared to voltammetry capacitance which may be significantly affected by the EDL properties. For IrO2 with low EDL resistance, the measured EDL capacitance possibly includes the overlapping adsorption of OH− and the adsorption at the inner and less accessible active sites. In contrast, for the catalyst with high EDL resistance, real voltammetry capacitance due to EDL charging can be detected only at relatively low potential scan rates, which makes the measured data less accurate due to uncertainties arising from the inclusion of charging capacitance at the less accessible sites for the OER. Moreover, in the presence of the OER, the EDL capacitance possibly varies with EDL reconstruction, redox reaction of bulk catalysts, O2 gas bubble coverage, and adsorption of reaction intermediates. It is worth specially pointing out that the formation of Ni3+ (or Co3+) or higher oxidation states at high OER potentials can improve the material capacitive behaviors due to the increased charge conductivity compared with the non-conducting Ni2+ (or Co2+).
Mass transport in the EDL via a TF-RRDE approach
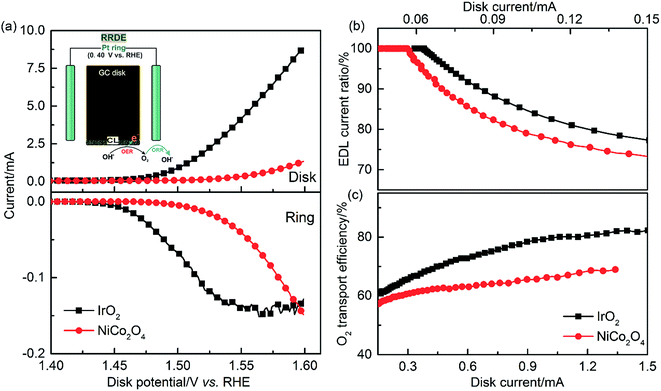
During the OER, continuous charge supply to or removal from the EDL is required to sustain a practical reaction rate. The charges involve electrons and OH−, and their amount determines the level of charge accumulation in the EDL. It has been reported that, when increasingly charged, the EDL becomes more active, resulting in the acceleration of reaction kinetics.47,48 In addition to charge transport, the O2 transport efficiency needs to be quantified, especially at relatively high current densities, to fully characterize the reaction rate and efficiency of a catalyst. To address these issues, a TF-RRDE evaluation method is developed using pair reactions of OER-ORR, as illustrated in Fig. S8.† Prior to the OER study, the collection efficiency (N) of our RRDE design was obtained by reducing Fe(SCN)63− at the disk electrode and oxidizing its product at the Pt-ring. The collection efficiency was measured to be 37.3% for both TF-RRDE loaded IrO2 or NiCo2O4 catalysts (Fig. S9†).Before RRDE voltammetry measurements, the electrolyte (1 M KOH) was purged with N2 for over 30 min to get rid of any dissolved O2. Then, using the rotating LSV technique, the disk potential was stepped from 1.3 V to 1.6 V at 2 mV s−1. The ring was held at 0.4 V, which has sufficient overpotential to rapidly reduce all collected oxygen. After subtracting the background current, the corrected currents at the Pt-ring electrode for both materials were recorded throughout the measurement, as shown in Fig. 10(a). The beginning of the ORR current on the ring coincides with the onset of the OER on the disk, indicating successful measurement of O2 generation. With the increase of disk potential, the ring current increases until the collected oxygen becomes saturated. This is an indication of a significant O2 bubble effect and that most of the O2 escaped from the disk electrode to the electrolyte solution without any response at the ring.
In the LSV measurement, the disk current is the sum of the double-layer capacitive current and the OER faradaic current. In the absence of the OER, the ratio of the EDL capacitive current to the total disk current in Fig. 10(b) is equal to 100%, and the ring current response is equal to 0. The capacitive current as a function of scan rate is generally independent of the applied potential. In contrast, the OER current increases with the applied potential. This can explain why the EDL current ratio decreases with increasing current and with the OER rate. It is worth noting that the calculated EDL current ratio is most accurate at low current at which most generated oxygen can be detected by the ring electrode. It is further observed that the EDL current ratio of IrO2 is higher than that of NiCo2O4. This indicates that the collective current of IrO2 has an increased contribution from the EDL current due to its lower EDL resistance, which agrees with the above CV and EIS results. These findings reveal that the EDL current resulting from the charging/discharging process has an impact on LSV data due to the variation of EDL capacitance. Therefore, measurement methods using a low scan rate or steady-phase polarization are recommended for characterizing catalyst performance.
The O2 transport efficiency calculated after deducting the capacitive current at the disk electrode is shown in Fig. 10(c). The disk current ranges from 0.15 to 1.50 mA to avoid noise at low current and mass transport limitations at high current. In this current range, the OER current has a dominant contribution from the detected disk current as compared to the EDL capacitive current. As shown in eqn S13,† the O2 transport efficiency is obtained from the ratio of the ring current to the OER current obtained from the disk. The O2 transport efficiency can be used to quantify the amount of oxygen escaping from the disk electrode to the bulk electrolyte solution without being reduced at the ring. Compared with NiCo2O4, a higher O2 transport efficiency was observed for IrO2 at a given current, confirming that IrO2 with an improved pore structure is more efficient in removing the produced O2.
The faradaic process may involve an OER through two-electron oxidation to form an HO2− intermediate. To assess this effect, the ring potential (0.4 V) was changed to 1.4 V for oxidizing HO2−. As shown in Fig. S10,† for these two catalysts, no significant ring current could be detected when the OER occurred at the disk electrode. This confirms that both electrocatalytic OERs of IrO2 and NiCo2O4 are 4-electron transfer processes.
Catalyst EDL stability
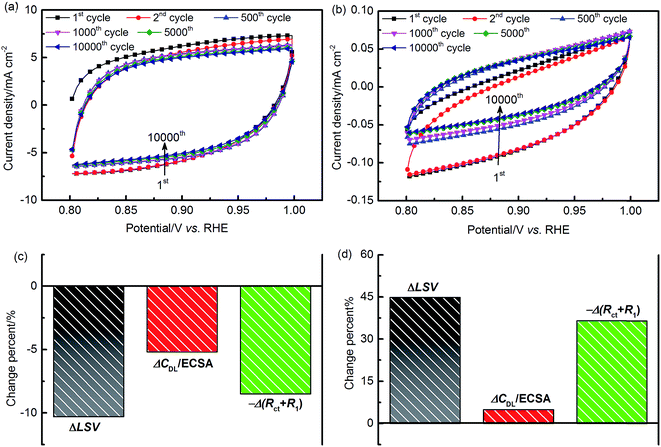
To evaluate the stability characteristics of the EDL, repetitive potential cycling tests were carried out in an O2-saturated environment. Fig. 11(a and b) show the CV curves recorded at 100 mV s−1 in an EDL potential window of 0.8–1.0 V. For both of the two materials, it can be observed that obvious changes of the CV shape occur during the first 500 or so cycles. This may be due to the losses of catalyst materials and/or the irreversible chemical and structural restructuring of the reaction interface. Throughout the 10![[thin space (1/6-em)]](https://www.rsc.org/images/entities/char_2009.gif) 000 cycles, the charging/discharging curves of IrO2 appear to be relatively symmetric around the zero current density axis. For Ni–Co oxides, the symmetry of the CV curves improves with increased scanning cycles, as demonstrating by the reversible improvement of the charging behavior. This can be attributed to the formation of a hydrous oxidation layer at the reaction interface during the CV, which can reduce the EDL resistance to charge migration.47
000 cycles, the charging/discharging curves of IrO2 appear to be relatively symmetric around the zero current density axis. For Ni–Co oxides, the symmetry of the CV curves improves with increased scanning cycles, as demonstrating by the reversible improvement of the charging behavior. This can be attributed to the formation of a hydrous oxidation layer at the reaction interface during the CV, which can reduce the EDL resistance to charge migration.47
After 10![[thin space (1/6-em)]](https://www.rsc.org/images/entities/char_2009.gif) 000 test cycles, measurements of LSV and EIS at 1.5 V were performed to assess performance changes. The change of catalyst activity can be quantified as the difference between the integrated LSV results before and after stability tests. The major parameters indicative of catalyst activity are the Tafel slope, ECSA, and polarization resistance. The Tafel slope is obtained by fitting IR-free LSV data, and the ECSA and reaction resistance can be quantified from EIS results. In our equivalent circuit model, the total polarization resistance, RP, is given as the sum of the charge transfer resistance, Rct, and the reaction intermediate adsorption resistance, R1. Based on the fitted EIS results of each material, the polarization resistance is found to be close to the diameter of the intersections between the semi-circle and the real axis at the low and high frequencies in the Nyquist plot. The change of LSV, ECSA, and RP for both of the two materials is presented in Fig. 11(c and d).
000 test cycles, measurements of LSV and EIS at 1.5 V were performed to assess performance changes. The change of catalyst activity can be quantified as the difference between the integrated LSV results before and after stability tests. The major parameters indicative of catalyst activity are the Tafel slope, ECSA, and polarization resistance. The Tafel slope is obtained by fitting IR-free LSV data, and the ECSA and reaction resistance can be quantified from EIS results. In our equivalent circuit model, the total polarization resistance, RP, is given as the sum of the charge transfer resistance, Rct, and the reaction intermediate adsorption resistance, R1. Based on the fitted EIS results of each material, the polarization resistance is found to be close to the diameter of the intersections between the semi-circle and the real axis at the low and high frequencies in the Nyquist plot. The change of LSV, ECSA, and RP for both of the two materials is presented in Fig. 11(c and d).
The results obtained after cycling confirm that IrO2 suffers from around 10% activity loss, while the NiCo2O4 activity is increased by 45%. This indicates that the latter provides superior long-term durability to the EDL in the alkaline medium. Further analysis reveals that Tafel slopes, shown in Fig. S11(a),† have no significant change after stability tests. In contrast, major alterations related to the ECSA and RP were obtained from EIS results in Fig. S11(b).† The decay of IrO2 activity can be attributed to a potential-induced transformation from a stable low-valence oxide, i.e. IrIII/IrIV, into an unstable higher-valence oxide, i.e. IrIV/IrV.58 For NiCo2O4, the hydrous oxidized films in the EDL can continue to grow with time due to hydrolysis reactions, accompanied by the oxidation of active elements, until the reaction reaches a balance.1,46–48 These EDL structural modifications could result in the (i) increase of the catalyst layer roughness with a larger ECSA (ca. 5%) exposed to the electrolyte solution, (ii) reduction of the electron conductivity, i.e., RΩ reduced from 5.2 to 4.95 Ω cm−2, and (iii) adsorption of OH− anions.1
Conclusions
In this study, we developed an advanced benchmarking method to quantify the activity and stability of various OER catalysts. The parameters for each electrochemical method were carefully selected to produce reliable results for characterizing catalyst properties during the electrocatalytic OER. Moreover, the newly developed EDL microstructure illustrates the significance of interfacial charging, pseudocapacitive and transport behaviors. The collective results confirm that IrO2 exhibited 2.6-times higher OER activity than Ni–Co oxide, which was ascribed to an increased ECSA and decreased resistances for electron, OH− and O2 transport in the EDL. To obtain reliable ECSAs of the catalysts, three traditional CV methods were compared with a newly developed in situ EIS method. It was found that based on the EIS approach, the ECSAs obtained as a function of applied OER potential are more reliable than those from CV methods and have the best agreement with the BET surface area. In addition, repetitive potential cycling results indicated the superior EDL stability of NiCo2O4, resulting from the continuous growth of hydrous oxidized films. Based on these findings, future work in designing improved OER catalysts should focus on increasing the availability and stability of the EDL for long-term OER applications.Experimental section
Chemical reagents
Potassium hydroxide (KOH, ≥90 wt%), anhydrous ethanol (≥95 wt%), 5 wt% Nafion® solution, and nickel–cobalt oxides (NiCo2O4, ≥99.99%) were purchased from Sigma-Aldrich. Iridium dioxide (IrO2, ≥99.99%) was obtained from Alfa Aesar. Solutions were prepared using ultrapure deionized water (18 MΩ cm resistivity) supplied by an in-house water purification system from Thermo Scientific Barnstead Nanopure.Measurement equipment
Electrochemical measurements in a half cell were conducted with a CHI 750E bipotentiostat at room temperature and ambient pressure. A standard three-electrode system was constructed for the TF-RDE/RRDE measurements and the major components were purchased from Pine Instrument Company. The three electrodes include an Hg/HgO RE (filled with 1 M KOH), a Pt wire (7 mm OD × 65 mm long) CE, and a WE with a rotating function. After the deposition of a thin-film catalyst layer, the working electrode was affixed to a modulated speed rotator (MSR). For TF-RDE measurements, the working electrode was an E3 series RDE (OD = 5 mm) with a glassy carbon (GC) disk. TF-RRDE tests used an E7R9 series RRDE with a sub-millimeter gap between the GC disk (OD = 5.61 mm) and the Pt ring (OD = 7.92 mm; ID = 6.25 mm). The electrolyte solution of 1 M KOH was added to a solid PTFE cell (300 mL) to prevent any corrosion. The pH of the 1 M KOH solution was measured to be 13.93 with an HI98128 pH/Temperature Tester (Hanna Instruments). After degassing in a vacuum at 200 °C for 2 h, the materials were tested using low-temperature N2 adsorption–desorption isotherm measurements at −196 °C on a MicroMeritics TriStar 3000 Porosimeter. Based on the collected isotherms, the Brunauer–Emmett–Teller (BET) method was used to estimate the specific surface area in the relative pressure range between 0.01 and 0.30. The average pore diameter and total pore volume were assessed by applying the Barrett–Joyner–Halenda (BJH) mode to the desorption branch of the isotherm. The zeta potential of the catalyst ink was obtained using a Malvern Zetasizer Nano ZS90 at room temperature.Thin-film catalyst layer (CL) preparation
A high-quality CL can be obtained by casting catalyst–ionomer–ethanol-containing inks onto a cleaned glassy carbon disk electrode. Prior to depositing the catalyst–ionomer film, the disk electrode was polished with a 50 nm Al2O3 particle suspension on a rayon micro-cloth disk in a “Fig. 8” pattern for 2–3 minutes. The ink in our work was prepared by mixing 5 mg of catalyst with a Nafion ionomer solution (5 wt%) and 4 mL ethanol. The major roles of the Nafion ionomer were to improve the catalyst dispersion in the resulting ink and enhance the interfacial adhesion between the CL and the disk substrate.36 The mass ratio of ionomer to catalyst was 1/2 in each sample. To form a uniform dispersion, the ink was sonicated for 30 min in a water bath and the temperature controlled to less than 35 °C. The resulting ink was then deposited onto the entire surface of the disk electrode as droplets using a 2–20 μL adjustable micro-pipette and dried in air at ambient temperature. The coating/drying cycles were carried out several times until the target 0.24 mg cm−2 loading was reached.Measurement procedure for the TF-RDE
The TF-RDE was mounted onto the MSR assembly with the electrode surface facing downward in the 1 M KOH solution. In the case of stability tests, O2 was used instead of N2 for purging the electrolyte solution throughout the process. Detailed parameters for each electrochemical technique, such as CV, LSV and EIS, are given in Fig. 2. The quiet time in each test was set to 10 s before beginning a new measurement. CV curves were obtained under static conditions (rotating speed = 0). During the LSV and EIS processes, a standard electrode rotating speed of 1600 rpm was used in order to facilitate mass transport and O2 removal from the reaction interface. The Nyquist impedance diagrams were obtained using the CHI program.For accelerated stability evaluation, 10![[thin space (1/6-em)]](https://www.rsc.org/images/entities/char_2009.gif) 000 potential cycles from 0.8–1.0 V were performed in the O2-purged 1 M KOH solution at a scan rate of 100 mV s−1. Subsequently, the performance degradation was investigated by comparing the LSV and EIS results obtained before and after stability tests.
000 potential cycles from 0.8–1.0 V were performed in the O2-purged 1 M KOH solution at a scan rate of 100 mV s−1. Subsequently, the performance degradation was investigated by comparing the LSV and EIS results obtained before and after stability tests.
Measurement procedure of the TF-RRDE
As shown schematically in Fig. S8,† the RRDE consists of two working electrodes, i.e. an inner GC disk electrode and an outer Pt-ring electrode, in which the potentials can be controlled individually with the bipotentiostatic CHI 750E. Typical TF-RRDE voltammetry experiments are conducted by scanning the potential on the disk electrode via LSV, while keeping the Pt-ring potential constant at a value at which an intermediate/product of interest can be oxidized or reduced. Major experimental parameters are listed in Fig. 2.Depending on the ring potential controlled with the bipotentiostatic instrument, an oxygen reduction reaction (ORR) or peroxide oxidizing reaction would occur at the Pt-ring electrode. In our work, a newly developed analysis method, described in the ESI,† was used to examine the contribution of the EDL charging current and O2 transport efficiency (ε) during the OER.
In addition, the collection efficiency (N) of the RRDE was obtained using a N2-saturated solution of 10 mM K3Fe(CN)63− and 1 M KOH mixture. The details of the measurement and calculation procedures are provided in the ESI.†
Extended stability measurements using a gas diffusion electrode (GDE)
The extended stability tests were carried out in a traditional alkaline water electrolyser, including an OER WE and a Pt gauze CE, as illustrated in Fig. S2 (refer to the ESI†). In preparing the WE, the ink with the catalyst and Nafion ionomer was sonicated for 30 min. The dispersed ink was then coated dropwise on a wet-proofed carbon paper, which is frequently used as the substrate of GDEs in fuel cells due to its high mechanical strength, gas transport, electrical conductivity and stability.68 The fabricated GDE was dried under an infrared lamp, and subsequently cut into a 1 × 1 cm2 active area with 2.5 mg cm−2 catalyst loading. The catalyst stability was validated by current-controlled (10/50 mA cm−2) electrolysis tests for 1000 h in the stirred 1 M KOH at room temperature.Conflicts of interest
There are no conflicts to declare.Acknowledgements
The authors would like to thank Prof. Peggy O'Day and Dr Ajith Pattammattel for their support in low-temperature N2 adsorption–desorption isotherm measurements and Prof. Ashlie Martini for reviewing our work. This work was supported by the GREENPower Program (IIID 2015-09) from the Commission on Higher Education – Philippine California Advanced Research Institutes (CHED-PCARI) of the Republic of the Philippines, “Fundamental Research Funds for the Central Universities” from Wuhan University of Technology, and University of California, Merced.References
- R. L. Doyle and M. E. G. Lyons, in Photoelectrochemical Solar Fuel Production: From Basic Principles to Advanced Devices, ed. S. Giménez and J. Bisquert, Springer International Publishing, Cham, 2016, pp. 41–104, DOI:10.1007/978-3-319-29641-8_2.
- M. S. Burke, L. J. Enman, A. S. Batchellor, S. Zou and S. W. Boettcher, Chem. Mater., 2015, 27, 7549–7558 CrossRef CAS.
- B. A. Pinaud, J. D. Benck, L. C. Seitz, A. J. Forman, Z. Chen, T. G. Deutsch, B. D. James, K. N. Baum, G. N. Baum, S. Ardo, H. Wang, E. Miller and T. F. Jaramillo, Energy Environ. Sci., 2013, 6, 1983–2002 CAS.
- E. M. Miner and M. Dincă, Nat. Energy, 2016, 1, 16186 CrossRef.
- Y. Chen, F. Mojica, G. Li and P.-Y. A. Chuang, Int. J. Energy Res., 2017, 1–9, DOI:10.1002/er.3806.
- J. R. Varcoe, P. Atanassov, D. R. Dekel, A. M. Herring, M. A. Hickner, P. A. Kohl, A. R. Kucernak, W. E. Mustain, K. Nijmeijer, K. Scott, T. Xu and L. Zhuang, Energy Environ. Sci., 2014, 7, 3135–3191 CAS.
- C. C. Pavel, F. Cecconi, C. Emiliani, S. Santiccioli, A. Scaffidi, S. Catanorchi and M. Comotti, Angew. Chem., Int. Ed., 2014, 53, 1378–1381 CrossRef CAS PubMed.
- A. T. Swesi, J. Masud and M. Nath, Energy Environ. Sci., 2016, 9, 1771–1782 CAS.
- X. Li, X. Hao, A. Abudula and G. Guan, J. Mater. Chem. A, 2016, 4, 11973–12000 CAS.
- A. Grimaud, A. Demortière, M. Saubanère, W. Dachraoui, M. Duchamp, M.-L. Doublet and J.-M. Tarascon, Nat. Energy, 2016, 2, 16189 CrossRef.
- J. H. Bae, J.-H. Han and T. D. Chung, Phys. Chem. Chem. Phys., 2012, 14, 448–463 RSC.
- A. Ganassin, A. Maljusch, V. Colic, L. Spanier, K. Brandl, W. Schuhmann and A. Bandarenka, ACS Catal., 2016, 6, 3017–3024 CrossRef CAS.
- L. Trotochaud and S. W. Boettcher, Scr. Mater., 2014, 74, 25–32 CrossRef CAS.
- C. Spoeri, J. T. H. Kwan, A. Bonakdarpour, D. Wilkinson and P. Strasser, Angew. Chem., 2017, 56, 5994–6021 CrossRef CAS PubMed.
- H. Dau, C. Limberg, T. Reier, M. Risch, S. Roggan and P. Strasser, ChemCatChem, 2010, 2, 724–761 CrossRef CAS.
- A. J. Bard and L. R. Faulkner, Electrochemical Methods. Fundamentals and Applications, John Wiley & Sons, Inc., 2nd edn, 2001 Search PubMed.
- S. Trasatti and O. A. Petrii, J. Electroanal. Chem., 1992, 327, 353–376 CrossRef CAS.
- S. Ardizzone, G. Fregonara and S. Trasatti, Electrochim. Acta, 1990, 35, 263–267 CrossRef CAS.
- C. C. L. McCrory, S. Jung, J. C. Peters and T. F. Jaramillo, J. Am. Chem. Soc., 2013, 135, 16977–16987 CrossRef CAS PubMed.
- C. C. McCrory, S. Jung, I. M. Ferrer, S. M. Chatman, J. C. Peters and T. F. Jaramillo, J. Am. Chem. Soc., 2015, 137, 4347–4357 CrossRef CAS PubMed.
- R. Frydendal, E. A. Paoli, B. P. Knudsen, B. Wickman, P. Malacrida, I. E. L. Stephens and I. Chorkendorff, ChemElectroChem, 2014, 1, 2075–2081 CrossRef CAS.
- S. Zhao, Y. Wang, J. Dong, C.-T. He, H. Yin, P. An, K. Zhao, X. Zhang, C. Gao, L. Zhang, J. Lv, J. Wang, J. Zhang, A. M. Khattak, N. A. Khan, Z. Wei, J. Zhang, S. Liu, H. Zhao and Z. Tang, Nat. Energy, 2016, 1, 16184 CrossRef CAS.
- E. Fabbri, A. Habereder, K. Waltar, R. Kotz and T. J. Schmidt, Catal. Sci. Technol., 2014, 4, 3800–3821 CAS.
- P. Stonehart and P. N. Ross, Electrochim. Acta, 1976, 21, 441–445 CrossRef CAS.
- K. Shinozaki, J. W. Zack, S. Pylypenko, B. S. Pivovar and S. S. Kocha, J. Electrochem. Soc., 2015, 162, F1384–F1396 CrossRef CAS.
- M. Shao, Q. Chang, J.-P. Dodelet and R. Chenitz, Chem. Rev., 2016, 116, 3594–3657 CrossRef CAS PubMed.
- S.-J. Lee, S.-I. Pyun, S.-K. Lee and S.-J. L. Kang, Isr. J. Chem., 2008, 48, 215–228 CrossRef CAS.
- F.-X. Ma, L. Yu, C.-Y. Xu and X. W. Lou, Energy Environ. Sci., 2016, 9, 862–866 CAS.
- X. Gao, H. Zhang, Q. Li, X. Yu, Z. Hong, X. Zhang, C. Liang and Z. Lin, Angew. Chem., Int. Ed., 2016, 55, 6290–6294 CrossRef CAS PubMed.
- L. Wang, C. Lin, D. Huang, F. Zhang, M. Wang and J. Jin, ACS Appl. Mater. Interfaces, 2014, 6, 10172–10180 CAS.
- X. Lu, W.-L. Yim, B. H. R. Suryanto and C. Zhao, J. Am. Chem. Soc., 2015, 137, 2901–2907 CrossRef CAS PubMed.
- J. T. Mefford, X. Rong, A. M. Abakumov, W. G. Hardin, S. Dai, A. M. Kolpak, K. P. Johnston and K. J. Stevenson, Nat. Commun., 2016, 7, 11053 CrossRef CAS PubMed.
- B. You, N. Jiang, M. Sheng, S. Gul, J. Yano and Y. Sun, Chem. Mater., 2015, 27, 7636–7642 CrossRef CAS.
- A. Grimaud, O. Diaz-Morales, B. Han, W. T. Hong, Y.-L. Lee, L. Giordano, K. A. Stoerzinger, M. T. M. Koper and Y. Shao-Horn, Nat. Chem., 2017, 9, 457–465 CrossRef CAS PubMed.
- B. Bladergroen, H. Su, S. Pasupathi and V. Linkov, in Electrolysis, ed. V. Linkov, InTech, 2012, pp. 45–60, DOI:10.5772/52947.
- H.-Y. Jung and J.-H. Choi, J. Solid State Electrochem., 2012, 16, 1571–1576 CrossRef CAS.
- S. Jung, C. C. L. McCrory, I. M. Ferrer, J. C. Peters and T. F. Jaramillo, J. Mater. Chem. A, 2016, 4, 3068–3076 CAS.
- R. J. Hunter, Zeta potential in colloid science: principles and applications, Academic press, 2013 Search PubMed.
- V. R. Stamenkovic, D. Strmcnik, P. P. Lopes and N. M. Markovic, Nat. Mater., 2017, 16, 57–69 CrossRef CAS PubMed.
- W. M. Haynes, CRC Handbook of Chemistry and Physics, 94th edn, CRC Press, 2013 Search PubMed.
- J. Wang, J. Polleux, J. Lim and B. Dunn, J. Phys. Chem. C, 2007, 111, 14925–14931 CAS.
- V. Augustyn, P. Simon and B. Dunn, Energy Environ. Sci., 2014, 7, 1597–1614 CAS.
- S. Khalid, C. Cao, L. Wang and Y. Zhu, Sci. Rep., 2016, 6, 22699 CrossRef CAS PubMed.
- W. Zhou, D. Kong, X. Jia, C. Ding, C. Cheng and G. Wen, J. Mater. Chem. A, 2014, 2, 6310–6315 CAS.
- C. Costentin, T. R. Porter and J.-M. Savéant, J. Am. Chem. Soc., 2016, 138, 5615–5622 CrossRef CAS PubMed.
- K. K. Lian and V. I. Birss, J. Electrochem. Soc., 1991, 138, 2885–2890 CrossRef CAS.
- F. M. Mulder, B. M. H. Weninger, J. Middelkoop, F. G. B. Ooms and H. Schreuders, Energy Environ. Sci., 2017, 10, 756–764 CAS.
- N. Weidler, J. Schuch, F. Knaus, P. Stenner, S. Hoch, A. Maljusch, R. Schäfer, B. Kaiser and W. Jaegermann, J. Phys. Chem. C, 2017, 121, 6455–6463 CAS.
- G. Li, H. Yu, D. Yang, J. Chi, X. Wang, S. Sun, Z. Shao and B. Yi, J. Power Sources, 2016, 325, 15–24 CrossRef CAS.
- B. Zhang, X. Zheng, O. Voznyy, R. Comin, M. Bajdich, M. García-Melchor, L. Han, J. Xu, M. Liu, L. Zheng, F. P. García de Arquer, C. T. Dinh, F. Fan, M. Yuan, E. Yassitepe, N. Chen, T. Regier, P. Liu, Y. Li, P. De Luna, A. Janmohamed, H. L. Xin, H. Yang, A. Vojvodic and E. H. Sargent, Science, 2016, 352, 333–337 CrossRef CAS PubMed.
- R. A. Rincon, J. Masa, S. Mehrpour, F. Tietz and W. Schuhmann, Chem. Commun., 2014, 50, 14760–14762 RSC.
- M. Gong, Y. Li, H. Wang, Y. Liang, J. Z. Wu, J. Zhou, J. Wang, T. Regier, F. Wei and H. Dai, J. Am. Chem. Soc., 2013, 135, 8452–8455 CrossRef CAS PubMed.
- D. B. Rogers, R. D. Shannon, A. W. Sleight and J. L. Gillson, Inorg. Chem., 1969, 8, 841–849 CrossRef CAS.
- I. C. Man, H.-Y. Su, F. Calle-Vallejo, H. A. Hansen, J. I. Martínez, N. G. Inoglu, J. Kitchin, T. F. Jaramillo, J. K. Nørskov and J. Rossmeisl, ChemCatChem, 2011, 3, 1159–1165 CrossRef CAS.
- Y. Matsumoto and E. Sato, Mater. Chem. Phys., 1986, 14, 397–426 CrossRef CAS.
- H. F. Liang, F. Meng, M. Caban-Acevedo, L. S. Li, A. Forticaux, L. C. Xiu, Z. C. Wang and S. Jin, Nano Lett., 2015, 15, 1421–1427 CrossRef CAS PubMed.
- F. Song and X. L. Hu, Nat. Commun., 2014, 5, 4477 CAS.
- G. Li, H. Yu, X. Wang, S. Sun, Y. Li, Z. Shao and B. Yi, Phys. Chem. Chem. Phys., 2013, 15, 2858–2866 RSC.
- J. C. Liu and J. Wei, Chem. Eng. Sci., 2014, 111, 1–14 CrossRef CAS.
- J. Gaudet, A. C. Tavares, S. Trasatti and D. Guay, Chem. Mater., 2005, 17, 1570–1579 CrossRef CAS.
- X. Yuan, C. Song, H. Wang and J. Zhang, in Electrochemical Impedance Spectroscopy in PEM Fuel Cells, Springer, London, 2010, ch. 5, pp. 193–262, DOI:10.1007/978-1-84882-846-9_5.
- E. Rasten, G. Hagen and R. Tunold, Electrochim. Acta, 2003, 48, 3945–3952 CrossRef CAS.
- M. E. Orazem and B. Tribollet, in Electrochemical Impedance Spectroscopy, John Wiley & Sons, Inc., 2008, pp. 233–263, DOI:10.1002/9780470381588.ch13.
- M. E. Orazem, I. Frateur, B. Tribollet, V. Vivier, S. Marcelin, N. Pébère, A. L. Bunge, E. A. White, D. P. Riemer and M. Musiani, J. Electrochem. Soc., 2013, 160, C215–C225 CrossRef CAS.
- I. Katsounaros, S. Cherevko, A. R. Zeradjanin and K. J. J. Mayrhofer, Angew. Chem., Int. Ed., 2014, 53, 102–121 CrossRef CAS PubMed.
- E. Chassaing, B. Sapoval, G. Daccord and R. Lenormand, J. Electroanal. Chem. Interfacial Electrochem., 1990, 279, 67–78 CrossRef CAS.
- E. D. Bidóia, L. O. S. Bulhões and R. C. Rocha-Filho, Electrochim. Acta, 1994, 39, 763–769 CrossRef.
- J. Park, H. Oh, T. Ha, Y. I. Lee and K. Min, Appl. Energy, 2015, 155, 866–880 CrossRef CAS.
Footnote |
| † Electronic supplementary information (ESI) available. See DOI: 10.1039/c7se00337d |
| This journal is © The Royal Society of Chemistry 2018 |

