A detailed evaluation of charge recombination dynamics in dye solar cells based on starburst triphenylamine dyes†
Manikkedath V.
Vinayak
a,
Muhammed
Yoosuf
a,
Sourava C.
Pradhan
a,
Thyagarajan M.
Lakshmykanth
ab,
Suraj
Soman
 *abc and
Karical R.
Gopidas
 *abc
*abc
aPhotosciences and Photonics Section, Chemical Sciences and Technology Division, CSIR-National Institute for Interdisciplinary Science and Technology, Thiruvananthapuram 695019, Kerala, India. E-mail: suraj@niist.res.in; suraj.csir@gmail.com; gopidaskr@niist.res.in
bAcademy of Scientific and Innovative Research (AcSIR), New Delhi 110001, India
cCSIR-Network of Institutes for Solar Energy (CSIR-NISE), India
First published on 7th November 2017
Abstract
Understanding the charge transfer dynamics in dye solar cells (DSCs) is imperative for the development of highly efficient devices. The loss in photocurrent due to recombination can be alleviated by removing holes formed in the oxidized dye molecules away from the TiO2 surface and also by preventing the oxidized species in the electrolyte from coming near the semiconductor. Focusing on elucidating these two parameters we fabricated I−/I3− electrolyte based dye solar cells with two novel branched propeller shaped triphenylamine dyes TPAA4 and TPAA5 with broader absorption and higher molar extinction coefficient, which showed power conversion efficiencies of 6.52% and 4.60% respectively. The bulkiness of the co-donor along with the triple bond bridges provided further rigidity to the structure, thereby reducing aggregation of the dyes on the TiO2 surface. Both the dyes were structurally engineered in such a way to avoid the recombination of electrons from TiO2. Detailed charge transfer dynamics of the devices were studied by employing extensive perturbation techniques such as electrochemical impedance spectroscopy (EIS), charge extraction (CE) and intensity-modulated photovoltage spectroscopy (IMVS).
Introduction
Twenty-five years have been completed since the successful introduction of dye solar cells by O'Regan and Grätzel, which inspired the development of cost-effective solar cells having higher efficiencies.1–3 With extensive research carried out on each and every component including novel dyes, semiconductor materials and electrolytes, the research community was able to push the efficiencies up to 14.7% for small area devices under full sun illumination.4 Recently Hagfeldt and Grätzel have successfully demonstrated that DSCs are the best in the class of solar cells suitable for efficiently harvesting artificial/indoor lights reaching up to 28.9% efficiency.5 Sony was even successful in fabricating DSC submodules with 9.9% efficiency consisting of eight parallel cells with an area of 17 cm2.6 In the past few years, extensive advancement in low power energy harvesting Internet of Thing (IoT) related products such as sensors and actuators resulted in a paradigm shift in DSC research. Most of these devices need to be powered by room light where DSCs have already been proven to be the best in the class of solar cells for indoor low light harvesting applications among the various photovoltaic technologies.5,7–9 In a way to transform these devices from the lab scale to commercial manufacturing, a much better understanding of the internal charge transfer dynamics is highly essential. The forward electron processes (injection, regeneration, and diffusion) taking place in DSCs are always in constant competition with the backward process which is recombination. Charge transport in semiconductor electrodes and charge transfer from the conduction band/localized states in the bandgap of the semiconductor to the electrolyte and also to the HOMO level of the dye are the two limiting processes that mostly determine the performance of the devices. Various groups have studied in detail the effect of charge transfer and transport dynamics on the performance of DSCs.10–14Even though Ru-based metal complex dyes proved to be the best in the class,15–17 the past two decades have witnessed the evolution of a range of organic dyes including porphyrins,18,19 phthalocyanines,20 quinoxalines,21,22 indolines,23,24 bodipys,25,26 squaraines,27,28 and triphenylamines.29–31 Among the triphenylamine-based metal-free systems which have been reported so far, the configuration of the 2D–π–A type is preferred as it extends the conjugation and enhances the absorption spectra of the dye molecules.32–35O-Alkyl, N,N-dimethyl, N,N-dimethyl phenyl and triphenylamines (TPA) have been used as donors to improve the donor strength. Furthermore, these units were linked to the TPA core through sigma bonds.36–40 However, dendritic triphenylamines, which used double bonds as linkers, have also been reported.41,42 Attaching donors peripherally to the triphenylamine in conjunction with increasing acceptor strengths is yet another strategy which has been employed. This is done by either tuning the π-bridge through which the TPA core is attached to the acceptor or by increasing the number of acceptor groups itself.43,44 The effect of increasing the number of acceptor groups for TPA derivatives has been investigated by several groups and also by our group, in a recently published report.45,46 In addition to enhanced conjugation and absorption, the distinct structural characteristics which emerge as a result of changing the substituents endow these molecules with several other advantages that help them to perform better in devices. The differences in molecular structure have been reported to influence the electron lifetimes significantly on TiO2, through an increased blocking effect by preventing triiodide ions from reaching the semiconductor surface.37 The studies related to the introduction of double and triple bonds between the TPA donor and cyanoacetic acid acceptor have promoted exciting ideas for the methodology to be adopted for designing new and efficient dyes for DSCs.47–50
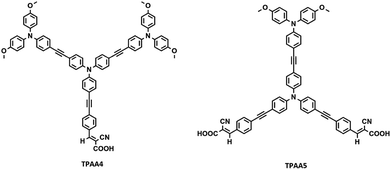
Herein we designed and synthesized two novel starburst triphenylamine (TPA) derivatives, TPAA4 and TPAA5, which are modifications of TPAA1 and TPAA2 (Fig. S1, ESI†), reported previously by our group.45 The dyes were structurally engineered by attaching TPA donors to the core through ethenyl linkages which intensified the ICT transitions through better donor–acceptor interactions resulting in enhanced absorption characteristics. Hagfeldt and Boshloo research groups have successfully shown that TPA donor groups having an inherent hole-transporting capability, used as antennas, are capable of making a separation between the dye cation and electrode surface which helped to slow down the recombination between injected electrons in TiO2 and the oxidized dye molecules.35,37,54–57 In addition to this, the starburst shape of the designed TPAA molecules will prevent the electrolyte from reaching the semiconductor surface and will reduce the intermolecular π–π stacking thereby preventing recombination and aggregation.56,57 Structures of the dye molecules studied (TPAA4 and TPAA5) are given in Fig. 1.
Experimental section
General methods
The starting materials triphenylamine (TPA), and 4-[(trimethylsilyl)ethynyl]benzaldehyde were purchased from Sigma-Aldrich and were used as such. HPLC grade solvents were used which were freshly distilled before use. Reactions were carried out under an inert nitrogen atmosphere. 1H NMR and 13C NMR spectra were obtained using a 500 MHz Bruker Avance DPX spectrometer. FT-IR spectra were recorded on a Shimadzu IR Prestige 21 spectrometer. Differential scanning calorimetry measurements were done using a Perkin-Elmer Pyris 6 DSC instrument. The samples were measured in sealed aluminum pans under a nitrogen flow, at a heating/cooling rate of 5 °C min−1. Absorption spectra were obtained using a Shimadzu 3101PC UV/Vis-NIR scanning spectrophotometer. Electrochemical experiments were performed using a BAS 50W voltammetric analyzer. Solutions of the compounds (1 × 10⁻³ M) in acetonitrile containing 0.1 M tetra-n-butylammonium hexafluorophosphate as the supporting electrolyte were thoroughly de-aerated and used for differential pulse voltammetry experiments. The amounts of dye adsorbed on the semiconductor surface were estimated spectroscopically. The photocurrent–voltage (J–V) measurements for the DSCs were done using an Oriel I–V test station (model PVIV-412) having a Class-A solar simulator (Model: 91195 A) and a 450 W xenon lamp with the appropriate Oriel filters to simulate the desired AM 1.5G solar spectrum accompanied by a Keithley E 2400 source meter using a Si reference solar cell supplied by Newport Instruments. The incident photon-to-current conversion efficiency (IPCE) measurement of the devices was performed under DC mode using a 250 W xenon lamp coupled with a Newport monochromator. The J–V properties of cells were measured by using a square shade mask with active area 0.25 cm2 (without the mask the active area is 0.36 cm2). The electrochemical impedance spectroscopy (EIS) measurements of DSCs were carried out using an Autolab (PGSTAT 302N) workstation equipped with FRA under forward bias in the dark. The impedance spectra were recorded at direct applied potentials from 0.65 to 0.85, stepped in at 50 mV increments, with a 10 mV alternating potential superimposed on the direct bias. The entire equivalent circuit fitting was carried out using NOVA 1.11 software and the errors of the derived parameters were kept below the desirable range of 20%. The measurements were performed in a frequency range of 0.1 to 105 Hz in equally spaced logarithmic steps. Charge extraction (CE) was carried out using a 470 nm LED light coupled with the Autolab (PGSTAT 302N) and LED driver. Light was switched on for 20 s where the cell reached and became stable at OCP and the light was turned off where there was a voltage decay after which the cell was short circuited followed by charge collection as a function of delay time. Intensity-modulated photovoltage spectroscopy (IMVS) measurements were conducted using the same electrochemical workstation (PGSTAT 302N) equipped with a FRA and LED driver to drive the 470 nm LED. The photovoltage response of the cells was analyzed in the frequency range of 1 Hz to 1 kHz. The amplitude of the sinusoidal modulation for IMVS measurements was 10% of the dc light.DSC fabrication
FTO glass plates obtained from Dyesol (TEC 8) were prepared for TiO2 deposition by a stepwise cleaning procedure which involved sonication with the detergent solution, distilled water, acetone and isopropanol followed by UV-O3 treatment. The plates were then immersed in 40 mM aqueous TiCl4 solution at 70 °C for 30 min, washed with distilled water and ethanol and annealed at 500 °C for 30 min. 20 nm sized TiO2 paste (Dyesol 18 NR-T) was then screenprinted on to the plate and annealed at 125 °C for 10 min to obtain a transparent nanocrystalline film of around 12 μm thickness. A scattering layer consisting of larger TiO2 particles (ca. 400 nm, Dyesol 18 NR-AO) was then coated (∼3 μm) and annealed at 125 °C for 10 min. This was followed by another TiCl4 treatment. The TiO2 coated glass plates were then put into programmed heating at 325 °C for 15 min, 450 °C for 15 min and 500 °C for 30 min.52 The sintered photoanodes were then slowly cooled; when the temperature reached 70 °C, they were immersed in triphenylamine dye solution in acetonitrile (0.3 mM) and kept at room temperature for 12 h. Counter electrodes (TEC 8) having pre-drilled holes were also cleaned in the same way as the photoanodes and coated with Pt paste obtained from Dyesol and annealed at 400 °C for 20 min. The dye adsorbed TiO2 electrodes, and Pt counter electrodes were assembled with a hot press using a Surlyn spacer of thickness 25 μm. The space in between the electrodes was filled with liquid I−/I3− electrolyte solution which was composed of 1-butyl-3-methylimidazolium iodide (0.6 M), LiI (0.05 M), I2 (0.05 M), guanidinium thiocyanate (0.05 M) and 4-tert-butylpyridine (0.25 M) in acetonitrile. The drilled holes were sealed using a microscopic cover slide and Surlyn to avoid electrolyte leakage. All the cells were measured after keeping them for 12 h in the dark.Synthesis of dyes
Both the dyes, TPAA4 and TPAA5, were synthesized from 4,4′,4′′-triiodotriphenylamine as the starting material. The synthetic route taken to realize the dye synthesis is shown in Scheme 1.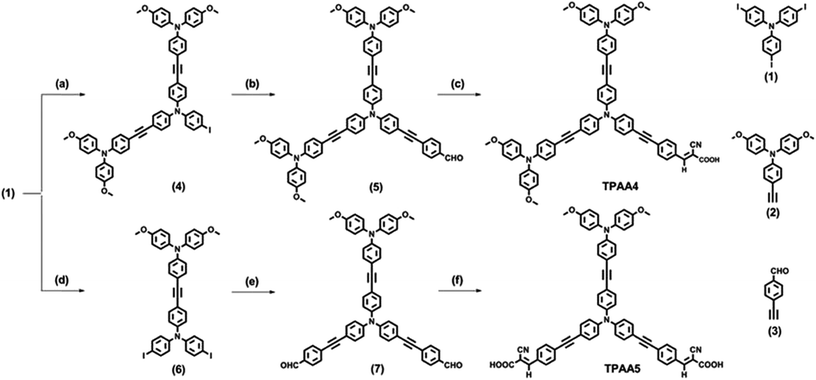 | ||
| Scheme 1 (a) (2), CuI, Pd(II), TEA, THF, 60 °C, 36 h; (b) (3), CuI, Pd(II), DIPA, THF, 60 °C, 36 h; (c) cyanoacetic acid, piperidine, CHCl3, reflux, 12 h (d) (2), CuI, Pd(II), TEA, THF, 60 °C, 36 h; (e) (3), Pd(II), CuI, DIPA, THF, 60 °C, 36 h; (f) cyanoacetic acid, piperidine, CHCl3, reflux, 12 h. Compounds 1, 2 and 3 were prepared as per previously reported procedures.51–53 | ||
![[thin space (1/6-em)]](https://www.rsc.org/images/entities/char_2009.gif) :
:![[thin space (1/6-em)]](https://www.rsc.org/images/entities/char_2009.gif) 8) gave 4 (870 mg, 35%). 1H NMR (CDCl3, 500 MHz), δ (ppm): 3.81 (s, 12H), 6.86 (m, 14H), 7.01 (d, 4H), 7.07 (m, 8H), 7.28 (m, 4H), 7.38 (d, 4H), 7.55 (d, 2H).
8) gave 4 (870 mg, 35%). 1H NMR (CDCl3, 500 MHz), δ (ppm): 3.81 (s, 12H), 6.86 (m, 14H), 7.01 (d, 4H), 7.07 (m, 8H), 7.28 (m, 4H), 7.38 (d, 4H), 7.55 (d, 2H).
![[thin space (1/6-em)]](https://www.rsc.org/images/entities/char_2009.gif) :
:![[thin space (1/6-em)]](https://www.rsc.org/images/entities/char_2009.gif) 1) gave 5 (480 mg, 34%). 1H NMR (CDCl3, 500 MHz), δ (ppm): 3.81 (s, 12H), 6.86 (m, 12H), 7.08 (m, 14H), 7.29 (m, 4H), 7.43 (m, 6H), 7.65 (d, 2H), 10.02 (s, 1H).
1) gave 5 (480 mg, 34%). 1H NMR (CDCl3, 500 MHz), δ (ppm): 3.81 (s, 12H), 6.86 (m, 12H), 7.08 (m, 14H), 7.29 (m, 4H), 7.43 (m, 6H), 7.65 (d, 2H), 10.02 (s, 1H).
![[thin space (1/6-em)]](https://www.rsc.org/images/entities/char_2009.gif) :
:![[thin space (1/6-em)]](https://www.rsc.org/images/entities/char_2009.gif) 9) gave 6 (1.85 g, 35%). 1H NMR (CDCl3, 500 MHz), δ (ppm): 3.81 (s, 6H), 6.84 (m, 10H), 6.98 (d, 2H), 7.07 (d, 4H), 7.29 (d, 2H), 7.39 (d, 2H), 7.55 (d, 4H).
9) gave 6 (1.85 g, 35%). 1H NMR (CDCl3, 500 MHz), δ (ppm): 3.81 (s, 6H), 6.84 (m, 10H), 6.98 (d, 2H), 7.07 (d, 4H), 7.29 (d, 2H), 7.39 (d, 2H), 7.55 (d, 4H).
![[thin space (1/6-em)]](https://www.rsc.org/images/entities/char_2009.gif) :
:![[thin space (1/6-em)]](https://www.rsc.org/images/entities/char_2009.gif) 1) mixture gave 7 (802 mg, 43%). 1H NMR (CDCl3, 500 MHz), δ (ppm): 3.81 (s, 6H), 6.87 (d, 6H), 7.09 (d, 10H), 7.30 (m, 2H), 7.45 (m, 6H), 7.66 (d, 4H), 7.87 (d, 4H), 10.02 (s, 2H).
1) mixture gave 7 (802 mg, 43%). 1H NMR (CDCl3, 500 MHz), δ (ppm): 3.81 (s, 6H), 6.87 (d, 6H), 7.09 (d, 10H), 7.30 (m, 2H), 7.45 (m, 6H), 7.66 (d, 4H), 7.87 (d, 4H), 10.02 (s, 2H).
Results and discussion
Synthesis and characterization
Sonogashira coupling was employed to attach methoxy-substituted triphenylamine donors and the 4-ethynylbenzaldehyde groups to the central triphenylamine core (see Scheme 1). In the final step, the aldehydes were converted to cyanoacetic acid derivatives by refluxing with cyanoacetic acid in the presence of piperidine in dry chloroform. The proposed structures of all the final compounds were confirmed using characterization techniques such as NMR, 13C, IR and HRMS-ESI spectroscopic measurements. All the intermediate compounds were found to be soluble in non-polar solvents like dichloromethane, chloroform, and tetrahydrofuran. In the case of the final compounds, TPAA4 and TPAA5, it was observed that solubility decreased with increase in the number of cyanoacetic acid groups. Both the dyes were found to be thermally stable even at 350 °C as revealed by differential scanning calorimetric analysis (Fig. S2, ESI†).Photophysical properties
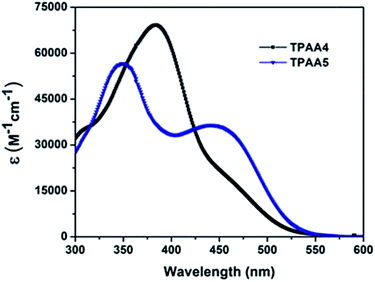
The absorption spectra of the dyes in chloroform are given in Fig. 2. The influence of the increase in cyanoacetic acid acceptor groups on the charge transfer characteristics of the dyes can be clearly seen from the absorption spectra of the dyes. Both dyes exhibited two prominent peaks, one which lies in the UV-region, corresponding to π–π* transition that occurs in the molecules upon light absorption, and the other whose λmax lies in the blue region of the electromagnetic spectrum is attributed to the charge transfer (CT) character. The effect of increasing cyanoacetic acid acceptor groups in TPAA5 in comparison to TPAA4 shows the same trend in the CT absorption band, as previously reported for TPAA1 and TPAA2.45 The intensity of the CT band for TPAA5 (λmax = 445 nm, ε = 36![[thin space (1/6-em)]](https://www.rsc.org/images/entities/char_2009.gif) 000 M−1 cm−1) is much higher than that of TPAA4 (λmax = 435 nm, ε = 27
000 M−1 cm−1) is much higher than that of TPAA4 (λmax = 435 nm, ε = 27![[thin space (1/6-em)]](https://www.rsc.org/images/entities/char_2009.gif) 000 M−1 cm−1) which shows the influence of the number of cyanoacetic acid groups on the CT band absorption. Furthermore, the high energy band in TPAA4 is broadened much, relative to TPAA5. The broadening in this comparison is attributed to the presence of three triphenylamine groups present in TPAA4, compared to two, in TPAA5. This establishes that varying the number of donor and acceptor groups in the same molecule can have a significant effect on the donor–acceptor interactions which will enable us to tune the absorption characteristics of the molecule. The CT bands again show solvent dependence, that is, negative solvatochromism (Fig. S3, ESI†). Here also we propose that the dyes adopt a neutral to a zwitter-ionic structure as solvent polarity increases.45 To see whether the dyes have a tendency to aggregate in solution, absorption at different concentrations was also studied (Fig. S4, ESI†). Measurements indicated that no new bands or shifts were seen at higher concentrations which suggested that both these dyes existed as monomers even at high concentrations. The aggregation tendency of the dyes was further studied by recording their solid state absorption spectra on TiO2. Sintered TiO2 electrodes were immersed in two different dye baths, one of which had chenodeoxycholic acid (CDCA) added to it, which would prevent aggregation of the dyes on the TiO2 surface. The solid state absorption spectra on TiO2, with and without CDCA, were then compared (Fig. S5, ESI†). Absorption spectra in the absence and presence of CDCA are very similar, which again ruled out the possibility of dye aggregation. Solid state fluorescence quenching studies were also carried out (Fig. S6, ESI†). Emission spectra were taken after adsorption of the dyes on alumina and TiO2. Both the dyes showed a high degree of quenching when adsorbed on TiO2 surface while they exhibited emission on alumina. This means that the excited states of both the dyes are positioned at potentials above the conduction band of TiO2, allowing efficient electron injection, and inhibiting the relaxation pathways through fluorescence.
000 M−1 cm−1) which shows the influence of the number of cyanoacetic acid groups on the CT band absorption. Furthermore, the high energy band in TPAA4 is broadened much, relative to TPAA5. The broadening in this comparison is attributed to the presence of three triphenylamine groups present in TPAA4, compared to two, in TPAA5. This establishes that varying the number of donor and acceptor groups in the same molecule can have a significant effect on the donor–acceptor interactions which will enable us to tune the absorption characteristics of the molecule. The CT bands again show solvent dependence, that is, negative solvatochromism (Fig. S3, ESI†). Here also we propose that the dyes adopt a neutral to a zwitter-ionic structure as solvent polarity increases.45 To see whether the dyes have a tendency to aggregate in solution, absorption at different concentrations was also studied (Fig. S4, ESI†). Measurements indicated that no new bands or shifts were seen at higher concentrations which suggested that both these dyes existed as monomers even at high concentrations. The aggregation tendency of the dyes was further studied by recording their solid state absorption spectra on TiO2. Sintered TiO2 electrodes were immersed in two different dye baths, one of which had chenodeoxycholic acid (CDCA) added to it, which would prevent aggregation of the dyes on the TiO2 surface. The solid state absorption spectra on TiO2, with and without CDCA, were then compared (Fig. S5, ESI†). Absorption spectra in the absence and presence of CDCA are very similar, which again ruled out the possibility of dye aggregation. Solid state fluorescence quenching studies were also carried out (Fig. S6, ESI†). Emission spectra were taken after adsorption of the dyes on alumina and TiO2. Both the dyes showed a high degree of quenching when adsorbed on TiO2 surface while they exhibited emission on alumina. This means that the excited states of both the dyes are positioned at potentials above the conduction band of TiO2, allowing efficient electron injection, and inhibiting the relaxation pathways through fluorescence.
Electrochemical properties
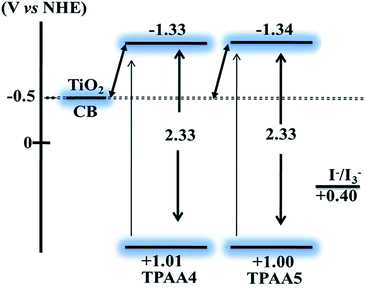
The oxidation potentials of the dyes were determined using the differential pulse voltammetry (DPV) technique in acetonitrile using (n-Bu)4NPF6 as the supporting electrolyte (Fig. S7, ESI†). The first oxidation potentials of both the dyes were found to be at around 1.00 V (vs. NHE), indicating similar sites for the removal of the first electron, which could probably be the triphenylamine core. Calculations of the highest occupied molecular orbital (HOMO) and lowest unoccupied molecular orbital (LUMO) potentials (vs. NHE) were done from the DPV data and the absorption band edge.The band gap values obtained are given in Fig. 3. Both TPAA4 and TPAA5 were found to have similar HOMO–LUMO energy values. For both the dyes the HOMO is found to be positive enough to facilitate efficient regeneration using the I−/I3− redox couple and LUMO is also positioned at energy levels giving sufficient driving force for injection of electrons to the conduction band of TiO2. Thus the redox properties measured indicated favourable characteristics for the dyes to act as suitable sensitizers in DSCs.
Infrared spectroscopic studies
To study and understand the mode of interaction of TPAA4 and TPAA5 dyes on the TiO2 surface, infrared spectroscopic studies were carried out. It is widely accepted that carboxylic acids deprotonate on the surface of TiO2 and bind as the anion.58 The precise mode of binding is unknown, but the most predicted patterns are bidentate bridging, bidentate chelating and the unidentate modes (Fig. S8, ESI†).59The Deacon and Phillips empirical rule has been used to predict the mode of binding adopted by TPAA4 and TPAA5. According to this rule, if the difference between the asymmetric and symmetric carboxylate bands (Δν) in the adsorbed state is significantly less than that in the free anionic state, the mode of binding is bidentate chelating.
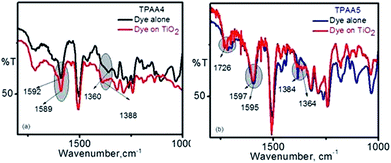
If it is equal, it is bidentate bridging, and if it is greater, the mode of binding is predicted to be unidentate.60 The infrared spectra obtained for our dyes are given in Fig. 4.
For TPAA4, the difference between the bands in the free anion state is found to be 232 cm−1, Δν = (1592 − 1360) cm−1 and that in the adsorbed state was found to be 201 cm−1, Δν = (1589 − 1388) cm−1. For TPAA5, it was found to be 211 cm−1, Δν = (1595 − 1384) cm−1 in the free state and 233 cm−1, Δν = (1597 − 1364) cm−1 in the adsorbed state. As in the case of our previously reported dyes, it is the symmetric band which is affected upon binding to the TiO2 surface.45 In the case of TPAA4 having only one carboxylic acid for anchoring, the symmetric band vibrates at higher frequencies upon binding whereas in TPAA5, which has two carboxylic acid binding groups, the symmetric band shifts to lower frequencies upon binding to TiO2. This change in the band absorption can be clearly seen from the IR spectra (Fig. 4). This is understandable in the context that for TPAA5, there will be competition between one of the carboxylates binding and both carboxylate groups trying to bind. Going by the Deacon and Phillips empirical rule, TPAA4 having one anchoring group thus indicates a bidentate chelating mode while TPAA5 having two anchoring groups shows a unidentate mode of binding onto the TiO2 surface. The presence of the IR band at ∼1725 cm−1 for both the dyes indicates the chance of a few molecules being adsorbed through hydrogen bonding interactions and also possibly the presence of some unadsorbed dye molecules.
Computational analysis
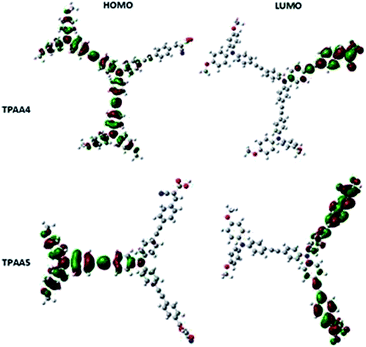
Density functional theory (DFT) calculations were performed on both the dyes using a Gaussian 09W program package at the B3LYP/6-31G*(d) level and the electron distribution obtained is given in Fig. 5.61 The electron distribution in the HOMO of both dyes lies with the triphenylamine donor and the oxygen atoms of the methoxy groups attached to it. The electron distribution is spread over all the three triphenylamine units in the case of TPAA4. This indicates that the triple bonds do not interfere with the electronic communication between the triphenylamine moieties and serve to provide rigidity as well as delocalization of the electron cloud. The electron distribution in the LUMO of both dyes lies with the cyanoacetic acid bearing arms of the molecules, with electron density primarily concentrated in the oxygen atoms of the carboxylate groups. This ensures that efficient electron transfer occurs upon excitation of the molecule through light absorption when it is anchored through the carboxylate moiety to the TiO2 semiconductor surface. The low-lying HOMO − 1, HOMO − 2 levels and unoccupied LUMO + 1 and LUMO + 2 levels are given in Fig. S9 and S10, ESI.†Photovoltaic performance
Fabricated devices were measured under AM 1.5G simulated sunlight. The J–V and IPCE plots obtained are shown in Fig. 6. The photovoltaic parameters obtained are listed in Table 1. DSCs fabricated using TPAA4 gave values of Jsc = 12.59 ± 0.08 mA cm−2, Voc = 0.70 ± 0.006 V and FF = 0.74 ± 0.1, corresponding to an overall efficiency of 6.52 ± 0.09%.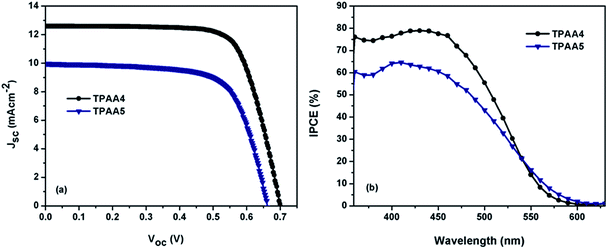 | ||
| Fig. 6 (a) Current density versus potential characteristic curves and (b) IPCE of TPAA4 and TPAA5 based dye-sensitized solar cells under 100 mW cm−2, AM 1.5G illumination. | ||
| Dye | J sc (mA cm−2) | V oc (V) | FF | η (%) | β | J 0 (mA) |
|---|---|---|---|---|---|---|
| TPAA4 | 12.59 ± 0.08 | 0.70 ± 0.006 | 0.74 ± 0.1 | 6.52 ± 0.09 | 0.44 | 9 × 10⁻⁶ |
| TPAA5 | 9.96 ± 0.04 | 0.66 ± 0.008 | 0.70 ± 0.1 | 4.60 ± 0.07 | 0.36 | 1 × 10⁻³ |
At the same time, TPAA5 based devices gave values of Jsc = 9.96 ± 0.04 mA cm−2, Voc = 0.66 ± 0.008 V and FF = 0.70 ± 0.1, corresponding to an overall conversion efficiency of 4.60 ± 0.07%. The J–V data were fitted with the diode model (eqn (1)) and the recombination parameter β was determined. β was found to be 0.44 for TPAA4 and 0.36 for TPAA5.
| J(V) = Jsc − J0(eqVβ/kβT − 1) | (1) |
A higher β value of 0.44 for TPAA4 in comparison to 0.36 for TPAA5 clearly suggests that the former is more capable of preventing recombination by virtue of its molecular design leading to a better lifetime. This is supported by more than three orders decrease in dark exchange current density (J0) for TPAA4 in comparison to TPAA5. It should also be noted that the trend in β value is in agreement with the trend in FF, TPAA4 with a higher β value contributed to a better FF of 0.74 in comparison to 0.70 for TPAA5. From the IPCE spectra, it is evident that both TPAA4 and TPAA5 are capable of converting visible light to photocurrent in the 300–600 nm region. This correlates well with the solid state absorption spectra of these dyes on TiO2 (Fig. S5, ESI†). It is to be noted that TPAA4 has a better IPCE profile compared to TPAA5, matching well with the J–V results.
To unravel the mechanism of interfacial charge dynamics of devices fabricated using TPAA4 and TPAA5, EIS was employed in detail. The impedance spectra were recorded at direct applied potentials from 0.65 V to 0.85 V, stepped in at 50 mV increments, with a 10 mV alternating potential superimposed on the direct bias. The frequency range was from 100 mHz to 100 kHz in logarithmically increasing order. All the EIS measurements were carried out in the dark. The Nyquist and Bode plots for the applied potential range from 0.65 V to 0.85 V are given in the ESI (Fig. S12 to S15)† and the representative plots at 0.7 V are shown in Fig. 7 which was found to have two distinguished semicircles.
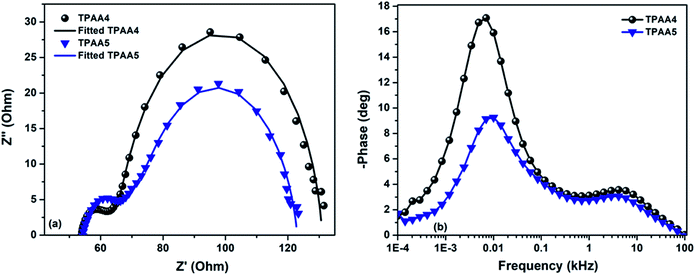 | ||
| Fig. 7 (a) Nyquist plot and (b) Bode plot from the EIS spectra for the DSCs based on TPAA4 and TPAA5 using an iodide/triiodide electrolyte in the dark at 0.7 V. | ||
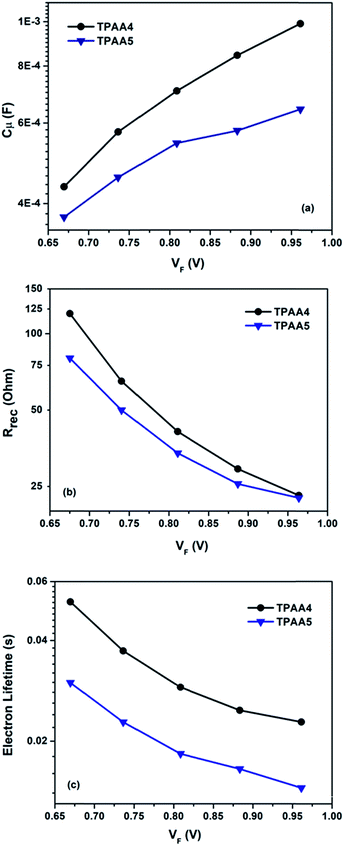
The semicircle at a higher frequency (1–100 kHz) corresponds to charge dynamics at the platinum/electrolyte interface. The semicircle at a lower frequency (100 mHz to 1 kHz) corresponds to charge dynamics at the electrolyte/TiO2 interface. The third arch which is observed in DSCs at a lower frequency (<1 kHz) was not seen in both TPAA4 and TPAA5. It should be noted that with standard optimized I−/I3− electrolytes in which the diffusion coefficient is high, the chance of the third semicircle merging with the second one, giving rise to a single deformed semicircle, is quite common. Also if Rd (resistance associated with the diffusion of I−/I3−) is small enough, the third arch becomes negligible.62,63 The Nyquist plots were fitted with the equivalent circuit model given in Fig. S16, ESI.† The equivalent-circuit model consists of sheet resistance (Rs), the impedance at the electrolyte/Pt interface (RPt and CPt) and impedance at the electrolyte/TiO2 interface (B2). B2 is the transmission line model proposed by Bisquert et al.64–66 The fitted parameters are plotted in Fig. 8 as a function of the corrected potential (VF). The corrected potential is obtained after subtracting the voltage drop due to series resistance (Vs) from applied voltage as given in eqn (2).67
| VF = Vapp + Vs = Vapp − IRseries | (2) |
| Rseries = Rs + RPt + Rd | (3) |
Furthermore, lifetime (τn) was calculated directly from the obtained parameters (Rct and Cμ) by fitting the data as per the reported procedures and are listed in Table 2.69–72
| Dye | C μ (F) | R ct (Ω) | τ n (ms) |
|---|---|---|---|
| TPAA4 | 5.73 × 10⁻⁴ | 64.87 | 37.2 |
| TPAA5 | 4.56 × 10⁻⁴ | 49.86 | 22.75 |
The chemical capacitance (Cμ) and transport resistance (Rt) are directly related to the conduction band of TiO2 (Ec) by the relationships (4) and (5),
| Cμ ∝ exp[−α(Ec − EFn)/(kBT)] | (4) |
| Rt ∝ exp[EFn − Ec/(kBT)] | (5) |
Both Cμ and Rt are proportional to the density of states (DOS) which includes transport states in the conduction band and trap states in the bulk.73 From the analysis of the variation of Cμ as a function of corrected potential (Fig. 8a), we can straight forwardly identify the upward shift in TiO2 conduction band edge (Ec) for TPAA5 in comparison to TPAA4. We attribute this change in conduction band to the difference in the number of carboxylic acid groups available for binding with the semiconductor surface in TPAA4 and TPAA5 as well as the different binding modes which can also contribute towards a difference in dipole moment exhibited by both the dyes as explained in detail in the IR-spectroscopic section.62,74,75 Open circuit voltage is given by the relationship Voc = (EFn − Eredox)/q, which depends mainly on two factors (i) position of the TiO2 conduction band and (ii) recombination resistance. Even with a positive shift in conduction band edge, TPAA4 delivered 40 mV more Voc in comparison to TPAA5. From Fig. 8b and c, a greater recombination resistance and hence a better electron lifetime trend for TPAA4 was observed as compared to TPAA5 augmented by the superior hole separation aided by the two peripheral triphenylamine groups in TPAA4 compared to the one in TPAA5 and structural effects which prevented the oxidized species in the electrolyte from coming near the TiO2 surface as illustrated in Scheme 2, where TPAA5, due to its open structure, creates a channel for the smaller triiodide ions to get closer to the semiconductor surface resulting in more recombination. Therefore, we believe that even though TPAA5 is expected to deliver higher voltage than TPAA4 considering the position of the conduction band, due to its higher recombination rate/lower lifetime, TPAA5 exhibited less Voc compared to TPAA4. This is also supported by the dark J–V plots given in Fig. S11, ESI.† Also, the recombination driving force for TPAA4 is lower in comparison to TPAA5, considering the CB position which also helped in improving the lifetime of TPAA4 as discussed previously by Ondersma et al.73
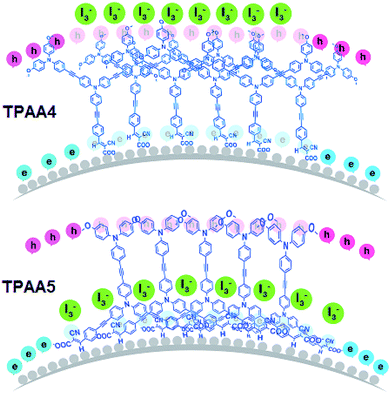 | ||
| Scheme 2 Pictorial representation of the possible orientation of TPAA4 and TPAA5 monolayers on TiO2 surface. | ||
The amount of dyes adsorbed on TiO2 was determined using the desorption technique where TPAA4 was found to have a concentration of 4.58 × 10⁻⁷ mol cm−2 whereas TPAA5 was found to have 8.61 × 10⁻⁷ mol cm−2. Even though the concentration of TPAA5 dye molecules was found to be higher on the semiconductor surface it didn't bring about higher current due to the higher recombination prevailing for TPAA5 in comparison to TPAA4.
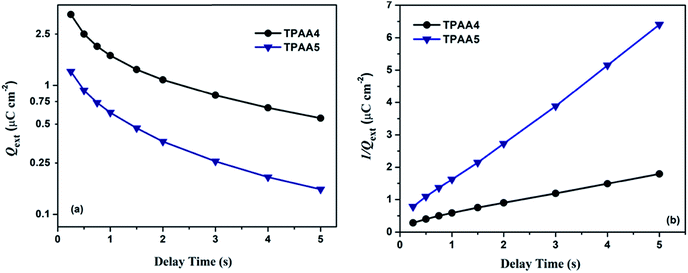
In order to further investigate in detail the recombination/charge transfer dynamics along with understanding the involvement of trap states towards recombination, we performed charge extraction (CE) measurements. CE was carried out under illumination using a 470 nm LED light. It is quite clear from Fig. 9a that TPAA4 is more efficient in preventing recombination resulting in a better lifetime in comparison to TPAA5 in tune with the EIS measurements. In the present case the extracted charge decay is hyperbolic and the plot of 1/Q(t) vs. delay time from t = 0 s to t = 5 s is linear as given in Fig. 9b from which it can be concluded that for both TPAA4 and TPAA5 the recombination is expected to take place from the conduction band as explained by Duffy et al. and the chance of recombination occurring from the deep trap states can be eliminated.76
To study the dynamics of charge recombination in DSCs based on TPAA4 and TPAA5 dyes, intensity-modulated photovoltage spectroscopic (IMVS) measurements were performed at variable intensities. A monochromatic blue LED having wavelength 470 nm was used as the light source for illumination. The amplitude of the sinusoidal modulation for IMVS measurements was 10% of the dc illumination at a frequency range of 1 Hz to 10 kHz. The effective electron lifetime (τn) was calculated from the formula ‘τn = 1/2πfm’ where fm is the frequency corresponding to the highest value of the imaginary part (−H′′) in the Nyquist spectrum. The corresponding lifetimes at various illumination intensities are shown in Fig. 10. The lifetimes for both dyes are intensity dependent which indicates that the recombination of electrons with the oxidized form in the electrolyte follows second order kinetics which is well in agreement with the trend in decay plots obtained using the charge extraction technique. It is also to be noted that the electron recombination is more pronounced at higher illumination intensities. The values of electron lifetime or recombination time (τn) were in the order of TPAA5 < TPAA4, in accordance with the results of EIS and CE measurements, which led to higher photocurrent and photovoltage for the DSCs based on TPAA4. Both TPAA4 and TPAA5 maintained consistent stability up to 500 hours. The results are given in Fig. S17, ESI.†
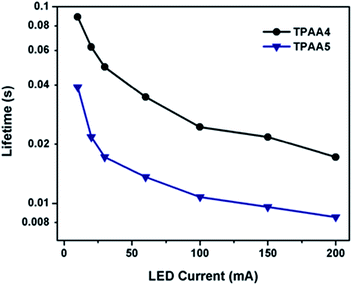 | ||
| Fig. 10 Electron lifetime as a function of LED current for DSCs based on TPAA4 and TPAA5 sensitizers measured by IMVS. | ||
In comparison to the previously reported parent dyes, TPAA1 and TPAA2 (Table S1, ESI†), the introduction of peripheral hole acceptors in TPAA4 and TPAA5 was propitious in the separation of holes and electrons leading to an overall improvement of 29.1% in efficiency for TPAA1 and 11.1% for TPAA2. Going from TPAA1 to TPAA4 there was an addition of two TPA groups compared to one in the periphery moving from TPAA2 to TPAA5, which resulted in achieving better improvement for the former. In addition to this, the additional TPA groups helped in improving the absorption profile and also served the purpose of efficiently blocking the oxidized component in the electrolyte from coming near the TiO2 surface which also contributed to the improved performance.
Conclusion
Conventional D–π–A systems are rod-like molecules resulting in aggregation and more recombination. In a way to overcome this limitation, we designed and developed two novel structurally engineered branched starburst shaped triphenylamine dyes, TPAA4 and TPAA5 by the introduction of hole acceptor antennas to the existing core through alkenyl linkages, which are capable of separating the holes and electrons thereby preventing recombination and aggregation to a greater extent. A detailed insight into the various charge dynamics in fabricated devices was provided using a range of electrical and optical small and large perturbation techniques. The variations in performance between both the dyes are attributed to the difference in the lifetime as evident from EIS, charge extraction and IMVS measurements where the recombination of conduction band electrons plays a major role. It is quite clear from the analysis that in both the dyes the involvement of trap states can be considered to be minimal.TPAA4 exhibited a higher recombination resistance and better lifetime which are attributed to the presence of two peripheral hole transporting groups that aid in better charge separation along with the nature of orientation of dyes on the TiO2 surface, which helped in shielding the electrons in TiO2 from the oxidised species in the electrolyte leading to a better performance for TPAA4 in comparison to TPAA5. The recombination parameter β and dark exchange current J0 also provided support concerning the above consideration. We firmly believe that the present understanding of the detailed dynamics of these organic dyes will help us to finetune their properties in such a way to use them as potential future candidates for alternative cobalt and copper based redox couples for indoor light harvesting applications.
Conflicts of interest
There are no conflicts to declare.Acknowledgements
S. S. gratefully acknowledges financial support from DST-INSPIRE Faculty Award (IFA 13-CH-115). We also thank DST for the DST-SERI Project, Indo-European collaborative project OISC/LARGECELLS, M2D, MNRE and CSIR-TAPSUN programs. M. V. V. and T. M. L. thank CSIR, M. Y. thanks UGC and S. C.·P thanks DST-SERI for research fellowships. Mr Mohammed Shaban is acknowledged for the graphical drawings.References
- B. O'Regan and M. Grätzel, Nature, 1991, 353, 737–740 CrossRef.
- M. K. Nazeeruddin, Nature, 2016, 538, 463–464 CrossRef PubMed.
- L. M. Goncalves, V. de Zea Bermudez, H. A. Ribeiro and A. M. Mendes, Energy Environ. Sci., 2008, 1, 655–667 CAS.
- K. Kakiage, Y. Aoyama, T. Yano, K. Oya, J.-I. Fujisawa and M. Hanaya, Chem. Commun., 2015, 51, 15894–15897 RSC.
- M. Freitag, J. Teuscher, Y. Saygili, X. Zhang, F. Giordano, P. Liska, J. Hua, S. M. Zakeeruddin, J.-E. Moser, M. Grätzel and A. Hagfeldt, Nat. Photonics, 2017, 11, 372–378 CrossRef CAS.
- M. A. Green, K. Emery, Y. Hishikawa and W. Warta, Progress in Photovoltaics: Research and Applications, 2011, 19, 84–92 CrossRef CAS.
- G. Marsh, Refocus, 2008, 9, 58–62 CrossRef.
- J. Eliasson, J. Delsing, S. Thompson, Y.-B. Cheng and P. Chen, Int. J. Adv. Syst. Meas., 2012, 5(1 & 2), 45–54 Search PubMed.
- C.-L. Wang, P.-T. Lin, Y.-F. Wang, C.-W. Chang, B.-Z. Lin, H.-H. Kuo, C.-W. Hsu, S.-H. Tu and C.-Y. Lin, J. Phys. Chem. C, 2015, 119, 24282–24289 CAS.
- J. R. Jennings, A. Ghicov, L. M. Peter, P. Schmuki and A. B. Walker, J. Am. Chem. Soc., 2008, 130, 13364–13372 CrossRef CAS PubMed.
- E. Ghadiri, N. Taghavinia, S. M. Zakeeruddin, M. Grätzel and J.-E. Moser, Nano Lett., 2010, 10, 1632–1638 CrossRef CAS PubMed.
- A. Listorti, B. O'Regan and J. R. Durrant, Chem. Mater., 2011, 23, 3381–3399 CrossRef CAS.
- K. Sunahara, A. Furube, R. Katoh, S. Mori, M. J. Griffith, G. G. Wallace, P. Wagner, D. L. Officer and A. J. Mozer, J. Phys. Chem. C, 2011, 115, 22084–22088 CAS.
- Y. Hao, W. Yang, L. Zhang, R. Jiang, E. Mijangos, Y. Saygili, L. Hammarström, A. Hagfeldt and G. Boschloo, Nat. Commun., 2016, 7, 13934 CrossRef CAS PubMed.
- L. Han, A. Islam, H. Chen, C. Malapaka, B. Chiranjeevi, S. Zhang, X. Yang and M. Yanagida, Energy Environ. Sci., 2012, 5, 6057–6060 CAS.
- K. Cao, J. Lu, J. Cui, Y. Shen, W. Chen, G. Alemu, Z. Wang, H. Yuan, J. Xu, M. Wang and Y. Cheng, J. Mater. Chem. A, 2014, 2, 4945–4953 CAS.
- W.-C. Chen, F.-T. Kong, Z.-Q. Li, J.-H. Pan, X.-P. Liu, F.-L. Guo, L. Zhou, Y. Huang, T. Yu and S.-Y. Dai, ACS Appl. Mater. Interfaces, 2016, 8, 19410–19417 CAS.
- A. Yella, H.-W. Lee, H. N. Tsao, C. Yi, A. K. Chandiran, M. K. Nazeeruddin, E. W.-G. Diau, C.-Y. Yeh, S. M. Zakeeruddin and M. Grätzel, Science, 2011, 334, 629–634 CrossRef CAS PubMed.
- T. Higashino and H. Imahori, Dalton Trans., 2015, 44, 448–463 RSC.
- M.-E. Ragoussi, M. Ince and T. Torres, Eur. J. Org. Chem., 2013, 2013, 6475–6489 CrossRef CAS.
- Z.-S. Huang, X.-F. Zang, T. Hua, L. Wang, H. Meier and D. Cao, ACS Appl. Mater. Interfaces, 2015, 7, 20418–20429 CAS.
- X. Li, Y. Hu, I. Sanchez-Molina, Y. Zhou, F. Yu, S. A. Haque, W. Wu, J. Hua, H. Tian and N. Robertson, J. Mater. Chem. A, 2015, 3, 21733–21743 CAS.
- B. Liu, W. Zhu, Q. Zhang, W. Wu, M. Xu, Z. Ning, Y. Xie and H. Tian, Chem. Commun., 2009, 1766–1768 RSC.
- Z. Wang, H. Wang, M. Liang, Y. Tan, F. Cheng, Z. Sun and S. Xue, ACS Appl. Mater. Interfaces, 2014, 6, 5768–5778 CAS.
- G. H. Summers, J.-F. Lefebvre, F. A. Black, E. Stephen Davies, E. A. Gibson, T. Pullerits, C. J. Wood and K. Zidek, Phys. Chem. Chem. Phys., 2016, 18, 1059–1070 RSC.
- N. Kaneza, J. Zhang, H. Liu, P. S. Archana, Z. Shan, M. Vasiliu, S. H. Polansky, D. A. Dixon, R. E. Adams, R. H. Schmehl, A. Gupta and S. Pan, J. Phys. Chem. C, 2016, 120, 9068–9080 CAS.
- S. Soman, M. A. Rahim, S. Lingamoorthy, C. H. Suresh and S. Das, Phys. Chem. Chem. Phys., 2015, 17, 23095–23103 RSC.
- A. Gopi, S. Lingamoorthy, S. Soman, K. Yoosaf, R. Haridas and S. Das, J. Phys. Chem. C, 2016, 120, 26569–26578 CAS.
- Y. Tang, Y. Wang, X. Li, H. Ågren, W.-H. Zhu and Y. Xie, ACS Appl. Mater. Interfaces, 2015, 7, 27976–27985 CAS.
- H. Ellis, I. Schmidt, A. Hagfeldt, G. Wittstock and G. Boschloo, J. Phys. Chem. C, 2015, 119, 21775–21783 CAS.
- H. Ellis, S. K. Eriksson, S. M. Feldt, E. Gabrielsson, P. W. Lohse, R. Lindblad, L. Sun, H. Rensmo, G. Boschloo and A. Hagfeldt, J. Phys. Chem. C, 2013, 117, 21029–21036 CAS.
- Z. Ning, Q. Zhang, H. Pei, J. Luan, C. Lu, Y. Cui and H. Tian, J. Phys. Chem. C, 2009, 113, 10307–10313 CAS.
- H. Chen, H. Huang, X. Huang, J. N. Clifford, A. Forneli, E. Palomares, X. Zheng, L. Zheng, X. Wang, P. Shen, B. Zhao and S. Tan, J. Phys. Chem. C, 2010, 114, 3280–3286 CAS.
- K. Tang, M. Liang, Y. Liu, Z. Sun and S. Xue, Chin. J. Chem., 2011, 29, 89–96 CrossRef CAS.
- T. Khanasa, N. Jantasing, S. Morada, N. Leesakul, R. Tarsang, S. Namuangruk, T. Kaewin, S. Jungsuttiwong, T. Sudyoadsuk and V. Promarak, Eur. J. Org. Chem., 2013, 2013, 2608–2620 CrossRef CAS.
- F. Zhang, Y.-h. Luo, J.-s. Song, X.-z. Guo, W.-l. Liu, C.-P. Ma, Y. Huang, M.-F. Ge, Z. Bo and Q.-B. Meng, Dyes Pigm., 2009, 81, 224–230 CrossRef CAS.
- X. Jiang, K. M. Karlsson, E. Gabrielsson, E. M. J. Johansson, M. Quintana, M. Karlsson, L. Sun, G. Boschloo and A. Hagfeldt, Adv. Funct. Mater., 2011, 21, 2944–2952 CrossRef CAS.
- D. P. Hagberg, X. Jiang, E. Gabrielsson, M. Linder, T. Marinado, T. Brinck, A. Hagfeldt and L. Sun, J. Mater. Chem., 2009, 19, 7232–7238 RSC.
- Z. Ning, Q. Zhang, W. Wu, H. Pei, B. Liu and H. Tian, J. Org. Chem., 2008, 73, 3791–3797 CrossRef CAS PubMed.
- J. Heo, J.-W. Oh, H.-I. Ahn, S.-B. Lee, S.-E. Cho, M.-R. Kim, J.-K. Lee and N. Kim, Synth. Met., 2010, 160, 2143–2150 CrossRef CAS.
- J. Jia, K. Cao, P. Xue, Y. Zhang, H. Zhou and R. Lu, Tetrahedron, 2012, 68, 3626–3632 CrossRef CAS.
- J. Jia, Y. Zhang, P. Xue, P. Zhang, X. Zhao, B. Liu and R. Lu, Dyes Pigm., 2013, 96, 407–413 CrossRef CAS.
- A. Tigreros, V. Dhas, A. Ortiz, B. Insuasty, N. Martín and L. Echegoyen, Sol. Energy Mater. Sol. Cells, 2014, 121, 61–68 CrossRef CAS.
- C.-L. Mai, T. Moehl, Y. Kim, F.-Y. Ho, P. Comte, P.-C. Su, C.-W. Hsu, F. Giordano, A. Yella, S. M. Zakeeruddin, C.-Y. Yeh and M. Gratzel, RSC Adv., 2014, 4, 35251–35257 RSC.
- M. V. Vinayak, T. M. Lakshmykanth, M. Yoosuf, S. Soman and K. R. Gopidas, Sol. Energy, 2016, 124, 227–241 CrossRef CAS.
- C.-H. Yang, H.-L. Chen, Y.-Y. Chuang, C.-G. Wu, C.-P. Chen, S.-H. Liao and T.-L. Wang, J. Power Sources, 2009, 188, 627–634 CrossRef CAS.
- T. Kitamura, M. Ikeda, K. Shigaki, T. Inoue, N. A. Anderson, X. Ai, T. Lian and S. Yanagida, Chem. Mater., 2004, 16, 1806–1812 CrossRef CAS.
- C. Teng, X. Yang, C. Yang, H. Tian, S. Li, X. Wang, A. Hagfeldt and L. Sun, J. Phys. Chem. C, 2010, 114, 11305–11313 CAS.
- M. Liang and J. Chen, Chem. Soc. Rev., 2013, 42, 3453–3488 RSC.
- J. Shi, J. Huang, R. Tang, Z. Chai, J. Hua, J. Qin, Q. Li and Z. Li, Eur. J. Org. Chem., 2012, 2012, 5248–5255 CrossRef CAS.
- T.-C. Lin, W.-L. Lin, C.-M. Wang and C.-W. Fu, Eur. J. Org. Chem., 2011, 2011, 912–921 CrossRef.
- C. Lambert, G. Nöll, E. Schmälzlin, K. Meerholz and C. Bräuchle, Chem.–Eur. J, 1998, 4, 2129–2135 CrossRef CAS.
- Y.-Q. Sun, J. He, Z. Xu, G. Huang, X.-P. Zhou, M. Zeller and A. D. Hunter, Chem. Commun., 2007, 4779–4781 RSC.
- T. Kaewpuang, N. Prachumrak, S. Namuangruk, S. Jungsuttiwong, T. Sudyoadsuk, P. Pattanasattayavong and V. Promarak, Eur. J. Org. Chem., 2016, 2016, 2528–2538 CrossRef CAS.
- Y. Hao, E. Gabrielsson, P. W. Lohse, W. Yang, E. M. J. Johansson, A. Hagfeldt, L. Sun and G. Boschloo, Adv. Sci., 2015, 2, 1500174 CrossRef PubMed.
- S. M. Feldt, E. A. Gibson, E. Gabrielsson, L. Sun, G. Boschloo and A. Hagfeldt, J. Am. Chem. Soc., 2010, 132, 16714–16724 CrossRef CAS PubMed.
- Y. Hao, H. Tian, J. Cong, W. Yang, I. Bora, L. Sun, G. Boschloo and A. Hagfeldt, ChemPhysChem, 2014, 15, 3476–3483 CrossRef CAS PubMed.
- T. Suresh, R. K. Chitumalla, N. T. Hai, J. Jang, T. J. Lee and J. H. Kim, RSC Adv., 2016, 6, 26559–26567 RSC.
- A. Abbotto, N. Manfredi, C. Marinzi, F. De Angelis, E. Mosconi, J.-H. Yum, Z. Xianxi, M. K. Nazeeruddin and M. Gratzel, Energy Environ. Sci., 2009, 2, 1094–1101 CAS.
- K. S. Finnie, J. R. Bartlett and J. L. Woolfrey, Langmuir, 1998, 14, 2744–2749 CrossRef CAS.
- M. Frisch, G. Trucks, H. Schlegel, G. Scuseria, M. Robb, J. Cheeseman, G. Scalmani, V. Barone, B. Mennucci and G. Petersson, Gaussian Inc, Wallingford CT, 2009 Search PubMed.
- J. Bisquert and V. S. Vikhrenko, J. Phys. Chem. B, 2004, 108, 2313–2322 CrossRef CAS.
- J. Bisquert and I. Mora-Seró, J. Phys. Chem. Lett., 2010, 1, 450–456 CrossRef CAS.
- J. Bisquert, J. Phys. Chem. B, 2002, 106, 325–333 CrossRef CAS.
- S. K. Yadav, S. Ravishankar, S. Pescetelli, A. Agresti, F. Fabregat-Santiago and A. Di Carlo, Phys. Chem. Chem. Phys., 2017, 19, 22546–22554 RSC.
- S. Sarker, A. J. S. Ahammad, H. W. Seo and D. M. Kim, Int. J. Photoenergy, 2014, 2014, 17 CrossRef.
- S. R. Raga, E. M. Barea and F. Fabregat-Santiago, J. Phys. Chem. Lett., 2012, 3, 1629–1634 CrossRef CAS PubMed.
- W. Liua, L. Hua, S. Daia, L. Guoa, N. Jiangb and D. Kou, Electrochim. Acta, 2010, 55, 2338–2343 CrossRef.
- J. R. Jennings and Q. Wang, J. Electrochem. Soc., 2012, 159(6), 141–149 CrossRef.
- Y. Liu, J. R. Jennings, S. M. Zakeeruddin, M. Grätzel and Q. Wang, J. Am. Chem. Soc., 2013, 135, 3939–3952 CrossRef CAS PubMed.
- S. Sasidharan, S. Soman, S. C. Pradhan, K. N. N. Unni, A. A. P. Mohamed, B. N. Nair and H. U. N. Saraswathy, New J. Chem., 2017, 41, 1007–1016 RSC.
- F. Fabregat-Santiago, G. Garcia-Belmonte, I. Mora-Sero and J. Bisquert, Phys. Chem. Chem. Phys., 2011, 13, 9083–9118 RSC.
- J. W. Ondersma and T. W. Hamann, J. Phys. Chem. C, 2010, 114, 638–645 CAS.
- S. Nakade, Y. Saito, W. Kubo, T. Kanzaki, T. Kitamura, Y. Wada and S. Yanagida, Electrochem. Commun., 2003, 5, 804–808 CrossRef CAS.
- Y.-X. Weng, L. Li, Y. Liu, L. Wang and G.-Z. Yang, J. Phys. Chem. B, 2003, 107, 4356–4363 CrossRef CAS.
- N. W. Duffy, L. M. Peter, R. M. G. Rajapakse and K. G. U. Wijayantha, J. Phys. Chem. B, 2000, 104, 8916–8919 CrossRef CAS.
Footnote |
| † Electronic supplementary information (ESI) available. See DOI: 10.1039/c7se00257b |
| This journal is © The Royal Society of Chemistry 2018 |

