
 Open Access Article
 This Open Access Article is licensed under a Creative Commons Attribution-Non Commercial 3.0 Unported Licence
A DNA nanowire based localized catalytic hairpin assembly reaction for microRNA imaging in live cells†
Qiaomei
Wei
,
Jin
Huang
 *,
Jing
Li
,
Jiaoli
Wang
,
Xiaohai
Yang
,
Jianbo
Liu
and
Kemin
Wang
*,
Jing
Li
,
Jiaoli
Wang
,
Xiaohai
Yang
,
Jianbo
Liu
and
Kemin
Wang
State Key Laboratory of Chemo/Biosensing and Chemometrics, College of Chemistry and Chemical Engineering, Key Laboratory for Bio-Nanotechnology and Molecular Engineering of Hunan Province, Hunan University, Changsha, P. R. China. E-mail: jinhuang@hnu.edu.cn
First published on 20th August 2018
Abstract
Here, we have developed a localized catalytic hairpin assembly (LCHA) strategy for intracellular miR-21 imaging by using DNA nanowires confining both hairpin probes in a compact space. The LCHA is constructed by interval hybridization of DNA hairpin probe pairs to a DNA nanowire with multiplex footholds generated by alternating chain hybridization. Compared to the conventional catalytic hairpin assembly (CHA) strategy, the LCHA significantly shortens the reaction time and enhances the sensitivity. Moreover, the proposed LCHA can serve as a carrier for delivery of probes into live cells as well as protect the probes from nuclease degradation and enhances the stability. We anticipate that this design can be widely applied in facilitating basic biomedical research and disease diagnosis.
Introduction
MicroRNAs (miRNAs) are short noncoding RNA molecules (approximately 19–24 nucleotides) that function in RNA silencing and post-transcriptional regulation of gene expression.1–4 Increasing research evidence has indicated that the dysregulated expression of specific miRNAs is closely associated with the occurrence and development of different cancers and many other pathological conditions.5–7 For instance, miRNA-21 (miR-21) is considered as an oncogene and is upregulated in various cancer cells.8–10 Therefore, miRNAs have been extensively used as viable biomarkers for disease diagnosis, therapy and prognosis, which is expected to be of great clinical significance. In the past two decades, a mass of detection techniques have been developed for miRNA profiling following extraction from cell lysate, such as northern blotting, DNA microarray, and quantitative RT-PCR (qRT-PCR).11 However, detection of average miRNAs in cell populations cannot reveal the cell-to-cell variations. Thus, in situ detection of miRNAs in live cells would be highly desirable.Due to the low abundance of miRNAs in cells, an efficient amplification strategy is imperative for miRNA imaging. For example, Yin et al. developed rational engineering of a dynamic, entropy-driven DNA nanomachine for intracellular miRNA imaging.12,13 Weizmann et al. described a cascade hybridization reaction for amplified live cell miRNA imaging.14 We recently reported gold nanoparticle based DNAzyme probes for intracellular miRNA detection.15,16 In addition, the catalytic hairpin assembly (CHA) reaction is a kind of nonenzymatic DNA catalytic amplification technique, where DNA hairpins act as catalytic energetic traps that can be activated by an initiator strand to yield complex nanostructures through a free-energy-driven isothermal autonomous process, leading to stable duplex DNA nanoscale assemblies.17,18 In the past decade, CHA has been widely used to amplified detect various DNAs and RNAs.19–25 Recently, due to its nonenzymatic and isothermal features, CHA has been developed to amplified sense specific mRNA in live cells.26 However, at least two problems need to be solved. Firstly, the DNA probes cannot freely traverse plasma membranes into live cells. Secondly, the kinetics of CHA depends on the diffusion of free DNA hairpins and is relatively slow (approximately several hours).
Recently, various models have been described showing that confining successive reactants together in a compact space maintains high local concentrations of reagents and accelerates reactions.27–33 Meanwhile, we found that the self-assembled DNA nanowires possessed cell membrane permeability, which could serve as cellular delivery carriers.34,35 Combining the above facts, here, we designed a self-assembled DNA nanowire based localized catalytic hairpin assembly (LCHA) for intracellular miR-21 imaging. As illustrated in Scheme 1, the DNA nanowire with multiplex footholds is generated by alternating hybridization between L1 and L2. Then, H1 and H2 alternately nucleate at the corresponding footholds, respectively. H1 is a self-quenched hairpin structure by labeling with FAM and BHQ1 at appropriate positions, and recovered fluorescence upon hairpin opening. H2 is another hairpin structure anchored at the DNA nanowire adjacent to H1. In the absence of target miR-21, two metastable hairpins, H1 and H2, remain intact, since their cross-reactivity is effectively blocked by intramolecular hybridization. However, in the presence of target miR-21, these two metastable hairpins are catalyzed to undergo a CHA amplification reaction to form numbers of duplexes, in which the fluorescence of H1 would be recovered with amplified signal gain. In this case, The DNA nanowire, composed of L1 and L2, plays two important roles. One is to confine H1 and H2 in a compact space and increase the local concentrations for the CHA reaction. The other is to deliver probes across the cell membrane into the intracellular space without the usage of exotic transfection reagents. Therefore, it created a simple and promising detection system for intracellular RNA imaging.
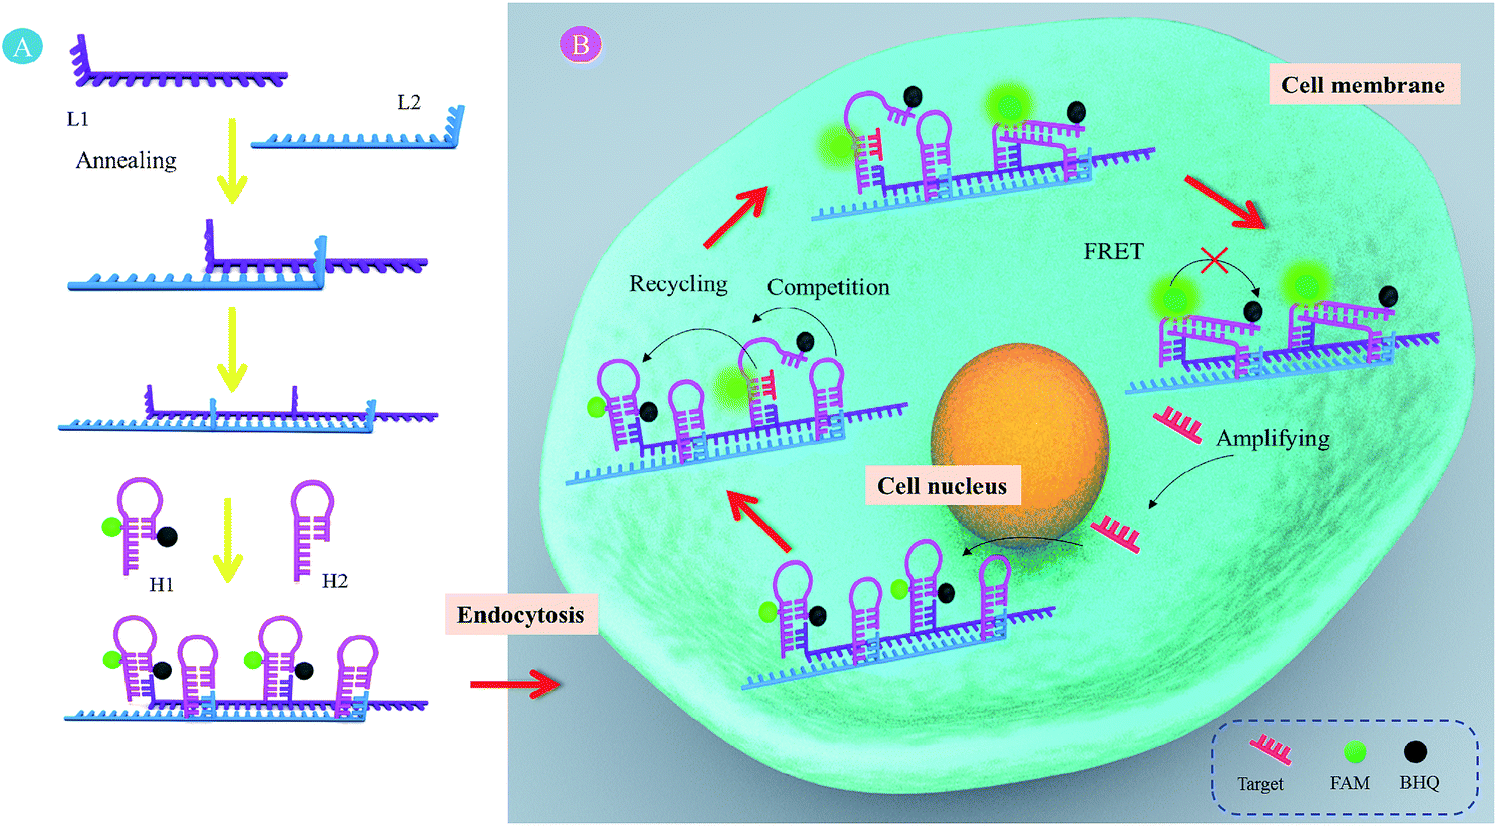 | ||
| Scheme 1 Working principle for in situ detection of miR-21 by the LCHA method. (A) The LCHA system is composed of L1, L2, H1 and H2. (B) The scheme of amplified detection of the intracellular target by LCHA. | ||
Results and discussion
The proposed system was first studied by gel electrophoresis. As shown in Fig. 1, the results of lane 1–4 showed that the CHA could happen only in the presence of H1, H2 and the target (T). It could be observed that there was only one band respectively in lane 1–3 when T was absent, indicating that no CHA occurred. Upon comparison, a new band appeared and the old band disappeared in lane 4 when T was added, suggesting that the CHA had taken place and formed the H1–H2 complex. In the CHA system, T was re-used until the supply of H1 and H2 was exhausted. The results of lane 5–10 indicated that a DNA nanowire could be formed and hairpins could be fixed at the nanowire. It could be shown that the band in lane 5–8 was due to the L1, L2, H1 and H2 monomers, respectively. The high molecular weight products of lane 9 indicated that the nanowire might be formed by a mixture of L1 and L2. Further, the higher molecular weight products of lane 10 suggested that H1 and H2 nucleate at the nanowire, respectively. The DNA nanostructure was also characterized by atomic force microscopy (AFM) (Fig. S1†). The DNA nanostructures had been considered to protect themselves from nuclease degradation.34–38 Here, the stability of LCHA was evaluated by measuring the fluorescence recovery of the fluorescence signal from self-quenched H1 in LCHA upon treatment with cell lysate over 8 h, which was much less than the free H1 (Fig. S2†), indicating that the LCHA structure had the ability to protect H1 from nuclease degradation during intracellular delivery.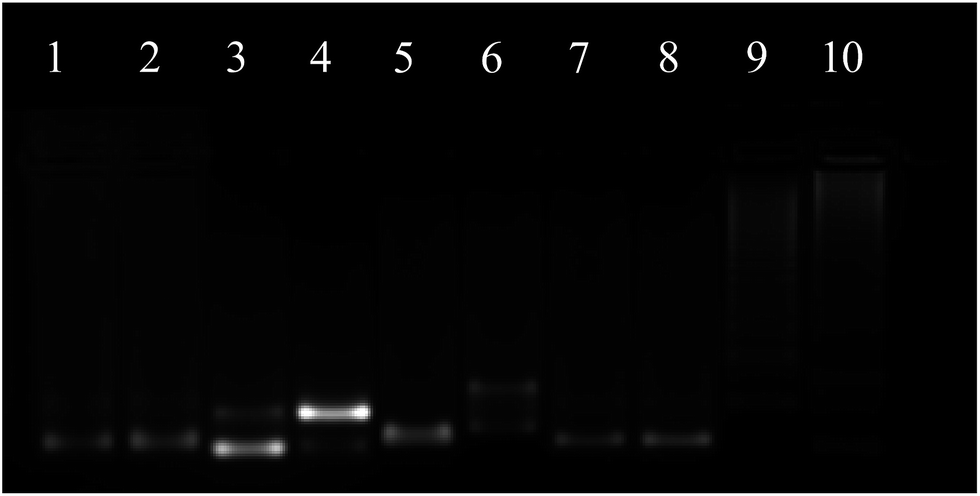 | ||
| Fig. 1 Agarose gel (2%) electrophoresis image of the DNA nanostructure self-assembly and CHA. | ||
Before the fluorescence test, we optimized the ratio of H1 and H2 (Fig. S3†), and the types of buffer (Fig. S4†). The results suggested that the best signal-to-background effect was achieved when the ratio of H1![[thin space (1/6-em)]](https://www.rsc.org/images/entities/char_2009.gif) :H2 is 1:1, and the buffer is Tris–HCl. The in vitro response to target miR-21 was studied in the buffer for comparing LCHA and CHA. The results showed that the LCHA had about a 1.5 times higher fluorescence signal than the CHA, in the presence of the same concentration of target miR-21 (Fig. S5†). This suggested that the LCHA might be more sensitive than the CHA. To study the acceleration of LCHA, we carried out the time-dependent fluorescence analysis in homogeneous solution between LCHA and CHA. The fluorescence recovery from self-quenched H1 was measured for over 400 min in response to 20 nM miR-21 activation. As shown in Fig. 2, compared with CHA, the LCHA resulted in faster fluorescence enhancement with the same concentration of target miR-21. But a fluorescence signal was barely detected from both systems in the absence of miR-21. The completion time for LCHA was about within an hour, which is 5 times shorter than that of CHA. Meanwhile, the fluorescence intensity of LCHA was about 1.5 times higher than that of CHA, which is similar to the result shown in Fig. S5.† Thus, the LCHA could shorten the reaction time and increase the sensitivity.
:H2 is 1:1, and the buffer is Tris–HCl. The in vitro response to target miR-21 was studied in the buffer for comparing LCHA and CHA. The results showed that the LCHA had about a 1.5 times higher fluorescence signal than the CHA, in the presence of the same concentration of target miR-21 (Fig. S5†). This suggested that the LCHA might be more sensitive than the CHA. To study the acceleration of LCHA, we carried out the time-dependent fluorescence analysis in homogeneous solution between LCHA and CHA. The fluorescence recovery from self-quenched H1 was measured for over 400 min in response to 20 nM miR-21 activation. As shown in Fig. 2, compared with CHA, the LCHA resulted in faster fluorescence enhancement with the same concentration of target miR-21. But a fluorescence signal was barely detected from both systems in the absence of miR-21. The completion time for LCHA was about within an hour, which is 5 times shorter than that of CHA. Meanwhile, the fluorescence intensity of LCHA was about 1.5 times higher than that of CHA, which is similar to the result shown in Fig. S5.† Thus, the LCHA could shorten the reaction time and increase the sensitivity.
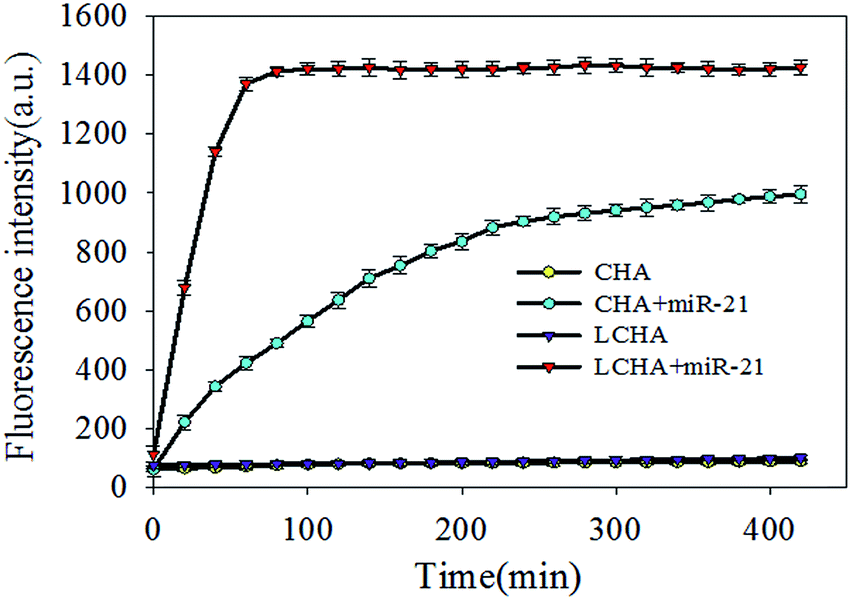 | ||
| Fig. 2 Time-dependent fluorescence spectra of the CHA and LCHA in response to 20 nM miR-21. | ||
The amplification efficiency of LCHA was compared to those of the CHA and H1-target reaction without amplification through in vitro detection of target miR-21 by measuring the FAM fluorescence recovery from self-quenched H1 upon 1 hour incubation. The results shown in Fig. 3(a, d, and g) demonstrated the fluorescence spectra of LCHA, CHA and H1 in response to various concentrations of miR-21, respectively. The results shown in Fig. 3(c, f, and i) are their corresponding calibration curves, respectively. The limit of detection (LOD) is defined as the concentration of the target that yields a net signal equivalent to three times the standard deviation of a series of replicates of the background. The LOD of LCHA, CHA and H1 was calculated to be 2.0 pM, 23.6 pM and 1.3 nM, respectively. In contrast, the LOD for LCHA was about 11.8-fold lower than that of CHA and 650.0-fold lower than that of H1.
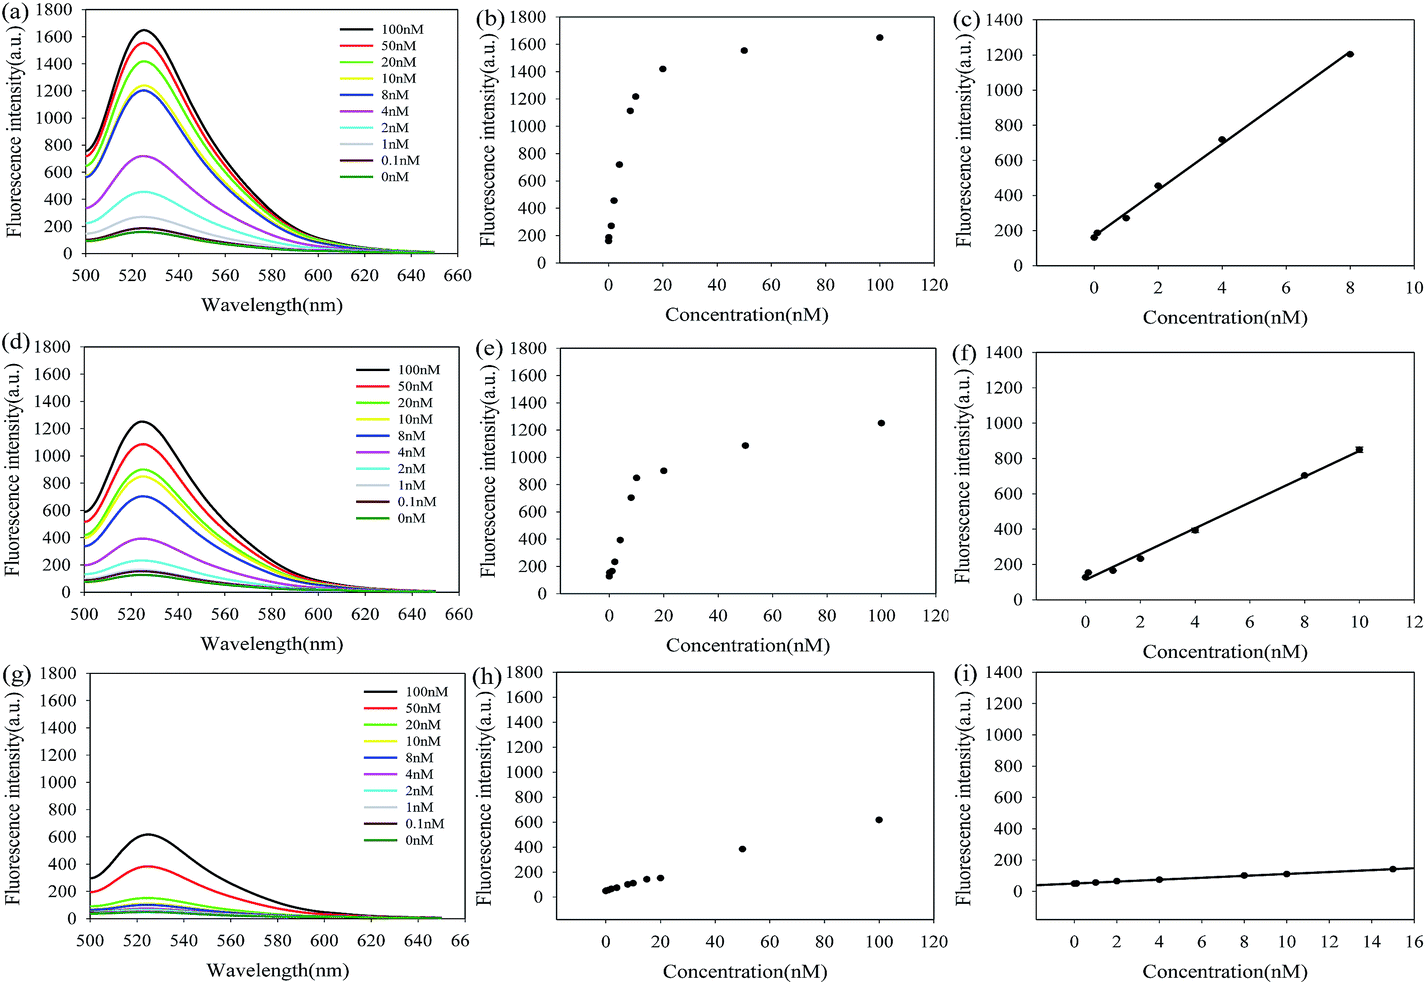 | ||
| Fig. 3 Fluorescence spectra of LCHA (a and b), CHA (d and e) and H1 (g and h) in response to miR-21 at various concentrations and their corresponding calibration curves (c, f and i) in a low concentration range. The data error bars indicate mean ± SD (n = 3). | ||
The specificity of the proposed LCHA was also investigated with other control miRNAs, including miR-200b, miR-429 and let-7d. By reacting with the LCHA, these control miRNAs all showed low fluorescence responses, close to that of the blank control (Fig. S6†). The fluorescence intensity of the LCHA in response to 20 nM miR-21 is about 7.0 times that of control miRNAs at the same concentration. The results indicated that the specificity of the LCHA was high enough to discriminate between the three control miRNAs, and demonstrate potential with regard to application in complex cellular environments.
To apply the LCHA system for imaging miRNA in live cells, the biocompatibility and cellular uptake of the DNA nanowire structure are main concerns. MTT assays were carried out to evaluate the potential cytotoxicity of the nanowire in HeLa cells. It was observed that cells could retain above 90% viability after the treatment of the nanowire at concentrations of up to 200 nM (Fig. S7†). We next investigated whether the nanowire could enter the cells. According to the literature,8–10 a HeLa cell contains a higher expression level of miR-21 and a L02 cell with a minimal level of miR-21. Therefore, we chose a HeLa cell as a positive cell and an L02 cell as a control cell. Following incubation with the LCHA with HeLa and L02 cells, the FAM fluorescence of the LCHA in response to miR-21 was monitored in live cells (Fig. S8†). For HeLa cells, the fluorescence signal gradually increased according to the incubation time and reached saturation at 3 h. For L02 cells, the fluorescence signal cannot be observed until 4 h. The result is similar to our flow cytometry analysis (Fig. S9†), as well as our previous study.34 To further study the distribution of the LCHA system inside cells, a nucleus dye was used to stain the nucleus of the cells. The results (Fig. S10†) showed that the FAM fluorescence comes from the cytoplasm, ensuring they have the chance to approach the cytoplasmic miRNAs.
To demonstrate the application of the proposed LCHA strategy for signal amplification of intracellular miR-21 imaging, HeLa cells were incubated with the LCHA, CHA and H1, respectively. The results (Fig. 4) showed that the cells with the LCHA had much brighter fluorescence than those with both the CHA and H1, which suggested the highly catalytic amplification ability of LCHA for intracellular miR-21 imaging.
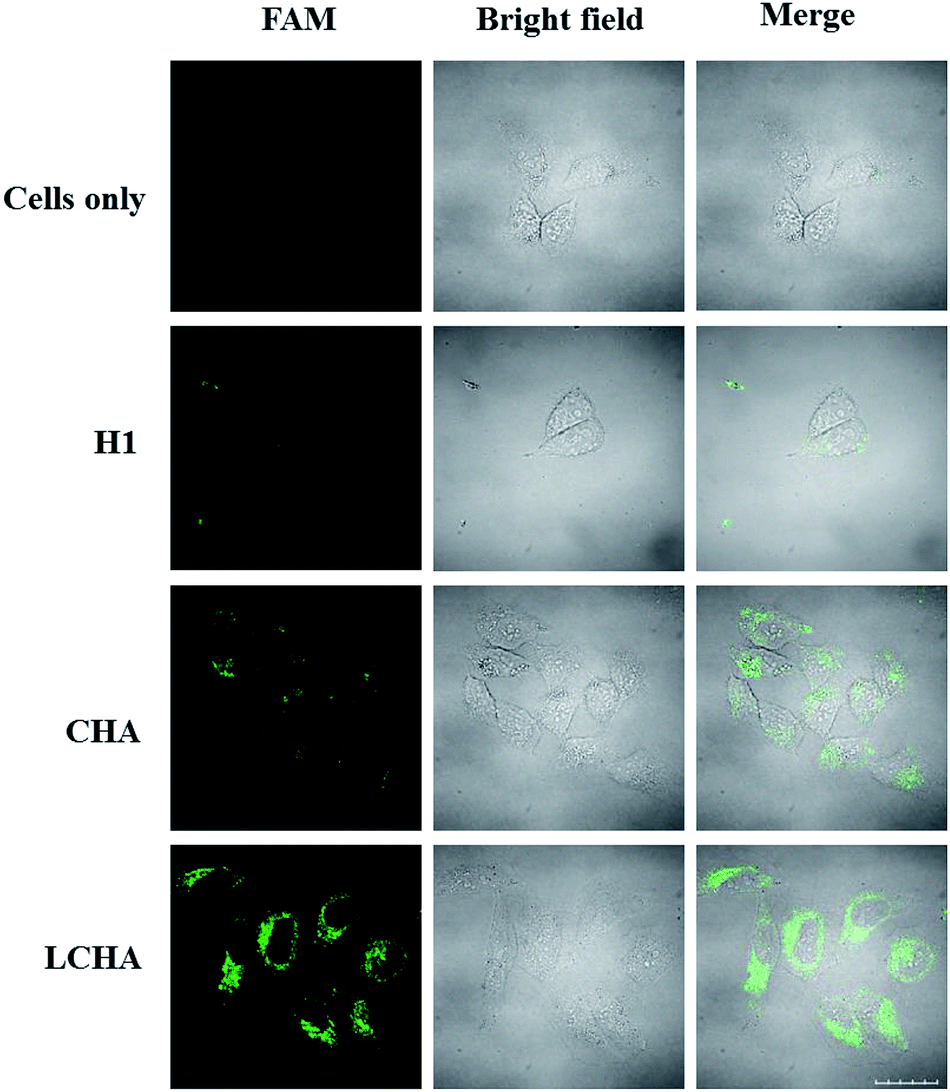 | ||
| Fig. 4 Confocal fluorescence images of HeLa cells incubated with the medium, H1, CHA, and LCHA system, respectively. Scale bar is 20 μm. | ||
The ability of the LCHA to identify the changes of miR-21 expression level in HeLa cells was then studied. Here, the HeLa cells were separated into three groups in parallel. Group one was transfected in advance with the anti-miR-21 sequence, which was used to inhibit the miR-21 expression level. Group two was transfected in advance with the miR-21 mimic sequence, which was used to increase the target sequence in cells. Group three was an untreated group and served as a control. As shown in Fig. 5, the FAM fluorescence intensity is lower in the anti-miR-21 treated cells and higher in the miR-21 mimic treated cells compared to that in untreated cells. These results indicated that the LCHA system is capable of sensing changes in miRNA expression levels in live cells.
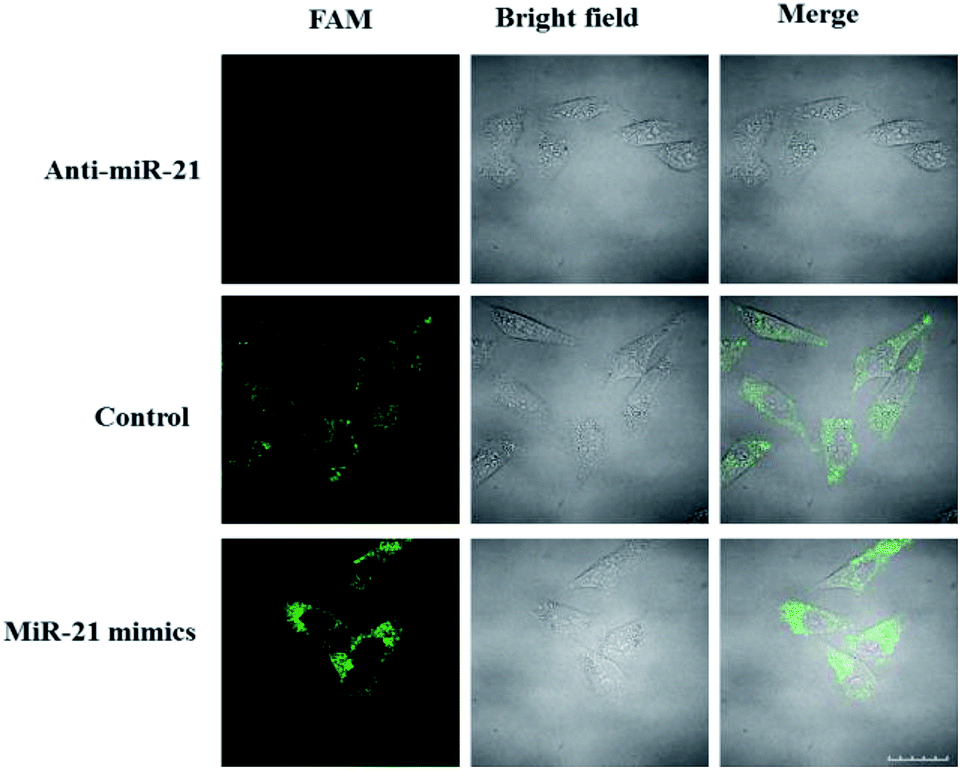 | ||
| Fig. 5 Confocal fluorescence images of HeLa cells incubated with the LCHA after being transfected with anti-miR-21 (top) and miR-21 mimics (bottom), respectively. Scale bar is 20 μm. | ||
Because miR-21 is considered as an oncogene and is upregulated in various cancer cells,8–10 besides HeLa cells, HepG2 and MCF-7 cells were also selected to test the specificity of the LCHA. As shown in Fig. 6, the strong fluorescence signals for miR-21 in HeLa, HepG2 and MCF-7 cells were observed, and almost no fluorescence signal in L02 cells was detected. These results were consistent with the results of another conventional technique qRT-PCR (Fig. S11†) and further indicated that the signals of the LCHA correlated very well with the levels of miRNA expression.
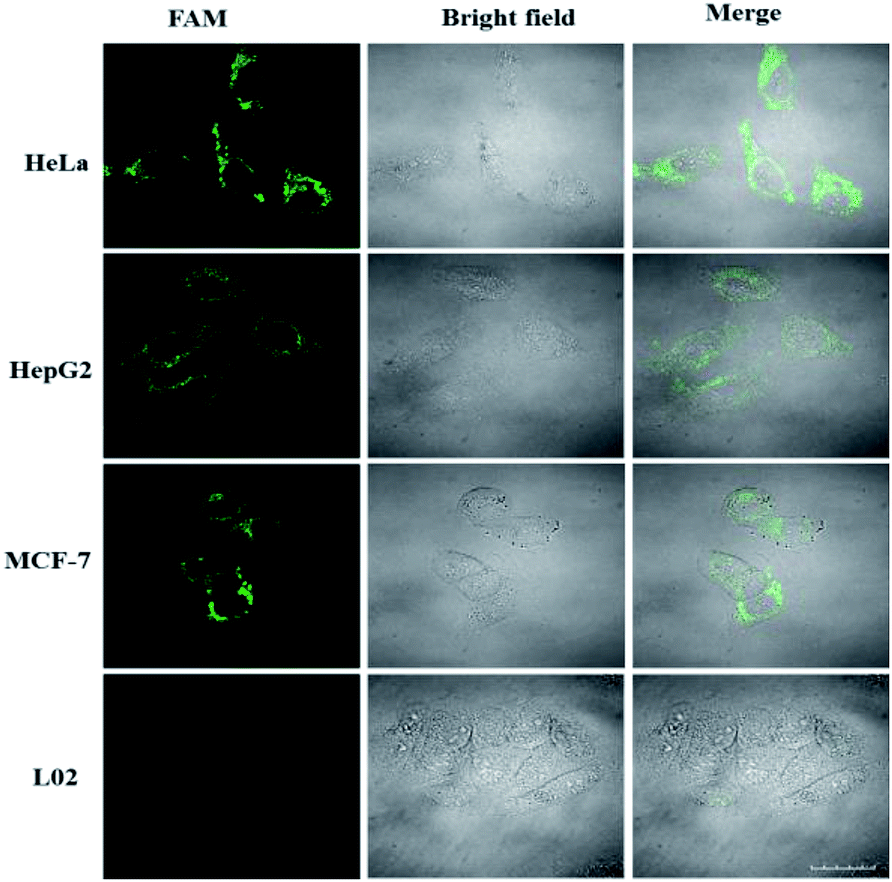 | ||
| Fig. 6 Confocal fluorescence images of four kinds of cells (HeLa, HepG2, MCF-7 and L02 cells) incubated with the LCHA system. Scale bar is 20 μm. | ||
Conclusions
In summary, we have developed the LCHA strategy for intracellular miR-21 imaging by using DNA nanowires confining both hairpin probes in a compact space. Compared to the conventional CHA strategy, the LCHA has its own advantages. First, it significantly shortens the reaction time from several hours to within one hour. Second, it enhances the sensitivity down to 2.0 pM. Third, the DNA nanowire can traverse plasma membranes into live cells without the usage of exotic transfection reagents. Fourth, the DNA nanowire structure has the ability to protect itself from nuclease degradation and enhances its stability. We anticipate that this design can be widely applied in facilitating basic biomedical research, and disease diagnosis.Experimental section
Chemicals and materials
The oligonucleotides used in this work (Table S1†) were purchased from Sangon Biotech Co., Ltd. (Shanghai, China). The oligonucleotides were purified by high-performance liquid chromatography (HPLC). All aqueous solutions were prepared using DEPC-treated ultrapure water (≥18 MΩ, Milli-Q, Millipore). SYBR Gold was obtained from Invitrogen (USA). All cell lines were obtained from the Cell Bank of the Committee on Type Culture Collection of the Chinese Academy of Sciences (Shanghai, China). Cell medium RPMI 1640 was purchased from Clontech (Mountain View, CA).Apparatus
The fluorescence spectra were measured using a Hitachi F-7000 fluorescence spectrometer (Japan). Confocal laser scanning microscopy (CLSM) studies were performed using an Olympus IX-70 inverted microscope with an Olympus FluoView 500 confocal scanning system. The flow cytometry analysis was performed using a Gallios machine (Beckman Coulter, USA).Preparation of buffers
20 mM HEPES (pH = 7.4): 20 mM HEPES, 5.4 mM KCl, 274 mM NaCl; 10 mM PBS (pH = 7.4): 137 mM NaCl, 2.7 mM KCl, 10 mM NaH2PO4·2H2O; 20 mM Tris–HCl (pH = 7.4): 20 mM Tris-base, 137 mM NaCl; SPSC (pH 7.5): 1 M NaCl, 50 mM Na2HPO4.Preparation of the DNA nanoprobe
The DNA nanoprobe consists of four single-stranded oligonucleotide strands (L1, L2, H1, and H2). After L1 and L2 were annealed in Tris–HCl buffer at 95 °C for 5 min and cooled to room temperature over 4 h, the DNA nanoprobe was prepared by mixing a mixture of L1 and L2, 10 μL of 1 μM H1, and 10 μL of 1 μM H2 for 3 h at 37 °C.Gel electrophoresis experiments
Successful formation of DNA nanowires and the CHA was verified by 2% agarose gel electrophoresis. 10 μL reaction sample, 2 μL 6× loading buffer, and 2 μL of SYBR Gold were subjected to the 2% agarose gel electrophoresis. The gel was run in 1× TBE buffer at a constant voltage of 80 V for 1 h.Stability assay of the DNA nanoprobe
The solutions of 1 μM DNA nanoprobe and H1 were spiked with HeLa cell lysate, respectively, to a final concentration of 100 nM in cell lysate. Both solutions were incubated at 37 °C for 8 h, and the FAM fluorescence signals were measured every hour at 525 nm with 488 nm excitation. HeLa cell lysate was obtained as follows: first, the HeLa cells were cultured for 24 h in a humidified incubator, and then the cells were broken using an ultrasonic cell crusher in about 5 min, and the lysate was used as is without centrifugation. The cell lysate was then immediately used for the stability assay of the DNA nanoprobe.In vitro fluorescence experiments
Different concentrations of the target miR-21 were added to the DNA nanoprobe solutions, respectively. After reaction at 37 °C for 1 h, the fluorescence of FAM was collected between 500 and 650 nm by use of excitation at 488 nm. The slit width was set to be 5 nm for the excitation and 5 nm for the emission. For comparison of the amplification effects, the traditional CHA was performed by mixing H1 and H2 with miR-21 under the same conditions. In the kinetic study, miR-21 of 20 nM was employed. It was performed at 37 °C with a 488 nm excitation wavelength. For the selectivity test, certain concentrations of miR-21, miR-429, miR-200b, and let-7d stock solutions were added to the solutions with a final concentration of 20 nM. The measuring processing was the same as above.Cell culture
HeLa cells, HepG2 cells, MCF-7 cells, and L02 cells were grown in RPMI-1640 medium supplemented with 10% fetal bovine serum, 100 U mL−1 of 1% penicillin and streptomycin solution, and cultured at 37 °C in a humidified incubator containing 5% CO2 and 95% air.Confocal fluorescence imaging
All HeLa cells were seeded into a confocal dish for 24 h at 37 °C and then incubated with 200 μL culture medium containing 100 nM probe for 3 h at 37 °C. After washing twice with PBS, the fluorescence of cells was visualized from 505 to 525 nm with the excitation wavelength of 488 nm for FAM. And the fluorescence of cells was visualized from 450 to 470 nm with the excitation wavelength of 405 nm for Hoechst dye. All cells were observed under an Olympus IX-70 inverted microscope with an Olympus FluoView 500 confocal scanning system. The fluorescence images were presented after processing using Image Pro plus 6.0 software and ImageJ version 1.38× software. To detect the dynamic changes of miR-21 in cells, two groups of HeLa cells were pretreated with anti-miR 21 (300 nM) and miR-21 mimics (300 nM) for 1 h, respectively. One group of cells without treatment served as the control. Other steps were performed in the same way as described above.Flow cytometry assay
HeLa cells and L02 cells were cultured with the probe (100 nM) in culture media for 3 h. Then the cells were washed with PBS (pH = 7.4) three times and detached from the culture plate by trypsin–EDTA solution. Next, the suspended cell solution was centrifuged at 2000 rpm for 5 min and washed with PBS three times. Finally, the cells were resuspended in PBS for flow cytometric analysis on a Beckman Coulter Gallios machine at 488 nm excitation.Cytotoxicity assay
HeLa cells were seeded in 96-well plates at a density of 1 × 10⁶ cells per well and a total volume of 200 μL per well. After overnight incubation, the medium was removed, and the HeLa cells were washed twice with PBS and incubated with serial concentrations of the probe for 3 h. Cells incubated with only the medium served as the control. Then, 20 μL of MTT solution (5 mg mL−1 in PBS) and 180 μL of serum-free medium were added to each well with incubation at 37 °C for 4 h. Finally, 150 μL of DMSO was added to dissolve the precipitated violet formazan crystals. The cell viability was determined by measuring the absorbance at 490 nm using a multidetection microplate reader.qRT-PCR
Total cellular RNAs were extracted from HeLa cells, HepG2 cells, MCF-7 cells, and L02 cells respectively, using Trizol reagent (Sangon Co. Ltd., Shanghai, China) according to the manufacturer's instructions. The cDNA samples were prepared by using the reverse transcription (RT) reaction with an AMV First Strand cDNA Synthesis Kit (BBI, Toronto, Canada). qPCR analysis of miRNA was performed with SG Fast qPCR Master Mix (2× BBI), according to the indicated protocol on an LightCycler480 Software Setup (Roche). The relative expression of miR-21 was calculated using the 2−ΔΔCt method.Conflicts of interest
There are no conflicts to declare.Acknowledgements
This work was supported by the Key Project of the National Natural Science Foundation of China (21735002), the Foundation for Innovative Research Groups of NSFC (21521063), the National Natural Science Foundation of Hunan Province (2017JJ2039), and the Fundamental Research Funds for the Central Universities.Notes and references
- V. Ambros, Nature, 2004, 431, 350 CrossRef PubMed.
- D. Bartel, Cell, 2004, 116, 281 CrossRef PubMed.
- D. Bartel, Cell, 2009, 136, 215 CrossRef PubMed.
- J. Rossi, Cell, 2009, 137, 990 CrossRef PubMed.
- J. V. Tricoli and J. W. Jacobson, Cancer Res., 2007, 67, 4553 CrossRef PubMed.
- K. Ruan, X. Fang and G. Ouyang, Cancer Lett., 2009, 285, 116 CrossRef PubMed.
- B. M. Ryan, A. I. Robles and C. C. Harris, Nat. Rev. Cancer, 2010, 10, 389 CrossRef PubMed.
- K. Gumireddy, D. Young, X. Xiong, J. Hogenesch, Q. Huang and A. Deiters, Angew. Chem., Int. Ed., 2008, 47, 7482 CrossRef PubMed.
- S. Ali, A. Ahmad, S. Banerjee, S. Padhye, K. Dominiak, J. Schaffert, Z. Wang, P. Philip and F. Sarkar, Cancer Res., 2010, 70, 3606 CrossRef PubMed.
- S. Ali, K. Almhanna, W. Chen, P. Philip and F. Sarkar, Am. J. Transl. Res., 2010, 3, 28 Search PubMed.
- C. Pritchard, H. Cheng and M. Tewari, Nat. Rev. Genet., 2012, 13, 358 CrossRef PubMed.
- C. P. Liang, P. Q. Ma, H. Liu, X. G. Guo, B. C. Yin and B. C. Ye, Angew. Chem., Int. Ed., 2017, 56, 9077 CrossRef PubMed.
- P. Q. Ma, C. P. Liang, H. H. Zhang, B. C. Yin and B. C. Ye, Chem. Sci., 2018, 9, 3299 RSC.
- Z. Cheglakov, T. M. Cronin, C. He and Y. Weizmann, J. Am. Chem. Soc., 2015, 137, 6116 CrossRef PubMed.
- Y. Yang, J. Huang, X. Yang, X. He, K. Quan, N. Xie, M. Ou and K. Wang, Anal. Chem., 2017, 89, 5850 CrossRef PubMed.
- Y. Wu, J. Huang, X. Yang, Y. Yang, K. Quan, N. Xie, J. Li, C. Ma and K. Wang, Anal. Chem., 2017, 89, 8377 CrossRef PubMed.
- A. J. Turberfield, J. C. Mitchell, B. Yurke, A. P. Mills, M. I. Blakey and F. C. Simmel, Phys. Rev. Lett., 2003, 90, 118102 CrossRef PubMed.
- P. Yin, H. M. T. Choi, C. R. Calvert and N. A. Pierce, Nature, 2008, 451, 318 CrossRef PubMed.
- Z. Qing, X. He, J. Huang, K. Wang, Z. Zou, T. Qing, Z. Mao, H. Shi and D. He, Anal. Chem., 2014, 86, 4934 CrossRef PubMed.
- K. Quan, J. Huang, X. Yang, Y. Yang, L. Ying, H. Wang, Y. He and K. Wang, Chem. Commun., 2015, 51, 937 RSC.
- B. Li, A. Ellington and X. Chen, Nucleic Acids Res., 2011, 39, e110 CrossRef PubMed.
- B. Li, Y. Jiang, X. Chen and A. Ellington, J. Am. Chem. Soc., 2012, 134, 13918 CrossRef PubMed.
- A. Zheng, J. Li, J. Wang, X. Song, G. Chen and H. Yang, Chem. Commun., 2012, 48, 3112 RSC.
- F. Wang, C. Lu and I. Willner, Chem. Rev., 2014, 114, 2881 CrossRef PubMed.
- C. Jung and A. Ellington, Acc. Chem. Res., 2014, 47, 1825 CrossRef PubMed.
- C. Wu, S. Cansiz, L. Zhang, I. Teng, L. Qiu, J. Li, Y. Liu, C. Zhou, R. Hu, T. Zhang, C. Cui, L. Cui and W. Tan, J. Am. Chem. Soc., 2015, 137, 4900 CrossRef PubMed.
- C. Agapakis, P. Boyle and P. Silver, Nat. Chem. Biol., 2012, 8, 527 CrossRef PubMed.
- Z. Zhao, J. Fu, S. Dhakal, A. Buck, M. Liu, T. Zhang, N. Woodbury, Y. Liu, N. Walter and H. Yan, Nat. Commun., 2016, 7, 10619 CrossRef PubMed.
- G. Ke, M. Liu, S. Jiang, X. Qi, Y. Yang, S. Wootten, F. Zhang, Z. Zhu, Y. Liu, C. Yang and H. Yan, Angew. Chem., Int. Ed., 2016, 55, 7483 CrossRef PubMed.
- O. Wilner, Y. Weizmann, R. Gill, O. Lioubashevski, R. Freeman and I. Willner, Nat. Nanotechnol., 2009, 4, 249 CrossRef PubMed.
- G. Chatterjee, N. Dalchau, R. Muscat, A. Phillips and G. Seelig, Nat. Nanotechnol., 2017, 12, 920 CrossRef PubMed.
- H. Bui, V. Miao, S. Garg, R. Mokhtar, T. Song and J. Reif, Small, 2017, 13, 1602983 CrossRef PubMed.
- K. Ren, Y. Xu, Y. Liu, M. Yang and H. Ju, ACS Nano, 2018, 16, 263 CrossRef PubMed.
- W. Li, X. Yang, L. He, K. Wang, Q. Wang, J. Huang, J. Liu, B. Wu and C. Xu, ACS Appl. Mater. Interfaces, 2016, 8, 25733 CrossRef PubMed.
- W. Li, L. Luo, J. Huang, Q. Wang, J. Liu, X. Xiao, H. Fang, X. Yang and K. Wang, Chem. Commun., 2017, 53, 5565 RSC.
- N. Xie, J. Huang, X. Yang, Y. Yang, K. Quan, H. Wang, L. Ying, M. Ou and K. Wang, Chem. Commun., 2016, 52, 2346 RSC.
- N. Xie, J. Huang, X. Yang, Y. Yang, K. Quan, M. Ou, H. Fang and K. Wang, ACS Sensors, 2016, 1, 1445 CrossRef.
- N. Xie, J. Huang, X. Yang, X. He, J. Liu, J. Huang, H. Fang and K. Wang, Anal. Chem., 2017, 89, 12115 CrossRef PubMed.
Footnote |
| † Electronic supplementary information (ESI) available. See DOI: 10.1039/c8sc02943a |
| This journal is © The Royal Society of Chemistry 2018 |