
 Open Access Article
 This Open Access Article is licensed under a Creative Commons Attribution-Non Commercial 3.0 Unported Licence
Construction of 3D architectures with Ni(HCO3)2 nanocubes wrapped by reduced graphene oxide for LIBs: ultrahigh capacity, ultrafast rate capability and ultralong cycle stability†
Yutao
Dong
,
Yuhang
Ma
,
Dan
Li
,
Yushan
Liu
,
Weihua
Chen
 *,
Xiangming
Feng
and
Jianmin
Zhang
*
*,
Xiangming
Feng
and
Jianmin
Zhang
*
College of Chemistry and Molecular Engineering, Zhengzhou University, Zhengzhou 450001, Henan, China. E-mail: zhjm@zzu.edu.cn; chenweih@zzu.edu.cn
First published on 13th September 2018
Abstract
Rechargeable lithium-ion batteries (LIBs) have been the dominating technology for electric vehicles (EV) and grid storage in the current era, but they are still extensively demanded to further improve energy density, power density, and cycle life. Herein, a novel 3D layered nanoarchitecture network of Ni(HCO3)2/rGO composites with highly uniform Ni(HCO3)2 nanocubes (average diameter of 100 ± 20 nm) wrapped in rGO films is facilely fabricated by a one-step hydrothermal self-assembly process based on the electrostatic interaction and coordination principle. Benefiting from the synergistic effects, the Ni(HCO3)2/rGO electrode delivers an ultrahigh capacity (2450 mA h g−1 at 0.1 A g−1), ultrafast rate capability and ultralong cycling stability (1535 mA h g−1 for the 1000th cycle at 5 A g−1, 803 mA h g−1 for the 2000th cycle at 10 A g−1). The detailed electrochemical reaction mechanism investigated by in situ XRD further indicates that the 3D architecture of Ni(HCO3)2/rGO not only provides a good conductivity network and has a confinement effect on the rGO films, but also benefits from the reversible transfer from LiHCO3 to LixC2 (x = 0–2), further oxidation of nickel, and the formation of a stable/durable solid electrolyte interface (SEI) film (LiF and LiOH), which are responsible for the excellent storage performance of the Li-ions. This work could shed light on the design of high-capacity and low-cost anode materials for high energy storage in LIBs to meet the critical demands of EV and mobile information technology devices.
Introduction
With growth accelerating in portable electronics, power tools, electric vehicles (EV) and grid storage in the past decade, rechargeable lithium-ion batteries (LIBs) have been studied intensively, and the energy density of the best commercial batteries has been doubled.1,2 However, there are still rapidly growing demands for LIBs with high capacity, high power, and high cycle stability.3–7 As the current commercial anode for LIBs, graphite is maintaining its position, but it is unable to meet the rapidly growing energy demand due to its high energy density and high power density (mainly specific capacity and operating voltage) advanced materials is of great importance for the real application of LIBs.8,9 Among many high specific capacity alternatives to graphite, silicon (theoretical capacity: 3578 mA h g−1/Li15Si4) and tin (theoretical capacity: 993 mA h g−1/Li4.4Sn) have been pursued as anode materials that undergo alloying reactions with lithium.6,10–15 However, during the lithiation and delithiation process these alloying materials (Si, and Sn or its composite) suffer from limited electrical conductivity, high volume expansion, slow Li-ion transport, dissolution and other unfavorable interactions with the electrolyte, and mechanical brittleness, leading to capacity loss.16–18 Another critical problem is that the volume change can destroy the SEI protective film resulting in continuous electrolyte decomposition, reducing the availability of Li and increasing the cell impedance.19–21 To date, great efforts have been made to develop high performance electrode materials for LIBs, such as various nanostructures (hollow nanospheres, nanotubes, nanoparticles, and nanofilms)22–28 or composition materials (with carbon, carbon nanotubes, and graphene),29–37 which have shown extraordinary promise for Li-ion storage, but these still needs to be improved before further application. Even though making leaps in battery technology is surprisingly hard to do, the research and development of novel materials will continue to overcome these challenges and push the boundaries of cost, energy density, power density, cycle life, and safety.17,38–42Recently, transition-metal carbonates (MCO3: M = Fe, Mn, and Co) with high theoretical capacities based on the conversion mechanism were reported,43 in which the reduction of Li2CO3 could be catalyzed by in situ generated transition metal M nanocrystals to lower valence carbide materials (i.e., LixC2, x = 0–2).44–48 Among them, the Ni(HCO3)2 in its highest lithiated state can deliver up to 4.8 times more capacity (1781.8 mA h g−1) than graphite (372 mA h g−1).45,46,49,50 Unfortunately, similar to the transition-metal carbonate materials, ordinary Ni(HCO3)2 has fatal defects, which usually present poor cycling stability and low rate capability due to inherently poor electronic conductivity, slow reaction kinetics, and a lack of structural stability during the charge/discharge process.46,51–53 In essence, enhancing the structural stability and electron/ion conductivity are two key challenges in the development of high performance electrode materials for LIBs. Various methods, such as self-assembly, wet-chemical synthesis, and hydrothermal and template-assisted synthesis, have been employed to prepare nanostructured Ni(HCO3)2 materials.50,54,55 However, such nanoscale materials cannot exhibit satisfactory electrochemical or electrocatalytic properties due to the agglomeration of nanoparticles and inefficient electrolyte–electrode contact (Scheme S1a, ESI†). Therefore, the comprehensive design of three dimensional (3D) assembled nano-architectures has shown a strategic advantage for highly stable and ultrafast energy storage.56 Generally, as graphene possesses a large surface area, high intrinsic electrical conductivity and excellent mechanical flexibility, it is normally incorporated to construct continuous 3D networks, which could improve the structural integrity to enhance the electron transfer, accelerate reaction kinetics, and assuage volume expansion.52,57,58 It is highly desirable and quite challenging to develop a green and facile synthetic route for fabrication of the 3D architecture of a nickel bicarbonate and graphene composite material with a highly organized nanostructure and morphology.
Herein, a novel 3D layered nano-architecture network with Ni(HCO3)2 nanocubes wrapped in reduced graphene oxide (denoted as Ni(HCO3)2/rGO) is first synthesized via a one-step hydrothermal synthesis and self-assembly based on the electrostatic interaction and coordination principle.59–61 The 3D Ni(HCO3)2/rGO composite is demonstrated to deliver a high capacity retention and long cycling stability due to the robust structure, ideal SEI film (LiF, LiOH) and rapid electron/ion transport (Scheme S1b†). Benefiting from the synergistic effects between the Ni(HCO3)2 nanocubes and rGO networks, the as-prepared Ni(HCO3)2/rGO exhibits an ultrahigh specific capacity (2450 mA h g−1 for the 100th cycles at 0.1 A g−1), ultralong cycling stability (greater than 1535 mA h g−1 after 1000th cycles at 5 A g−1), and ultrahigh rate capability (more than 803 mA h g−1 for the 2000th cycle at 10 A g−1). Moreover, the electrochemical mechanism of the Ni(HCO3)2/rGO is studied closely using in situ XRD and ex situ XPS measurements.
Results and discussion
The detailed fabrication process of the Ni(HCO3)2/rGO was achieved via a one-step hydrothermal and self-assembly process based on the electrostatic interaction and coordination principle as shown in Scheme 1.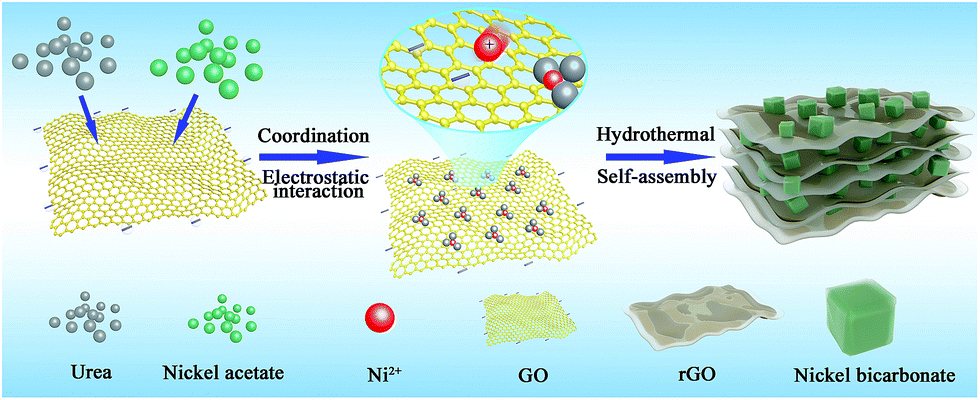 | ||
| Scheme 1 Schematic illustration of the Ni(HCO3)2/rGO composite. | ||
The scanning electron microscopy (SEM) images (Fig. 1a, S1a and b†) show that the highly porous 3D Ni(HCO3)2/rGO aerogel has a hierarchical structure with multi-scale pores and spans hundreds of micrometers. Interestingly, it has different structural characteristics from different perspectives. When it is viewed from the edge (Fig. 1b and S1c†), a cross sectional image with a large number of Ni(HCO3)2 nanocubes sandwiched by rGO films is observed. When viewed from the plane part (Fig. 1d), it can be observed that the nanocubes are uniformly distributed in the 3D porous rGO networks. Moreover, the high-magnification SEM images (Fig. 1c and e) exhibit that the Ni(HCO3)2 nanocubes with an average diameter of 100 ± 20 nm are well encapsulated within the wrinkled rGO films. The intimate connection microstructure of Ni(HCO3)2 and rGO can be further confirmed by the transmission electron microscopy (TEM) images (Fig. 1f, S1d and e†). Of particular note, as shown in the magnified TEM image (Fig. 1g), the nanocube of Ni(HCO3)2 has a clear cubic structure and few defects. The high-resolution transmission electron microscopy (HRTEM) images (Fig. 1h and S1f†) demonstrate that the Ni(HCO3)2 nanocubes anchored on the rGO films are well crystallized. The interplanar spacings between them are measured to be ∼0.56 and 0.34 nm, which are well matched with the d-spacings of the (110) and (211) planes of cubic Ni(HCO3)2, respectively. These results can also be confirmed by the X-ray diffraction XRD results. As shown in Fig. 1i, the XRD pattern presents the pure crystallographic feature of the cubic Ni(HCO3)2 crystals (JCPDS card no. 15-0782). There is no carbon peak in the XRD pattern of the Ni(HCO3)2/rGO hybrid, indicating a lower amount of rGO in the composite. This phenomenon is consistent with the previous related reports.59 Furthermore, as shown in Fig. 1(j), (k), S1(g) and (h),† the over-lapped elemental mapping images reveal the uniform presence of carbon, oxygen, and nickel elements in the 3D porous Ni(HCO3)2/rGO. Moreover, the quantitative elemental analysis based on the energy dispersed spectrum (EDS) proves the existence of the C, O, and Ni elements in Ni(HCO3)2/rGO (Fig. 1l and S1i†). As it has uninterrupted conductive networks with mutually connected configuration nanosized subunits wrapped by extended and flexible rGO films, the highly uniformed Ni(HCO3)2/rGO architecture increases the electrode/electrolyte contact area. It is expected that this novel structure could provide more active sites and effective ion transport paths, and would result in more compact Li-ion storage with a high performance.
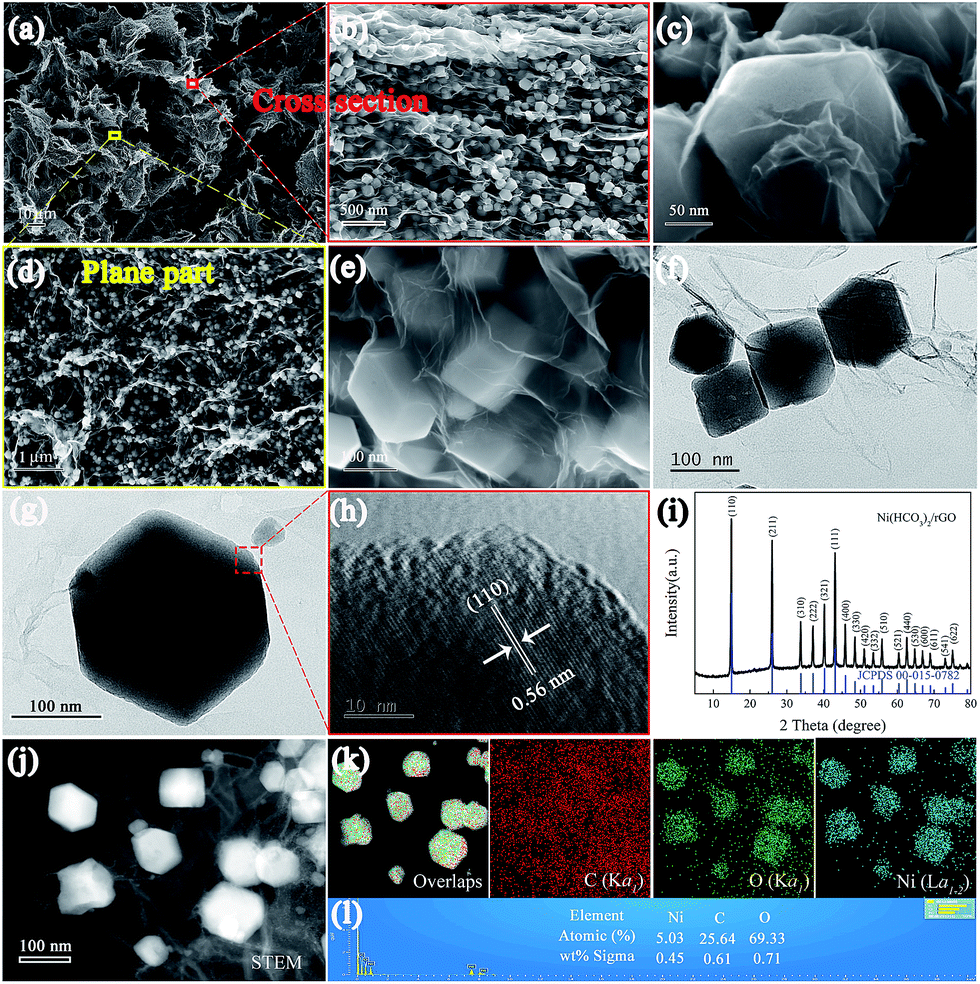 | ||
| Fig. 1 Microstructure and morphology of the synthesized Ni(HCO3)2/rGO. SEM images: (a) aerogel of the Ni(HCO3)2/rGO, (b and c) cross section, showing that most of the Ni(HCO3)2 nanocubes are embedded in the 3D layered rGO network, and (d and e) plane part, showing that most of the Ni(HCO3)2 nanocubes are wrapped by rGO films; (f and g) TEM, and (h) HRTEM images; (i) XRD pattern; (j) TEM image of the selected area, (k) elemental mapping images, and (l) EDS spectrum, showing the uniform presence of C, O, and Ni. | ||
The surface area and pore structure of Ni(HCO3)2/rGO were evaluated by nitrogen adsorption–desorption measurements at 77 K. The isotherm curves (Fig. 2a) exhibit type IV hysteresis loops, showing the presence of mesopores in the Ni(HCO3)2/rGO with the total pore volume being 0.28 cm3 g−1. From the desorption branch of the isotherm curves (Fig. 2b), the two types of the Barrett–Joyner–Halenda (BJH) desorption pores are shown. One is on the material surface (∼4.4 nm), the other one is the stacking pores of the Ni(HCO3)2 nanocubes in rGO (5–50 nm). The specific surface area is calculated to be 45.78 m2 g−1 according to the experimental measurements. This seems to be relatively small, and the reason could be that the Ni(HCO3)2 nanocubes are almost completely wrapped by rGO films, so that N2 cannot be effectively adsorbed and desorbed on the nanocubes Ni(HCO3)2 surface during the Brunauer–Emmett–Teller (BET) test. Furthermore, the smaller BET value could mainly be contributed to by the rGO surface, and the graphene ratio in Ni(HCO3)2/rGO was calculated to be 19.98 wt% according to the thermogravimetric analysis (TGA) results (Fig. S2†).
 | ||
| Fig. 2 (a) N2 adsorption–desorption isotherms and (b) corresponding pore size distribution curve of Ni(HCO3)2/rGO; (c) FTIR spectroscopies and (d) Raman spectra of the GO, rGO, and Ni(HCO3)2/rGO. | ||
The Fourier transform infrared (FT-IR) spectra of GO, rGO, and Ni(HCO3)2/rGO are shown in Fig. 2c. The bands at 3410, 1735, 1400, 1224, and 1049 cm−1 correspond to the O–H, C![[double bond, length as m-dash]](https://www.rsc.org/images/entities/char_e001.gif) O, C–OH, C–O, and C–O–C of the oxygen-containing functional groups on GO, respectively.62 For the rGO, the disappearance of the C–OH and C–O–C stretching vibrations indicate that the GO has been reduced by the hydrothermal treatment. The bands at 1558, and 1442 cm−1 correspond to the –COO− symmetric and anti-symmetric stretching vibrations, respectively.59 For bicarbonate, the peak at 827 cm−1 could correspond to the C–H stretching vibration. The peaks that emerge at 613 and 493 cm−1 for Ni(HCO3)2/rGO could be ascribed to the symmetric and anti-symmetric Ni–O stretching, respectively. The Raman spectra (Fig. 2d) displays the peaks at 1337 and 1592 cm−1 which are attributed to the G and D bands of graphene, respectively. The G band corresponds to the sp2 hybridized carbon, and the D band provides evidence of the defects presence on the rGO films (such as band-length disorder, band-angle disorder, vacancies and edge defects, etc.).63 The intensity ratio of the D band to the G band (ID/IG) of Ni(HCO3)2/rGO is 1.08, which is larger than those obtained for GO (ID/IG = 0.94) and rGO (ID/IG = 1.05), indicating that the disordered nature of Ni(HCO3)2/rGO increases due to the hydrothermal reduction treatment and introduction of Ni(HCO3)2. The characteristic band at 484.5 cm−1 could be from the longitudinal optical phonon mode of Ni(HCO3)2.
O, C–OH, C–O, and C–O–C of the oxygen-containing functional groups on GO, respectively.62 For the rGO, the disappearance of the C–OH and C–O–C stretching vibrations indicate that the GO has been reduced by the hydrothermal treatment. The bands at 1558, and 1442 cm−1 correspond to the –COO− symmetric and anti-symmetric stretching vibrations, respectively.59 For bicarbonate, the peak at 827 cm−1 could correspond to the C–H stretching vibration. The peaks that emerge at 613 and 493 cm−1 for Ni(HCO3)2/rGO could be ascribed to the symmetric and anti-symmetric Ni–O stretching, respectively. The Raman spectra (Fig. 2d) displays the peaks at 1337 and 1592 cm−1 which are attributed to the G and D bands of graphene, respectively. The G band corresponds to the sp2 hybridized carbon, and the D band provides evidence of the defects presence on the rGO films (such as band-length disorder, band-angle disorder, vacancies and edge defects, etc.).63 The intensity ratio of the D band to the G band (ID/IG) of Ni(HCO3)2/rGO is 1.08, which is larger than those obtained for GO (ID/IG = 0.94) and rGO (ID/IG = 1.05), indicating that the disordered nature of Ni(HCO3)2/rGO increases due to the hydrothermal reduction treatment and introduction of Ni(HCO3)2. The characteristic band at 484.5 cm−1 could be from the longitudinal optical phonon mode of Ni(HCO3)2.
The electrochemical performance of the 3D Ni(HCO3)2/rGO composite was evaluated in a half-cell configuration using cyclic voltammetry (CV) measurements firstly. Under lithiation and delithiation processes, the cathodic and anodic reactions are an effective way to depict the mechanisms clearly. The CV curves (Fig. 3a) show that, in the first scanning cycle, the Ni(HCO3)2/rGO electrode develops a broad cathodic reduction peak centered at 1.12 V, which can be attributed to the reduction of Ni2+ to metallic Ni following eqn (1). Interestingly, the transfer from LiHCO3 to LixC2 (x = 0, 1, 2) could contribute to the subsequent cathodic reduction peak located between 1 and 0.8 V, which is probably catalyzed by the Ni-nanocrystals generated in situ and has been proved to account for the ultrahigh capacity of Ni(HCO3)2, following eqn (2).50 The sharp cathodic peak and anodic peak at about 0.02 and 0.6 V, which are due to reversible insertion and extraction of lithium from graphene, respectively. The anodic peak at about 1.4 V is ascribed to the reversible transfer from LixC2 (x = 0–2) to LiHCO3 which could also be catalyzed by in situ generated Ni-nanocrystals according to eqn (2). In addition, in the first cycle, the other two anodic peaks are observed at about 2.09 and 2.58 V, which can be ascribed to the oxidation of Ni0 to Ni2+ and Ni2+ to Ni3+ according to eqn (3) and (4), respectively. Interestingly, the two anodic peaks shift to about 2.2 and 2.6 V in the subsequent cycles, which originate from the electrode polarization. After the first cycle, the Ni(HCO3)2/rGO electrode displays two more cathodic peaks at about 1.59–1.69 V and 0.8–0.9 V, which are ascribed to the reduction of Ni3+/Ni2+ to Ni0 and HCO3− to LixC2 (x = 0–2) according to eqn (2)–(4), respectively. In addition, the chemical states of Ni3+/Ni2+, and Ni0 can be clearly observed by ex situ X-ray photoelectron spectroscopy (XPS) studies on the cycled electrodes.
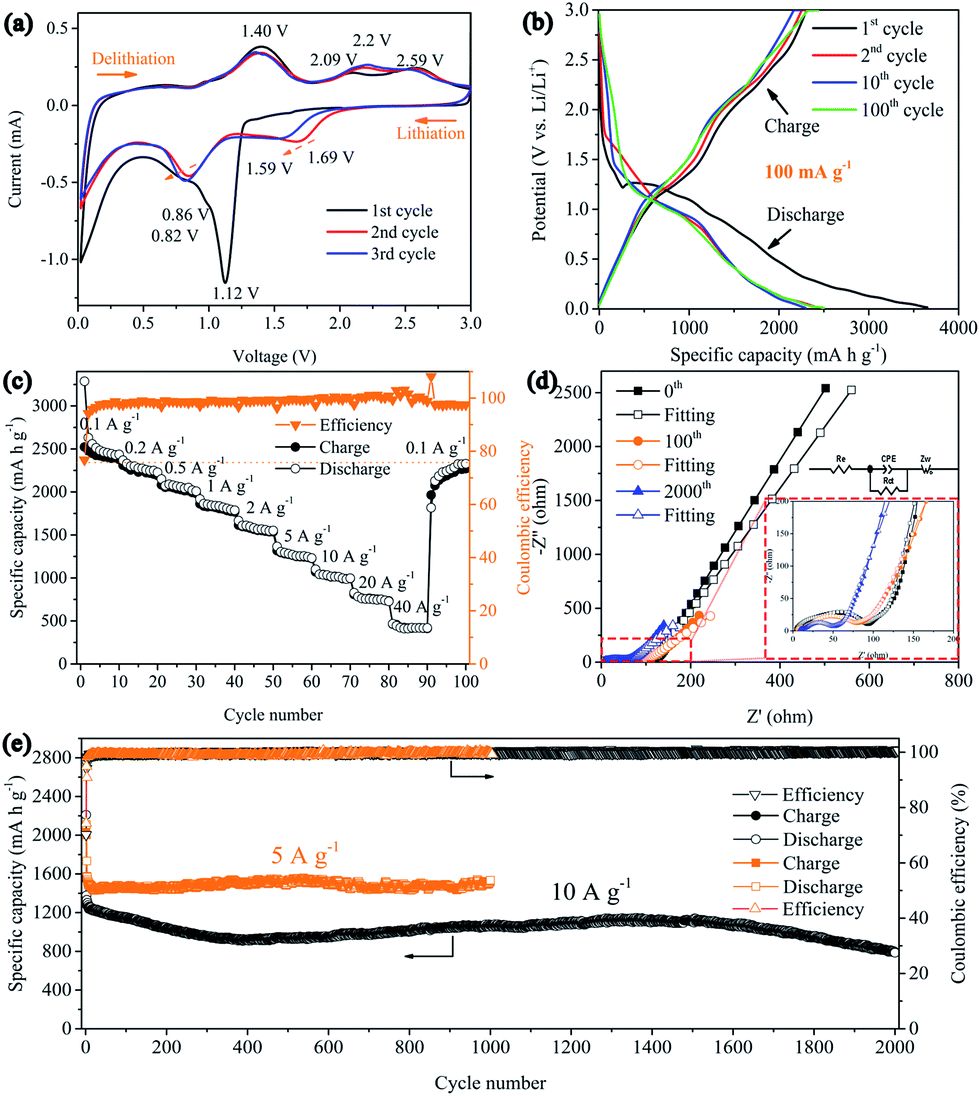 | ||
| Fig. 3 Electrochemical performance of the 3D Ni(HCO3)2/rGO. (a) Cyclic voltammograms recorded at a scan rate of 0.1 mV s−1; (b) galvanostatic discharge/charge profiles of the 1st, 2nd, 10th, and 100th cycle at a current density of 0.1 A g−1; (c) rate capability at various current densities (from 0.1 A g−1 to 40 A g−1); (d) Nyquist curves of electrochemical impedance spectra before cycling, after the 100th cycle and after the 2000th cycle at a current density of 10 A g−1; (e) long-term cycling performances at a current density of 5 A g−1 and 10 A g−1. | ||
The lithiation and delithiation processes can be expressed as follows:
First lithiation reaction,
| Ni(HCO3)2 + 2Li+ + 2e− → 2LiHCO3 + Ni | (1) |
Subsequent lithiation–delithiation reactions,
 | (2) |
| Ni + Li2O ↔ NiO + 2Li+ + 2e− | (3) |
| NiO + 0.5Li2O ↔ 0.5Ni2O3 + Li+ + e− | (4) |
The galvanostatic charge–discharge (GCD) curves of the 3D Ni(HCO3)2/rGO show high specific capacities of 3620 and 2645 mA h g−1 in the first discharge and charge process, respectively, with a 73.1% coulombic efficiency. The discharge curves of Ni(HCO3)2/rGO almost overlap and deliver a capacity of 2450 mA h g−1 for 100 cycles at 0.1 A g−1. In particular, from the second to the 100th cycle, the charge profiles, showing three stable plateaus at 1.25, 2.15, and 2.55 V, seem to be consistent with the oxidation peaks in CV. Such a highly reversible phenomenon has not been reported previously, and shows the synergistic interactions between rGO and Ni(HCO3)2. Clearly, in the first cycle, the potential ultrahigh theoretical specific capacity (1781.8 mA h g−1) of Ni(HCO3)2 is based on eqn (1) and (2) (n = 12 at x = 2, here n and x are the transfer number of electrons and the mole number of inserted Li ions, respectively). Interestingly, after the first cycle, the excellent reversibility benefits from the unique 3D layered nanostructure, and the new potential ultrahigh reversible theoretical specific capacity of the electrode material is estimated to be 1930 mA h g−1 based on eqn (2)–(4) (n = 13 at x = 2).
It is very important for high-power applications that active materials deliver more capacity at high rates. As shown in Fig. 3c, it is clear that 3D Ni(HCO3)2/rGO exhibits an excellent rate capability at various current densities. The average capacities are 2450, 2250, 2050, 1830, 1580, 1280, 1020, 760, and 420 mA h g−1 at the current rates of 0.1, 0.2, 0.5, 1, 2, 5, 10, 20, and 40 A g−1, respectively. Furthermore, when the current density is returned to 0.1 A g−1, the average capacity is recovered to 2280 mA h g−1. In addition, the Ni(HCO3)2/rGO exhibits much higher specific capacities than the pure Ni(HCO3)2 nanoparticles (Fig. S3†). These capacities are also significantly better than those obtained for the sample fabricated by mechanically mixing rGO and Ni(HCO3)2 (denoted as Ni(HCO3)2@rGO) using the same ratio (Fig. S4†), as the discharge/charge rates are increased, demonstrating a superior rate performance even at a high current density. This could be attributed to the unique 3D layered nanoarchitecture networks, allowing rapid access to the lithium ion and improving the electrical conductivity.
The cycling stability is also one of the most important parameters for application. The 3D layered Ni(HCO3)2/rGO materials were tested at a high current density of 5 and 10 A g−1 for more than 1000 cycles to study the long-term cycling stability. The result (Fig. 3e) shows that the Ni(HCO3)2/rGO can deliver a high capacity of ∼1535 mA h g−1 at a current density of 5 A g−1 after 1000 cycles, demonstrating a stable and durable energy output. The initial coulombic efficiency is about 74.3%, and subsequently the coulombic efficiencies are steadily increased and stably retain approximately 100% efficiency after ten cycles. It is worth noting that at the higher current density of 10 A g−1, the capacity first shows a continuous decay for 400 cycles. Then the capacity gradually increases and reaches approximately 1120 mA h g−1 at 1500 cycles, and then progressively decays from 1500 to 2000 cycles (∼80% capacity retention). More electrochemical data can also be seen in the ESI (Fig. S5†). In addition, the rate performances of the Ni(HCO3)2/rGO at different nickel concentration (GO, 1.5 mg mL−1) are summarized and compared in Fig. S6.† The excellent high rate and long cycle performance for the ultra-fast charging/discharging process indicates that the nanostructured and layer-by-layer 3D architecture of Ni(HCO3)2/rGO significantly reduces the ion transport paths.
To further explore the reason for the excellent electrochemical behaviors of Ni(HCO3)2/rGO, electrochemical impedance spectroscopy (EIS) measurements were conducted before cycling, and after 80 and 2000 cycles in the fully charged state in a frequency range of 100 kHz to 10 mHz and are presented as Nyquist plots in Fig. 3d. As can be seen, the Nyquist plots consist of a semicircle on the high-to-middle frequency region followed by a sloping line on the low frequency side, these are ascribed to the charge transfer process and the Li+ diffusion behavior, respectively. The intercept on the real impedance axis at the high frequency end corresponds to the internal ohmic resistance (Re) of the electrode, and the semicircle in the middle frequency range is related to the interface capacitance (constant phase angle element (CPE)) and the charge transfer resistance (Rct). The sloped line is closely associated with the diffusion process of the lithium ions known as the Warburg impedance (Zw).64 Furthermore, AC-impedance measurements could be used to gain a comprehensive characterization of the processes occurring at the electrode/electrolyte interface. The measured impedance spectra were fitted with an equivalent electrical circuit (Fig. 3d, inset) and the best-fitted parameters were tabulated (Table S1, ESI†). Before cycling, the CPE, Re and Zw of the Ni(HCO3)2/rGO electrode were 0.875 × 10⁻⁶ F, 2.4 Ω, and 112.8 Ω, respectively. The electrode shows a similar CPE, and the Re gradually increases to 3.6 Ω and 7.1 Ω, after 80 and 2000 cycles, respectively. On the other hand, as both the Rct and Zw values decrease for 80 and 2000 cycles, it is speculated that both the ionic and electronic conductivity would increase with the charging/discharging process, thus further confirming the integrity of such 3D layered conductive networks and the stability of the SEI film on the active materials surface. This impedance evolution in the charge/discharge cycles is well matched to the remarkable electrochemical performance of Ni(HCO3)2/rGO as an electrode material for use in LIBs.
The mixtures of the nano nickel oxide and lithium carbonate were prepared using a ball milling method, and then researched as electrode material for use in LIBs (see Fig. S7†). Considering the different proportions of nano nickel oxide to lithium carbonate in the mixture, it was found that the specific capacities of their mixtures are only related to the nickel oxide and not directly to lithium carbonate, indicating that nickel atoms generated from the mixtures do not show any catalytic effect on the reduction of lithium carbonate to LixC2. Therefore, the discharge/charge mechanism of the Ni(HCO3)2 should be studied more closely.
As shown in Fig. 4a–c, the lithium-storage mechanism of the as-obtained Ni(HCO3)2/rGO was carefully studied using an in situ XRD measurement. The first lithiation process of Ni(HCO3)2/rGO is very complex, along with the initial discharging process. The current understanding of this process is based on the principle that the conversion of pristine Ni(HCO3)2 (eqn (1)), leads to the further conversion of the new intermediates (eqn (2)–(4)), and the formation of a SEI film on the electrode/electrolyte interface. As shown in Fig. 4a, the characteristic peaks of the Ni(HCO3)2 phase at 37.1°, 40.2°, and 43.1° gradually weaken, move to a high angle, and disappear. Interestingly, during the first discharging process, it is observed that the characteristic peak of the Ni (111) phase at 44.4° gradually increases during the discharging process from 1.5 V to 1.2 V. Next, the peak of the Ni phase first decreases and then rises from 1.2 V to 0.01 V, despite the interferential peak of the Kapton film (the load of ultrathin copper foil on the Kapton film as a current collector and window). The reason why this experimental phenomenon is produced could be because the in situ generated Ni atoms are used in the reduction reaction from LiHCO3 to LixC2 (x = 0–2) as a catalyst. After the first cycle, it was observed that the peak of the Ni phase regularly appears during the discharge/charge cycling process (near about 0 V). This further illustrates that the process of formation and disappearance of nickel may be related to its participation in catalytic reactions. During the first and second discharge/charge process, the peaks near 38.5° and 41.5° gradually appear (Fig. 4b), which could be attributed to the formation of the LiF (111) and LiOH (002) phase in the SEI film, respectively. The peak from the LixC2 (x = 0–2) phase close to 50.8° is also clearly observed in Fig. 4c during the cycling process.
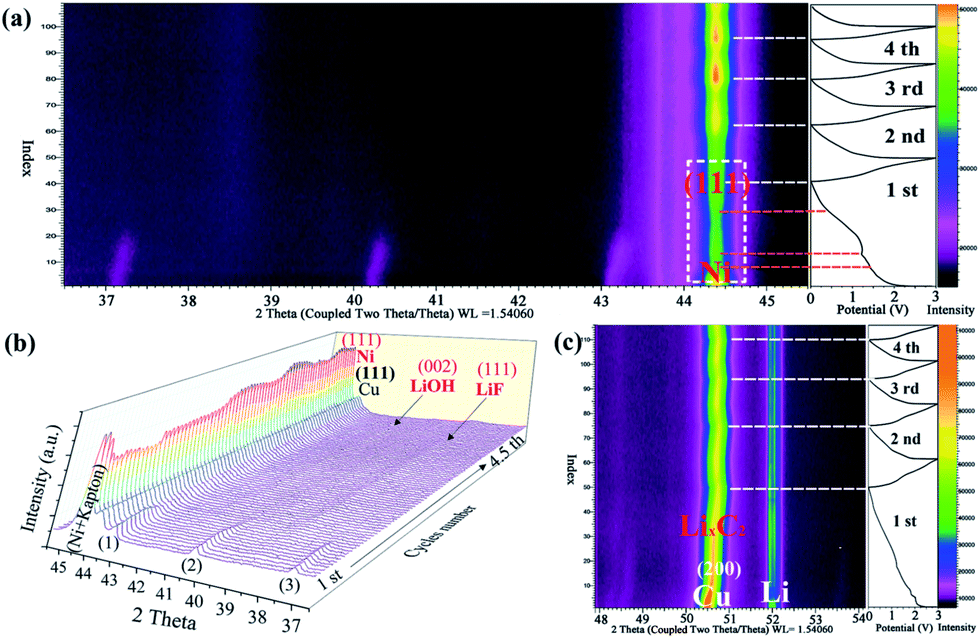 | ||
| Fig. 4 In situ XRD analysis of the lithium-storage mechanism of the as-prepared Ni(HCO3)2/rGO electrodes: (a) cycles 1 to 4.5 and the corresponding image plots of the diffraction patterns in a 2θ range of 36.5–45.5° within the voltage window of 0.01–3 V at a current density of 300 mA g−1, and (b) waterfall diagram showing the evolution of the XRD patterns at different discharge/charge states (the peaks 1–3 are assigned to Ni(HCO3)2); (c) cycles 1 to 4 and the corresponding image plots of the diffraction patterns in a 2θ range of 47.9–57.1° within the voltage window of 0.01–3 V at a current density of 250 mA g−1. | ||
The electrode composition before and after cycling was analyzed by ex situ XPS (Fig. 5, and S8†) to further understand the electrochemical reaction mechanism. As shown in Fig. 5a, the C 1s region of pristine Ni(HCO3)2/rGO can be fitted to three peaks at binding energies of 284.5, 286.1, and 290.6 eV, which can be assigned to C–C/C–H, C–OH/C–O–C, and HCO3− bindings, respectively.50 However, the cycled Ni(HCO3)2/rGO (Fig. 5a and b) displays four C 1s peaks at the binding energies of 284.5, 286.4, 288.5, and 290.6 eV, which are assigned to C–C/C–H, C–F/C–OH/C–O–C, CO, and HCO3− bindings, respectively.65 The relative percentage of the estimated peak areas at 284.8, 286.4, 288, and 290 eV are calculated based on the area integral. As the first discharging progressed from 1.2 V to 0.5 V, the C-contents of HCO3− and CO gradually decreased from 12.5% to 11.7% (at 0.1 V the value is 6.5%) and 18.2% to 4.6%, respectively. This means that the gradual transformation of HCO3− in Ni(HCO3)2 is mainly into a C–C binding-based species (this increased from 14.7% at 1.2 V to 48.7% at 0.5 V) corresponding to eqn (2). During the subsequent charging process from 0.1 V to 2.9 V, the C-contents of HCO3− increased from 6.5% and 9.1%, and the C–C binding based species decreased from 60.6% to 58.9%. These results clearly indicate that reversible reactions between HCO3− and the C–C binding based species (i.e., LixC2, x = 0–2) are occurring at the cycled electrodes. For the O 1s XPS spectra (Fig. 5c and d), pristine Ni(HCO3)2/rGO shows a single O 1s peak at the binding energy of 532 eV, which is assigned to –HCO3. The discharged and charged samples showed two peaks at 531.2 and 533 eV, which are assigned to LiOH/Li2O, and the C–![[O with combining low line]](https://www.rsc.org/images/entities/char_004f_0332.gif) –CO bindings of HCO3−/EC/DEC, respectively.66 These mean that the SEI (LiF/LiOH) film on the Ni(HCO3)2/rGO substrate in EC/DEC/LiPF6 electrolytes is formed by reduction of EC, DEC, and LiPF6, which is in good agreement with the results of the in situ XRD data. Furthermore, as is well known, the SEI film plays a key role in the cycle life of a battery, so its chemical composition is very important.67,68 Compared to Li2CO3, LiF is a good Li+ conductor and can reduce the impedance and irreversible capacity loss.69 For the Ni 2p XPS spectra (Fig. 5e), pristine Ni(HCO3)2/rGO shows two Ni 2p3/2 peaks at 857.4 and 862.7 eV, and two Ni 2p1/2 peaks at 875 and 881.3 eV. The first discharged sample had two Ni 2p3/2 peaks at 850.9, 859.7 eV which can be attributed to Ni0, and one wide and low Ni 2p1/2 peak at about 870–880 eV. For the first and 2000th cycle charged electrodes, there are two Ni 2p3/2 peaks at 850.5 (Ni0), 858 (Ni0), and two Ni 2p1/2 peaks at about 878 eV (Ni2+) and 880 eV (Ni3+). Interestingly, the middle state of the first discharged electrodes (Fig. 5f) at 1.2 V and 0.5 V has two Ni 2p3/2 peaks at 852 and 858.1 eV which can be attributed to Ni0, and two Ni 2p3/2 peaks at 854.4 and 861.4 eV which can be attributed to NiO, and one Ni 2p1/2 peak at about 876 eV which can be attributed to Ni0.70,71 Overall, the in situ XRD and ex situ XPS results further indicate that the Ni(HCO3)2 electrochemical performance follows the discharging/charging mechanism expressed in eqn (1)–(4).
–CO bindings of HCO3−/EC/DEC, respectively.66 These mean that the SEI (LiF/LiOH) film on the Ni(HCO3)2/rGO substrate in EC/DEC/LiPF6 electrolytes is formed by reduction of EC, DEC, and LiPF6, which is in good agreement with the results of the in situ XRD data. Furthermore, as is well known, the SEI film plays a key role in the cycle life of a battery, so its chemical composition is very important.67,68 Compared to Li2CO3, LiF is a good Li+ conductor and can reduce the impedance and irreversible capacity loss.69 For the Ni 2p XPS spectra (Fig. 5e), pristine Ni(HCO3)2/rGO shows two Ni 2p3/2 peaks at 857.4 and 862.7 eV, and two Ni 2p1/2 peaks at 875 and 881.3 eV. The first discharged sample had two Ni 2p3/2 peaks at 850.9, 859.7 eV which can be attributed to Ni0, and one wide and low Ni 2p1/2 peak at about 870–880 eV. For the first and 2000th cycle charged electrodes, there are two Ni 2p3/2 peaks at 850.5 (Ni0), 858 (Ni0), and two Ni 2p1/2 peaks at about 878 eV (Ni2+) and 880 eV (Ni3+). Interestingly, the middle state of the first discharged electrodes (Fig. 5f) at 1.2 V and 0.5 V has two Ni 2p3/2 peaks at 852 and 858.1 eV which can be attributed to Ni0, and two Ni 2p3/2 peaks at 854.4 and 861.4 eV which can be attributed to NiO, and one Ni 2p1/2 peak at about 876 eV which can be attributed to Ni0.70,71 Overall, the in situ XRD and ex situ XPS results further indicate that the Ni(HCO3)2 electrochemical performance follows the discharging/charging mechanism expressed in eqn (1)–(4).
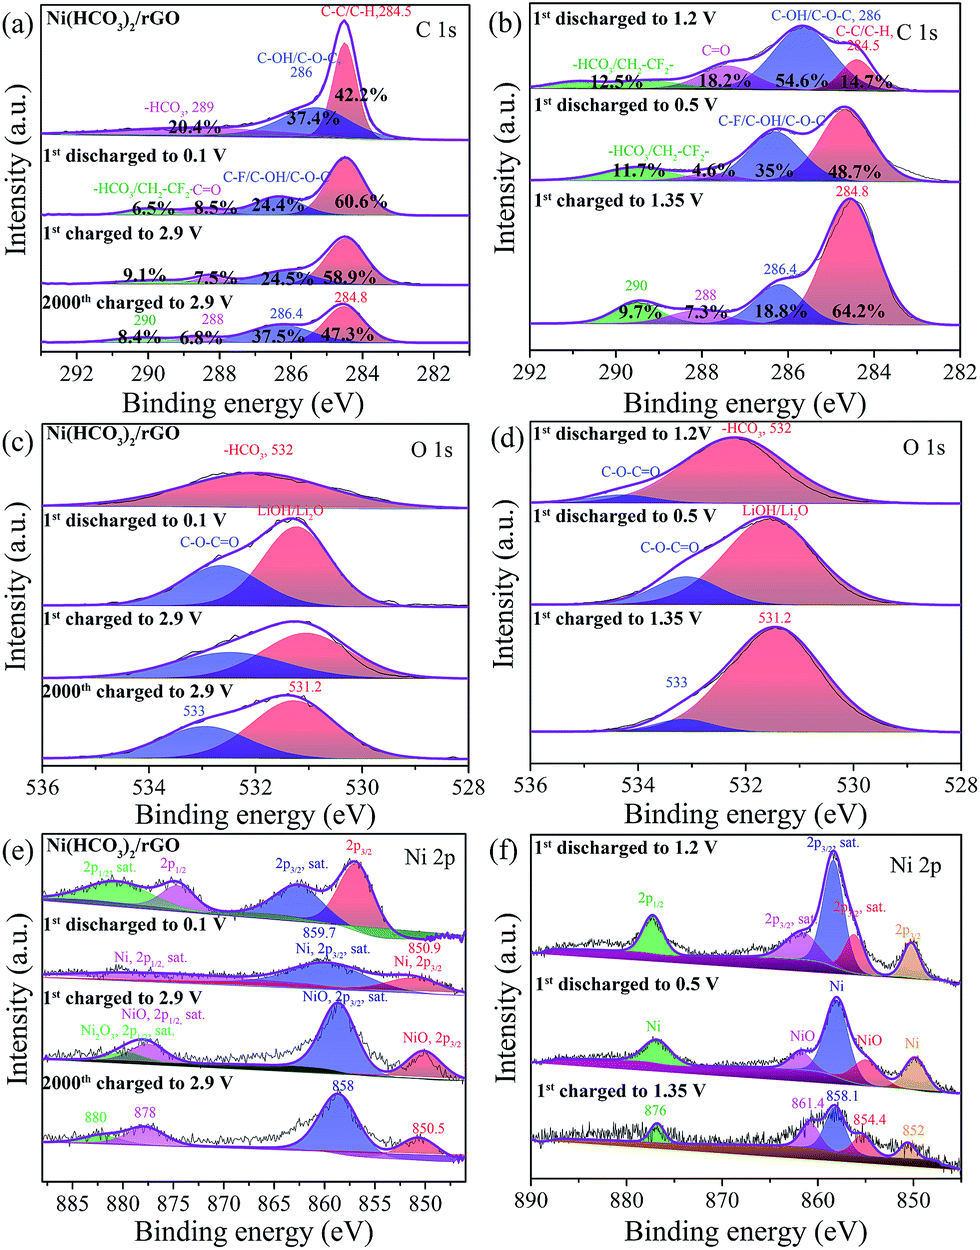 | ||
| Fig. 5 Ex situ XPS of as-prepared Ni(HCO3)2/rGO and its electrodes: (a and b) C 1s peak, (c and d) O 1s peak, and (e and f) Ni 2p peak at different state electrodes. | ||
The structural stability of the Ni(HCO3)2/rGO electrodes after the first and 100th cycle at 5 A g−1 and the 2000th cycle at 10 A g−1 was investigated using SEM (Fig. S9†). It can be observed that the nanocube structures and 3D conductive networks in the composite are almost maintained (Fig. S9a, c, and e†). This closed 3D connection may assist in confining the suppressed volume change, the formation of a stable SEI film, and improving electrical continuity, resulting in a reduced electrode internal resistance and even enhanced electrode kinetics. As shown in the high magnification images (Fig. S9b, d, and f†), it can be seen that the surfaces of the nanocubes become slick and possess multiscale pores. With prolonged cycling, the SEI film became thicker and strongly anchored onto the 3D networks. This suggests that the 3D layered nanostructures can significantly boost the Li+ ion and electron transfer.
To examine the possible reasons for the improved rate capability and cycling stability of the Ni(HCO3)2/rGO electrode, detailed kinetic analysis was conducted for a lithium storage device. Cyclic voltammetry measurements were carried out to further understand the electrochemical kinetics of the Ni(HCO3)2/rGO electrode. The CV curves at various scan rates from 0.2 to 20 mV s−1 display similar shapes and it is observed that the peaks become gradually broader as the scan rate increases (Fig. 6a). The total stored charge could be contributed to by several different ways, and these can be characterized by analyzing the CV data at various sweep rates according to
| i = avb | (5) |
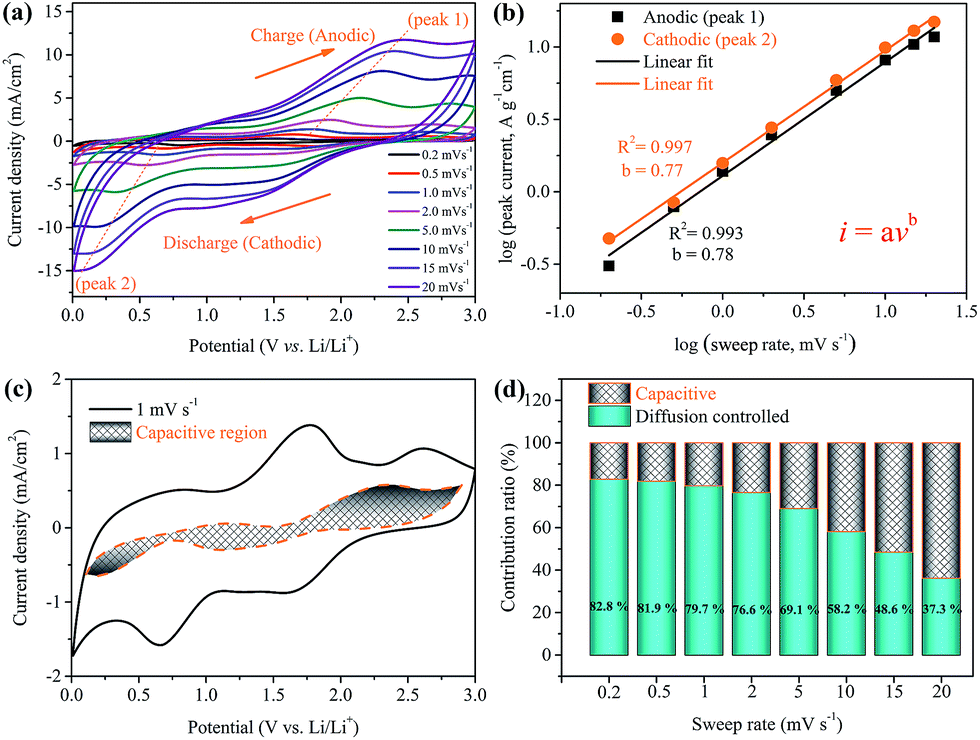 | ||
| Fig. 6 Electrochemical properties of the Ni(HCO3)2/rGO electrodes in a Li half-cell between 0.01 and 3 V versus Li. (a) CV curves at various scan rates from 0.2 to 20 mVs−1. (b) Variation of charge and discharge peak currents with scan rates. (c) Voltammetric response at a scan rate of 1 mV s−1, the capacitive contribution to the total current is shown by the shaded region; and (d) bar chart showing the contribution ratio of diffusion controlled (dark cyan) and capacitive contribution (shade region) at various sweep rates. | ||
In which the measured current i obeys a power law relationship with the sweep rate v, and a and b are adjustable parameters.72,73 In particular, the b-value of 0.5 indicates a total diffusion-controlled process, whereas 1.0 represents a capacitive process. By plotting log![[thin space (1/6-em)]](https://www.rsc.org/images/entities/char_2009.gif) i vs. logv, b-values are determined as the slopes, and 0.78 and 0.77 are calculated for cathodic and anodic peaks, respectively (Fig. 6b), indicating that the peak current is almost evenly controlled by the capacitive and diffusion-controlled process. The total capacitive contribution at a certain scan rate can be quantified by separating the specific contribution from the capacitive and diffusion-controlled process at a particular voltage according to
i vs. logv, b-values are determined as the slopes, and 0.78 and 0.77 are calculated for cathodic and anodic peaks, respectively (Fig. 6b), indicating that the peak current is almost evenly controlled by the capacitive and diffusion-controlled process. The total capacitive contribution at a certain scan rate can be quantified by separating the specific contribution from the capacitive and diffusion-controlled process at a particular voltage according to
| i(V) = k1v + k2v1/2 | (6) |
| i(V)/v1/2 = k1v1/2 + k2 | (7) |
In which k1 and k2 are constants for a given potential. By plotting i(V)/v1/2versus v1/2, k1 is determined as the slope and k2 is obtained according to the intercept, therefore capacitive and diffusion contributions can be obtained (Fig. S10†).74 Comparing the shaded area (k1v) with the experimental currents (solid line) in Fig. 6c, it can be found that the diffusion-controlled mechanism at 1 mV s−1 contributes about 79.7% of the total current of the Ni(HCO3)2/rGO electrode. Similarly, contribution ratios between the two different ways at other scan rates were also calculated (Fig. 6d). The quantified results show that the capacitive contribution gradually improves with an increase in the scan rate. It is interesting to note at very fast scan rates, for example, 10 mV s−1, the capacitive contribution is still not significant (∼41.8%). It can be concluded that the Ni(HCO3)2/rGO electrode is mainly diffusion-controlled in nature during the charge/discharge process. It also indicates that the rGO films in Ni(HCO3)2/rGO are good conducting networks and stably hold their structure.
Conclusions
In summary, we developed a versatile one-step hydrothermal and self-assembly method based on the electrostatic interaction and coordination principle to prepare Ni(HCO3)2 nanocubes (d = 100 ± 20 nm) with a good size-distribution wrapped by rGO films, which induced a hybrid 3D architecture anode material for use in high performance LIBs. Specifically, the as-prepared Ni(HCO3)2/rGO delivers an ultrahigh capacity (2450 mA h g−1 for 100 cycles at 100 mA g−1), an ultralong cycle stability (1120 mA h g−1 after 1500 cycles at 10 A g−1, and 1535 mA h g−1 after 1000 cycles at 5 A g−1), and an ultrafast rate capability (more than 450 mA h g−1 capacity at a current density of 40 A g−1). This is the best lithium storage performance that has been achieved among carbonate-based anodes that has been reported to date (Table 1). Such promising electrochemical results are attributed to the layer-by-layer integrated structure by achieving better electrical contact between the active materials to shorten ion transportation paths, which highlights the synergistic effect from combining the Ni(HCO3)2 nanocubes and rGO films. Additionally, the lithium storage mechanism of the as-prepared 3D Ni(HCO3)2/rGO has been studied via in situ XRD and ex situ XPS techniques with the reversible transfer from LiHCO3 to LixC2 (x = 0–2) and the further oxidation of Ni0 to Ni2+/Ni3+ allowing the ultrahigh specific capacity. In particular, on the electrode surface, the main components of the formed SEI film that display stability/durability are LiF and LiOH, which are good Li+ conductors and reduce the resistance and irreversible capacity loss, they also play a key role in cycling at a high rate and for a long lifetime. Meanwhile, electrochemical reaction kinetics have also been studied to further understand the unprecedented rate capability. More significantly, the facile synthesis, outstanding performance, and scientific understanding of the 3D Ni(HCO3)2/rGO architectures provide a further strategy for the design of graphene based composite materials via the coordination principle and using molecular self-assembly theory to achieve better materials for use in energy storage and catalysis applications, and so forth.| Morphology | Composite | Current (A g−1) | Voltage range (V) | Mass loading (g cm−1) | Reversible capacity after n cycles | Ref. (volume and page numbers) |
|---|---|---|---|---|---|---|
| Hollow spheres | Ni(HCO3)2 | 1 | 0.01–3 | 1.5 ± 0.2 | 1055 mA h g−1 (n = 80) | 50, ACS Energy Lett., 2, 111–116 |
| Nanostructured porous | MnCO3 spheres | 5 | 0.01–3 | — | 510 mA h g−1 (n = 2000) | 49, Nanoscale, 7, 10146–10151 |
| Nanoparticles | MnCO3/graphene | 2 | 0.01–3 | — | 1050 mA h g−1 (n = 1100) | 57, Adv. Mater., 27, 806–812 |
| MnxCo1−xCO3/rGO | Mn0.7Co0.3CO3/rGO | 2 | 0.01–3 | — | 901 mA h g−1 (n = 1500) | 52, Adv. Funct. Mater., 28, 1705817 |
| Micro-spheric | MnxNiyZnzCO3 | 1 | 0.01–3 | — | 760 mA h g−1 (n = 1000) | 53, Small, 14, 1702574 |
| Nanosheets | MoS2/graphene | 1 | 0.01–3 | ∼1 | 1250 mA h g−1 (n = 150) | 75, Adv. Energy Mater., 8, 1702254 |
| Hollow ball-in-ball nanostructure | NiO/Ni/graphene | 2 | 0.01–3 | — | 962 mA h g−1 (n = 1000) | 76, ACS nano, 10, 377–386 |
| Hollow nanotubes | Si–Cu alloy | 3.4 | 0.01–1.1 | 0.18–0.21(Si) | 1005 mA h g−1 (n = 1000) | 77, Adv. Funct. Mater., 26, 524–531 |
| Layer-by-layer | Co3O4/graphene | 0.16 | 0.01–3 | — | 1502 mA h g−1 (n = 300) | 78, Angew. Chem. Int. Ed., 56, 1869–1872 |
| Liquid metal | Sn–Ga alloy | 4 | 0.005–3 | — | 400 mA h g−1 (n = 4000) | 5, Energy Environ. Sci. (10, 1854–1861) |
| 3D nanoporous | SiGe | 1 | 0.1–1 | — | 1158 mA h g−1 (n = 150) | 79, ACS nano, 12, 2900–2908 |
| Hollow nanoparticles | CoO@BNG nanotubes | 1.75 | 0.01–3 | 0.54–0.65 | 400 mA h g−1 (n = 480) | 80, Adv. Mater., 30, 1705441 |
| Nanoparticles | MgH2/graphene | 2 | 0.001–3 | — | 395 mA h g−1 (n = 1000) | 81, ACS nano, 12, 3816–3824 |
| Yolk–double shell spheres | NiCo2V2O8 | 1 | 0.01–1.5 | 0.8–1 | 1228 mA h g−1 (n = 500) | 32, Angew. Chem. Int. Ed., 57, 2899–2903 |
| 3D layered nanocubes | Ni(HCO3)2/rGO | 5 | 0.01–3 | 1–1.3 | 1535 mA h g−1 (n = 1000) | This work |
| 10 | 803 mA h g−1 (n = 2000) |
Experimental section
Synthesis of materials
First, the as-prepared GO (120 mg) was dispersed into 80 mL deionized water. After the mixture was dispersed using ultrasonic waves for 2 h, the urea (1.9 g, 0.375 M) was dissolved in the GO aqueous suspension Then, the nickel acetate tetrahydrate (0.4 g, 0.02 M) was add into the mixed solution slowly. In this process, the dissociated nickel ions (Ni2+) were adsorbed onto the GO sheets by electrostatic interaction and coordination with urea. Subsequently, the as-prepared dispersion was transferred into a 100 mL Teflon-lined autoclave and was hydrothermally treated at 180 °C for 24 h. After cooling down to room temperature, the black cylindrical hydrogel of Ni(HCO3)2/rGO was obtained (Fig. S11†). Then, the hydrogel was soak-washed using deionized water eight times and freeze dried overnight to obtain the black aerogel of Ni(HCO3)2/rGO (Fig. S1a†). In comparison, the mixed solution without GO (Fig. S3†) was also treated in the same hydrothermal environment, and the sample, denoted as Ni(HCO3)2@rGO, was fabricated by mechanically mixing rGO and Ni(HCO3)2 according to the same ratio (Fig. S4†) as the anodes.Characterization
X-ray diffraction patterns were obtained from a PANalytical X'Pert Pro within 2θ range from 5° to 80°, by using Cu Kα radiation (λ = 1.5418 Å). The morphologies of the samples were obtained from a field-emission scanning microscopy (FESEM, Zeiss Auriga 500). The composition was determined by energy-dispersive X-ray spectroscope, which was attached to the FESEM instrument. TEM, high-angle annular dark-field scanning transmission electron microscopy (HAADF-STEM), and elemental mapping were performed on a FEI TECNAIG2 F20-S-TWIN instrument with a field emission gun operating at 200 kV. The in situ XRD spectra were collected using a Bruker D8 ADVANCE (40 kV, 40 mA) with Cu Kα (λ = 0.15406 nm) radiation at a scanning rate of 1° min−1. In particular, an ultra-thin copper foil film was coated on the sealed Kapton tape by a thermal evaporator as the current collector and window, lithium foil was used as a counter electrode and Celgard 2400 microporous membrane used as a separator. XPS measurements were performed on the AXIS Supra photoelectron electron spectrometer with Al Kα radiation. The Raman spectra analysis was recorded with a LabRAM HR Evolution (HORIBA) Raman system with a laser frequency of 532 nm as an excitation source and a laser power of 5 mW. The FT-IR spectra of the products were recorded on a Nicolet NEXUS 470 IFS 66 v s−1 infrared spectrometer using the standard KBr disk method in the scale of 400–4000 cm−1. The amount of carbon in the sample was determined using TGA (NETZSCH STA 449 F3 apparatus) in Ar and air with a heating rate of 10 °C min−1. N2 adsorption–desorption measurements were conducted on a Micromeritics ASAP 2420-4MP instrument to characterize the porous structure, including the BET surface area and the pore size distribution.Cell assembly and electrochemical evaluation
The working electrodes were fabricated by mixing the active materials (3D layered nanocubes Ni(HCO3)2/rGO) with a binder, polyvinylidene fluoride (PVDF), and conductive carbon black, at a weight ratio of 8:1:1. The mixture was dispersed in N-methyl-2-pyrrolidinone (NMP) to from a slurry and then uniformly pasted onto a copper foil with a preparation device (thickness, 200 μm) and then dried under a vacuum at 120 °C for 12 h. The mass of active materials (Ni(HCO3)2/rGO) per working plate was 1–1.3 mg cm−2. Electrochemical test cells were assembled in an argon-filled glove box using coin cells (2016 type) with lithium foil as a counter electrode, and a Celgard 2400 microporous membrane as the separator. The organic electrolyte was composed of 1.0 M LiPF6 in ethylene carbonate (EC) and diethyl carbonate (DEC) (1:1, v/v). GCD measurements were performed at various current densities over a voltage range of 0.01–3.0 V (vs. Li+/Li) using the LAND CT2001A multi-channel battery testing system at room temperature. CV and EIS measurements of the electrodes were carried out on an electrochemical workstation (CHI660E). The cyclic voltammograms were obtained over the potential range of 0.01 to 3.0 V at different scanning rates. The impedance spectra were recorded by applying a frequency range from 100 kHz to 0.01 Hz with the amplitude of 5 mV at an open circuit voltage. All the electrochemical tests were performed at room temperature.
Conflicts of interest
There are no conflicts to declare.Acknowledgements
This work is supported by the National Natural Science Foundation of China (No. 21373189) and Natural Science Foundation of Henan Province (No. 182300410278). The authors thank Dr Mengjia Li, the Modern analysis and Computing Center, Zhengzhou University and Dr Ning Yang, the application Scientist at Bruker (Beijing) Scientific Technology Co., Ltd.Notes and references
- C. P. Grey and J. M. Tarascon, Nat. Mater., 2016, 16, 45–56 CrossRef PubMed.
- N. Nitta, F. Wu, J. T. Lee and G. Yushin, Mater. Today, 2015, 18, 252–264 CrossRef.
- U. H. Kim, D. W. Jun, K. J. Park, Q. Zhang, P. Kaghazchi, D. Aurbach, D. T. Major, G. Goobes, M. Dixit, N. Leifer, C. M. Wang, P. Yan, D. Ahn, K. H. Kim, C. S. Yoon and Y. K. Sun, Energy Environ. Sci., 2018, 11, 1271–1279 RSC.
- J. Jiang, J. Zhu, W. Ai, Z. Fan, X. Shen, C. Zou, J. Liu, H. Zhang and T. Yu, Energy Environ. Sci., 2014, 7, 2670–2679 RSC.
- Y. Wu, L. Huang, X. Huang, X. Guo, D. Liu, D. Zheng, X. Zhang, R. Ren, D. Qu and J. Chen, Energy Environ. Sci., 2017, 10, 1854–1861 RSC.
- S. Chu, Y. Cui and N. Liu, Nat. Mater., 2016, 16, 16–22 CrossRef PubMed.
- V. Dusastre and L. Martiradonna, Nat. Mater., 2016, 16, 15 CrossRef PubMed.
- N. J. Dudney and J. Li, Science, 2015, 347, 131–132 CrossRef PubMed.
- M. R. Palacin and A. de Guibert, Science, 2016, 351, 1253292 CrossRef PubMed.
- S. H. Yu, D. J. Lee, M. Park, S. G. Kwon, H. S. Lee, A. Jin, K. S. Lee, J. E. Lee, M. H. Oh, K. Kang, Y. E. Sung and T. Hyeon, J. Am. Chem. Soc., 2015, 137, 11954–11961 CrossRef PubMed.
- J. W. Choi and D. Aurbach, Nat. Rev. Mater., 2016, 1, 16013 CrossRef.
- L. C. Loaiza, E. Salager, N. Louvain, A. Boulaoued, A. Iadecola, P. Johansson, L. Stievano, V. Seznec and L. Monconduit, J. Mater. Chem. A, 2017, 5, 12462–12473 RSC.
- C. Wang, Y. Zhou, M. Ge, X. Xu, Z. Zhang and J. Z. Jiang, J. Am. Chem. Soc., 2010, 132, 46–47 CrossRef PubMed.
- S. Kang, X. Chen and J. Niu, Nano Lett., 2018, 18, 467–474 CrossRef PubMed.
- W. Long, B. Fang, A. Ignaszak, Z. Wu, Y. J. Wang and D. Wilkinson, Chem. Soc. Rev., 2017, 46, 7176–7190 RSC.
- S. Choi, T.-w. Kwon, A. Coskun and J. W. Choi, Science, 2017, 357, 279–283 CrossRef PubMed.
- Q. Wei, F. Xiong, S. Tan, L. Huang, E. H. Lan, B. Dunn and L. Mai, Adv. Mater., 2017, 29, 1–39 Search PubMed.
- Z. Liu, D. Guan, Q. Yu, L. Xu, Z. Zhuang, T. Zhu, D. Zhao, L. Zhou and L. Mai, Energy Storage Materials, 2018, 13, 112–118 CrossRef.
- L. Wu, J. Yang, J. Tang, Y. Ren, Y. Nie and X. Zhou, Electrochim. Acta, 2016, 190, 628–635 CrossRef.
- L. Suo, D. Oh, Y. Lin, Z. Zhuo, O. Borodin, T. Gao, F. Wang, A. Kushima, Z. Wang, H. C. Kim, Y. Qi, W. Yang, F. Pan, J. Li, K. Xu and C. Wang, J. Am. Chem. Soc., 2017, 139, 18670–18680 CrossRef PubMed.
- S. M. E. Peled, J. Electrochem. Soc., 2017, 7, A1703–A1719 CrossRef.
- H. Sun, G. Xin, T. Hu, M. Yu, D. Shao, X. Sun and J. Lian, Nat. Commun., 2014, 5, 4526 CrossRef PubMed.
- Y. Tang, Y. Zhang, X. Rui, D. Qi, Y. Luo, W. R. Leow, S. Chen, J. Guo, J. Wei, W. Li, J. Deng, Y. Lai, B. Ma and X. Chen, Adv. Mater., 2016, 28, 1567–1576 CrossRef PubMed.
- X. Zhou, L. Yu, X.-Y. Yu and X. W. D. Lou, Adv. Energy Mater., 2016, 6, 1601177 CrossRef.
- J. Choi, W. S. Kim and S. H. Hong, Nanoscale, 2018, 10, 4370–4376 RSC.
- M. G. Park, D. H. Lee, H. Jung, J. H. Choi and C. M. Park, ACS Nano, 2018, 12, 2955–2967 CrossRef PubMed.
- L. Yu, B. Guan, W. Xiao and X. W. D. Lou, Adv. Energy Mater., 2015, 5, 1500981 CrossRef.
- Y. Feng, H. Zhang, Y. Zhang, Y. Bai and Y. Wang, J. Mater. Chem. A, 2016, 4, 3267–3277 RSC.
- T. M. Higgins, S. H. Park, P. J. King, C. J. Zhang, N. McEvoy, N. C. Berner, D. Daly, A. Shmeliov, U. Khan, G. Duesberg, V. Nicolosi and J. N. Coleman, ACS Nano, 2016, 10, 3702–3713 CrossRef PubMed.
- L. Chen, H. Jiang, H. Jiang, H. Zhang, S. Guo, Y. Hu and C. Li, Adv. Energy Mater., 2017, 7, 1602782 CrossRef.
- S. Chae, N. Kim, J. Ma, J. Cho and M. Ko, Adv. Energy Mater., 2017, 7, 1700071 CrossRef.
- Y. Lu, J. Nai and X. W. D. Lou, Angew. Chem., Int. Ed., 2018, 57, 2899–2903 CrossRef PubMed.
- T. Sheng, Y. F. Xu, Y. X. Jiang, L. Huang, N. Tian, Z. Y. Zhou, I. Broadwell and S. G. Sun, Acc. Chem. Res., 2016, 49, 2569–2577 CrossRef PubMed.
- Z. Li, X. Feng, L. Mi, J. Zheng, X. Chen and W. Chen, Nano Res., 2018, 11, 4038–4048 CrossRef.
- J. Liang, H. Hu, H. Park, C. Xiao, S. Ding, U. Paik and X. W. Lou, Energy Environ. Sci., 2015, 8, 1707–1711 RSC.
- Z. Wang, M. Zhang and J. Zhou, ACS Appl. Mater. Interfaces, 2016, 8, 11507–11515 CrossRef PubMed.
- J. Chen, X. Wu, Y. Liu, Y. Gong, P. Wang, W. Li, S. Mo, Q. Tan and Y. Chen, Appl. Surf. Sci., 2017, 425, 461–469 CrossRef.
- C. Tan, X. Cao, X. J. Wu, Q. He, J. Yang, X. Zhang, J. Chen, W. Zhao, S. Han, G. H. Nam, M. Sindoro and H. Zhang, Chem. Rev., 2017, 117, 6225–6331 CrossRef PubMed.
- X. Zhang, H. Cheng and H. Zhang, Adv. Mater., 2017, 29, 1701704 CrossRef PubMed.
- E. Pomerantseva and Y. Gogotsi, Nat. Energy, 2017, 2, 17089 CrossRef.
- S. Zhu, J. Li, X. Deng, C. He, E. Liu, F. He, C. Shi and N. Zhao, Adv. Funct. Mater., 2017, 27, 1605017 CrossRef.
- G. Liu, L. Zhao, R. Sun, W. Chen, M. Hu, M. Liu, X. Duan and T. Zhang, Electrochim. Acta, 2018, 259, 20–27 CrossRef.
- Y. Lu, L. Yu and X. W. Lou, Chem, 2018, 4, 972–996 Search PubMed.
- N. Tian, C. Hua, Z. Wang and L. Chen, J. Mater. Chem. A, 2015, 3, 14173–14177 RSC.
- L. Su, Z. Zhou, X. Qin, Q. Tang, D. Wu and P. Shen, Nano Energy, 2013, 2, 276–282 CrossRef.
- S. Zhao, Y. Wang, R. Liu, Y. Yu, S. Wei, F. Yu and Q. Shen, J. Mater. Chem. A, 2015, 3, 17181–17189 RSC.
- J. Q. Zhao and Y. Wang, J. Mater. Chem. A, 2014, 2, 14947 RSC.
- S. Zhao, F. Feng, F. Yu and Q. Shen, J. Mater. Chem. A, 2015, 3, 24095–24102 RSC.
- W. Kang, D. Y. Yu, W. Li, Z. Zhang, X. Yang, T. W. Ng, R. Zou, Y. Tang, W. Zhang and C. S. Lee, Nanoscale, 2015, 7, 10146–10151 RSC.
- S. Zhao, Z. Wang, Y. He, B. Jiang, Y. Harn, X. Liu, F. Yu, F. Feng, Q. Shen and Z. Lin, ACS Energy Lett., 2017, 2, 111–116 CrossRef.
- M. A. Garakani, S. Abouali, B. Zhang, C. A. Takagi, Z. L. Xu, J. Q. Huang, J. Huang and J. K. Kim, ACS Appl. Mater. Interfaces, 2014, 6, 18971–18980 CrossRef PubMed.
- R. Zhang, X. Huang, D. Wang, T. K. A. Hoang, Y. Yang, X. Duan, P. Chen, L.-C. Qin and G. Wen, Adv. Funct. Mater., 2018, 28, 1705817 CrossRef.
- Q. Li, Z. Liu, C. Wang, Y. Zhao and R. Che, Small, 2018, 14, 1702574 CrossRef PubMed.
- X. Zang, Z. Dai, J. Guo, Q. Dong, J. Yang, W. Huang and X. Dong, Nano Res., 2016, 9, 1358–1365 CrossRef.
- Y. Wei, G. Cheng, J. Xiong, F. Xu and R. Chen, ACS Sustainable Chem. Eng., 2017, 5, 5027–5038 CrossRef.
- S. Tan, Y. Jiang, Q. Wei, Q. Huang, Y. Dai, F. Xiong, Q. Li, Q. An, X. Xu, Z. Zhu, X. Bai and L. Mai, Adv. Mater., 2018, 30, 1707122 CrossRef PubMed.
- Y. Zhong, M. Yang, X. Zhou, Y. Luo, J. Wei and Z. Zhou, Adv. Mater., 2015, 27, 806–812 CrossRef PubMed.
- W. Sun and Y. Wang, Nanoscale, 2014, 6, 11528–11552 RSC.
- Y. Dong, D. Li, C. Gao, Y. Liu and J. Zhang, J. Mater. Chem. A, 2017, 5, 8087–8094 RSC.
- J. Ding, B. Li, Y. Liu, X. Yan, S. Zeng, X. Zhang, L. Hou, Q. Cai and J. Zhang, J. Mater. Chem. A, 2015, 3, 832–839 RSC.
- Y. Wang, D. Li, Y. Liu and J. Zhang, Electrochim. Acta, 2016, 203, 84–90 CrossRef.
- K. Krishnamoorthy, M. Veerapandian, K. Yun and S. J. Kim, Carbon, 2013, 53, 38–49 CrossRef.
- G. Venugopal, M.-H. Jung, M. Suemitsu and S.-J. Kim, Carbon, 2011, 49, 2766–2772 CrossRef.
- F. Han, C. Zhang, J. Yang, G. Ma, K. He and X. Li, J. Mater. Chem. A, 2016, 4, 12781–12789 RSC.
- D. T. Clark, W. J. Feast, D. Kilcast and W. K. R. Musgrave, J. Polym. Sci., Polym. Chem. Ed., 1973, 11, 389–411 CrossRef.
- J. P. Contour, A. Saleve, M. Froment, M. Garreau, J. Thevenin and D. J. Warin, Microsc. Spectrosc. Electron., 1979, 4, 483 Search PubMed.
- S. J. An, J. Li, C. Daniel, D. Mohanty, S. Nagpure and D. L. Wood, Carbon, 2016, 105, 52–76 CrossRef.
- J. B. Goodenough and Y. Kim, Chem. Mater., 2010, 22, 587–603 CrossRef.
- Y. Li, B. Xu, H. Xu, H. Duan, X. Lu, S. Xin, W. Zhou, L. Xue, G. Fu, A. Manthiram and J. B. Goodenough, Angew. Chem., Int. Ed., 2017, 56, 753–756 CrossRef PubMed.
- A. N. Mansour, Surf. Sci. Spectra, 1994, 3, 231–238 CrossRef.
- A. N. Mansour and C. A. Melendres, Surf. Sci. Spectra, 1994, 3, 271–278 CrossRef.
- V. Augustyn, P. Simon and B. Dunn, Energy Environ. Sci., 2014, 7, 1597 RSC.
- T. Brezesinski, J. Wang, J. Polleux, B. Dunn and S. H. Tolbert, J. Am. Chem. Soc., 2009, 131, 1802–1809 CrossRef PubMed.
- J. Wang, J. Polleux, J. Lim and B. Dunn, J. Phys. Chem. C, 2007, 111, 14925–14931 CrossRef.
- G. Wang, J. Zhang, S. Yang, F. Wang, X. Zhuang, K. Müllen and X. Feng, Adv. Energy Mater., 2018, 8, 1702254 CrossRef.
- F. Zou, Y. M. Chen, K. Liu, Z. Yu, W. Liang, S. M. Bhaway, M. Gao and Y. Zhu, ACS Nano, 2016, 10, 377–386 CrossRef PubMed.
- H. Song, H. X. Wang, Z. Lin, X. Jiang, L. Yu, J. Xu, Z. Yu, X. Zhang, Y. Liu, P. He, L. Pan, Y. Shi, H. Zhou and K. Chen, Adv. Funct. Mater., 2016, 26, 524–531 CrossRef.
- B. Jiang, Y. He, B. Li, S. Zhao, S. Wang, Y. B. He and Z. Lin, Angew. Chem., Int. Ed., 2017, 56, 1869–1872 CrossRef PubMed.
- Y. Yang, S. Liu, X. Bian, J. Feng, Y. An and C. Yuan, ACS Nano, 2018, 12, 2900–2908 CrossRef PubMed.
- H. Tabassum, R. Zou, A. Mahmood, Z. Liang, Q. Wang, H. Zhang, S. Gao, C. Qu, W. Guo and S. Guo, Adv. Mater., 2018, 30, 1705441 CrossRef PubMed.
- B. Zhang, G. Xia, D. Sun, F. Fang and X. Yu, ACS Nano, 2018, 12, 3816–3824 CrossRef PubMed.
Footnote |
| † Electronic supplementary information (ESI) available: Experimental section, Scheme S1 the electrochemical process for two configurations of electrodes, SEM, TEM images, EDS, TG, XPS data, SEM images of Ni(HCO3)2/rGO, and Ni(HCO3)2 electrodes cycled after different cycles (SEI film), comparison and discussion of the mixed sample Ni(HCO3)2@rGO, and Table S1 (EIS data). See DOI: 10.1039/c8sc02868k |
| This journal is © The Royal Society of Chemistry 2018 |