
 Open Access Article
 This Open Access Article is licensed under a Creative Commons Attribution-Non Commercial 3.0 Unported Licence
Effects of coordination sphere on unusually large zero field splitting and slow magnetic relaxation in trigonally symmetric molecules†
Kelsey A.
Schulte
,
Kuduva R.
Vignesh
 and
Kim R.
Dunbar
*
and
Kim R.
Dunbar
*
Department of Chemistry, Texas A&M University, College Station, Texas 77843, USA. E-mail: Dunbar@chem.tamu.edu
First published on 20th September 2018
Abstract
Geometric control in mononuclear complexes has come to the forefront in the field of molecular magnets due to its profound effects on relaxation pathways and blocking temperature in single molecule magnets (SMMs). Herein we report the synthesis and magnetic characterization of six trigonally symmetric, divalent Fe, Co, and Ni molecules, with the rigid geometry enforced via the use of the tris-anionic, tetradentate ligand MST (N,N′,N′′-[2,2′,2′′-nitrilotris-(ethane-2,1-diyl)]tris(2,4,6-trimethylbenzenesulfonamide)). A systematic study on the effect of converting between trigonal monopyramidal complexes, (Me4N)[M(MST)], and trigonal bipyramidal complexes, (Me4N)[M(MST)(OH2)] was conducted experimentally and computationally. It was found that (Me4N)[Ni(MST)] exhibits a very large, near record zero-field splitting parameter (D) value of −434 cm−1, owing to an extremely low lying first excited state. The trigonal monopyramidal cobalt and iron complexes exhibit slow magnetic relaxation under applied fields, resulting in barriers of 45 K and 63.9 K respectively. Coordination of a single water molecule in the open axial site of the trigonal monopyramidal complexes exerts drastic dampening effects on the D value as well as slow relaxation. Computations reveal that coordination of water rotates the Dzz axis away from the C3 axis of symmetry resulting in a smaller D value. The aquo species (Me4N)[Co(MST)(OH2)] also exhibits magnetic relaxation under an applied field, but the barrier is reduced to 9.9 K. Water coordination totally quenches the magnetic behavior in the iron complex, and reduces the D value for nickel to −185 cm−1. These results showcase the drastic effect that a small change in the coordination environment can have on magnetic behavior, as well as that trigonal monopyramidal geometry can lead to near record D values.
Introduction
In the presence of axial magnetic anisotropy, the total spin, S, of a system will split into a bistable ground state of the microstates +mS and −mS. A thermal barrier exists between these levels which must be overcome to reverse the orientation of the spins (Ueff), which is defined as Ueff = |D|S2 for integer spins, or Ueff = |D|(S2 − 1/4) for non-integer spin systems. After application and subsequent removal of a DC field, this barrier results in magnetic memory and hysteresis reminiscent of bulk magnetic materials. Such molecules, referred to as Single Molecule Magnets (SMMs) have applications in quantum computing, spin transistors, and data storage.1–3 While the Orbach relaxation process over the barrier is the ideal pathway, relaxation also occurs via Raman and quantum tunneling processes which undercut the barrier resulting in a lower blocking temperature.4After the discovery of Singe Molecule Magnets (SMMs) in 1993 with the report of [Mn12O12(OAc)16(H2O)4],5 known as Mn12, attention quickly turned towards increasing the barrier by increasing the spin of the system. It has largely been the case, however, that even significant increases in the ground spin state do not result in the expected increase in barrier height, with a prominent example being an S = 83/2 system that exhibits a barrier of Ueff = 4 cm−1.6 Relying on exchange interactions in polynuclear systems has led to the successful increase in S values but with a concomitant decrease in D,7,8 resulting in lower barriers. Clearly increasing the axial anisotropy is vital to increasing the operating temperature of SMMs.
In this vein, recent focus has been on the single molecule magnet behavior of mononuclear complexes for which spin orbit coupling can be maximized.9 Mononuclear complexes hold the recent hysteresis records of 20 K![[thin space (1/6-em)]](https://www.rsc.org/images/entities/char_2009.gif) 10 and 60 K.11,12 While rare-earth SMMs hold the record, a few 3d metal complexes have been found to exhibit barriers similar to their lanthanide counterparts. Complexes of d-block elements have the distinct advantage of being highly tunable, such that strict control over magnetic anisotropy is feasible, making them highly promising targets as well.
10 and 60 K.11,12 While rare-earth SMMs hold the record, a few 3d metal complexes have been found to exhibit barriers similar to their lanthanide counterparts. Complexes of d-block elements have the distinct advantage of being highly tunable, such that strict control over magnetic anisotropy is feasible, making them highly promising targets as well.
The first reported mononuclear 3d SMM is the trigonal monopyramidal Fe(II) complex K[(tpaMes)Fe] (tpa = tris(pyrrolyl-α-methyl)amine).13 Since this finding and the subsequent exploration of a family with various tpaR ligands,14 many more 3d SMMs have been reported. To date, first row transition metal SMM behavior has been observed in complexes of CrII, MnIII, FeI,II,III, CoI,II, NiI,II, and CuIII.9 The Ueff barriers above 100 cm−1 have been found in complexes with coordination numbers of 2–4,15–20 a clear indication that low coordinate and highly symmetric 3d SMMs are worth pursuing. The current records for Fe, Co, and Ni are [K(crypt-222)][FeI(C(TMS)3)2],16 [(sIPr)CoIINDmp] (Dmp = 2,6-dimesitylphenyl),17 and [NiII(MDABCO)2Cl3]ClO4 (MDABCO = 1-methyl-4-aza-1-azo-niabicyclo[2.2.2]octanium)21 with barriers of 226, 413, 48 cm−1 respectively. Although the barrier of [NiII(MDABCO)2Cl3]ClO4 is not particularly large, the zero field splitting parameter (D) is a record bearing −535 cm−1. The iron and cobalt complexes are both linear molecules and the nickel complex is in a trigonal bipyramidal geometry.
In line with these trends in literature as well as theoretical predictions by Ruiz et al.,22 we chose to pursue complexes containing 3d6, 3d7, and 3d8 metal centers in trigonal monopyramidal or bipyramidal geometries. These complexes are expected to lead to large negative D values for d6,8 and large positive D values for d7 complexes. Previously, our group has demonstrated that both trigonal monopyramidal23 (TMP) and bipyramidal24 (TBP) geometries can indeed lead to slow magnetic relaxation. These studies also unearthed the fact that very small perturbations in symmetry and metal to metal distances have a distinct effect on magnetic behavior for compounds in the same geometry.24
The current aim is to further explore the effect of specific coordination changes across a series. To this end, we chose to pursue comparisons of TMP and TBP complexes. The crystal field splitting diagram for these geometries can be found in Fig. 1, for which divalent iron, cobalt, and nickel complexes have total spins, S, of 2, 3/2, and 1 respectively. The energies of the orbitals differ between the two geometries due to additional coordination in the second axial position, but the relative order remains the same with the dxz,yz orbitals being the lowest in energy, followed by the dxy, dx2−y2 orbitals, and finally by the dz2 orbital at the highest energy. Ideally, this geometry will lead to first order spin orbit coupling in the iron and nickel complexes, generating large axial anisotropies, but the reality is that Jahn–Teller distortions will result in a breaking of the degeneracy of these orbitals and subsequent quenching of first order spin orbit coupling. A strategy for minimizing the effects of these distortions is to use rigid, bulky ligands in an effort to isolate a near perfect geometry. To this end, it is prudent to choose a polydentate ligand that binds to all four of the positions of the TMP geometry. In this case, one can also prepare five-coordinate TBP adducts with the second axial position being occupied.
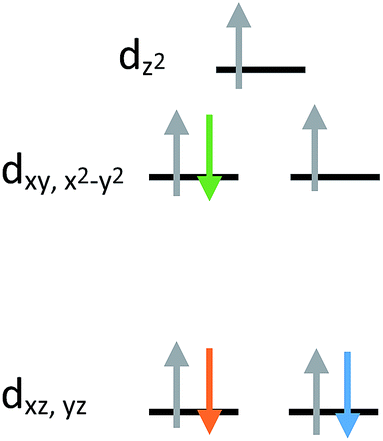 | ||
| Fig. 1 Crystal field splitting diagram for divalent iron, cobalt and nickel in ideal trigonal mono and bipyramidal geometries, as indicated by the orange, blue, and green electron arrows. | ||
The tetradentate ligand N,N′,N′′-[2,2′,2′′-nitrilotris-(ethane-2,1-diyl)]tris(2,4,6-trimethylbenzenesulfonamide) [H3MST], first reported by the Borovik group in research with iron and cobalt metal ions, nicely fits these requirements, Fig. 2.25,26 They focused on using these to mimic active sites in biologically relevant proteins and enzymes such as nonheme iron-containing monooxygenases and secondary coordination spheres in metalloproteins.25,27,28 In the present work with 3d metals, the steric bulk of the mesityl substituents enforces trigonal monopyramidal geometry with an open axial position. Subsequent coordination of a water molecule in the second axial position results in the trigonal bipyramidal geometry. Herein, we report experimental and computational studies in order to understand the magnetic behavior of six compounds, viz., (Me4N)[Co(MST)], (Me4N)[Co(MST)(OH2)], (Me4N)[Fe(MST)], (Me4N)[Fe(MST)(OH2)], (Me4N)[Ni(MST)], and (Me4N)[Ni(MST)(OH2)].
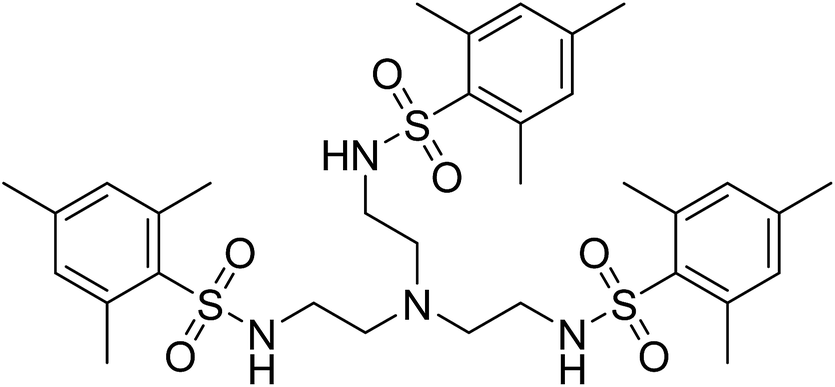 | ||
| Fig. 2 Structural formula of the neutral ligand N,N′,N′′-[nitrilotris(ethane-2,1-diyl)]tris(2,4,6-trimethylbenzenesulfonamide) [H3MST]. | ||
Results and discussion
Crystallographic details
The six compounds, (Me4N)[Co(MST)] (1), (Me4N)[Co(MST)(OH2)]·DCM (2), (Me4N)[Fe(MST)] (3), (Me4N)[Fe(MST)(OH2)] (4), (Me4N)[Ni(MST)] (5), (Me4N)[Ni(MST)(OH2)] (6) were synthesized based on a literature procedure25via a reaction between the deprotonated ligand using NaH, the appropriate metal(II) acetate salt, and tetramethylammonium acetate in dimethylacetamide (DMA) as the solvent. Crystals were obtained by slow diffusion of diethyl ether into either DMA or dichloromethane (DCM) solutions. The anhydrous salts crystallize in the monoclinic space group P21/n, whereas complexes 2 and 6 crystallize in triclinic P![[1 with combining macron]](https://www.rsc.org/images/entities/char_0031_0304.gif) and 4 in monoclinic C2/c (Fig. 3). The structures of 1, 2, and 4 were previously reported.25,26 We collected 2 in an alternate space group of triclinic P rather than the reported C2/c. We were able to isolate the monoclinic space group by their reported synthesis method or via slow diffusion of diethyl ether directly into the DMA solution. The triclinic crystals form in a larger excess of water followed by slow diffusion of diethyl ether into the DCM solution. We chose to study only the triclinic phase for ease of synthesis and consistency in crystallization methods.
and 4 in monoclinic C2/c (Fig. 3). The structures of 1, 2, and 4 were previously reported.25,26 We collected 2 in an alternate space group of triclinic P rather than the reported C2/c. We were able to isolate the monoclinic space group by their reported synthesis method or via slow diffusion of diethyl ether directly into the DMA solution. The triclinic crystals form in a larger excess of water followed by slow diffusion of diethyl ether into the DCM solution. We chose to study only the triclinic phase for ease of synthesis and consistency in crystallization methods.
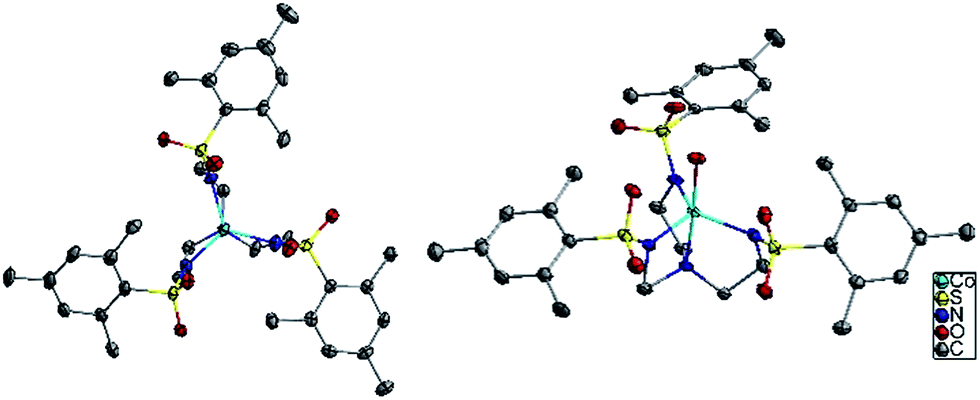 | ||
| Fig. 3 Structures of complexes 1 and 2, looking down the C3 axis. Colors are as follows: light blue for cobalt, blue for nitrogen, yellow for sulfur, red for oxygen, and grey for carbon. Hydrogen atoms, the cation Me4N and any solvent has been omitted for clarity. | ||
The coordination environment for 1, 3, and 5 consists of nitrogen atoms from the tetradentate ligand MST. The three arms of the ligand coordinate in an equatorial plane around the metal center and the central nitrogen atom binds in one of the axial positions. The second axial position is unoccupied which generates TMP geometry. In addition to the MST ligand, complexes 2, 4, and 6 feature coordination of a water molecule resulting in TBP geometry. Fig. 4 highlights the trigonal monopyramidal and bipyramidal geometries of the inner coordination sphere in complexes 2 and 3. The geometries of the complexes were confirmed using the SHAPE program29,30 which compares the experimental metrical parameters to the perfect geometry, with 0 indicating a perfect match to that geometry. The results are summarized in Table 1, with the trigonal monopyramidal complexes being much closer to the ideal geometry than the trigonal bipyramidal complexes.
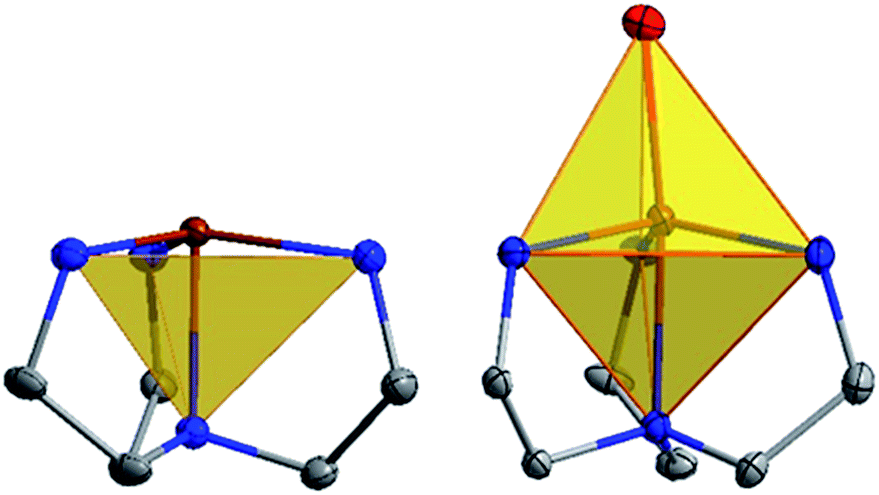 | ||
| Fig. 4 Inner coordination spheres of complexes 3 (left) and 4 (right). Shaded polyhedron emphasize the trigonal monopyramidal and bipyramidal geometries. Atom colors: brown for iron, blue for nitrogen, and grey for carbon. All other atoms have been omitted for clarity. | ||
| [Co(MST)] | [Fe(MST)] | [Ni(MST)] |
| 0.23 | 0.35 | 0.18 |
| [Co(MST)(OH2)] | [Fe(MST)(OH2)] | [Ni(MST)(OH2)] |
| 0.69 | 1.05 | 0.67 |
In each structure, the metal center is above the equatorial plane generated by the 3 coordinating nitrogen atoms, with 5 exhibiting the least distortion at a Ni–Nplane distance of 0.159 Å. The M–Nplane distances in the aquo adducts are ∼0.1 Å further out of plane than their anhydrous counterparts. In each case, there is deviation from the ideal trigonal angle of 120° in the equatorial plane and compounds 2, 4, and 6 have angles between the axial nitrogen and oxygen atoms that are <180°. This bend can be attributed to hydrogen bonding between the water and the sulfonyl oxygen atoms (see Table S2†). Coordination of water results in a lengthening of the M–N bonds in all of the complexes by at least 0.04 Å indicating a decrease in bond strength.
DC magnetic studies
Static DC measurements were performed on complexes 1–6 from 1.8–300 K using a SQUID magnetometer (Fig. 5). The χmT values of 2.45 and 2.57 emu K mol−1 at 300 K for complexes 1 and 2 respectively are higher than 1.87 emu K mol−1, the ideal value for an S = 3/2 system with g = 2. Complexes 3 and 4 exhibit χmT values of 3.19 and 3.92 emu K mol−1, higher than the expected 3.0 emu K mol−1 for an S = 2 system with g = 2. Complexes 5 and 6 follow the same trend with χmT values of 1.55 and 2.19 emu K mol−1, higher than the expected value of 1 emu K mol−1 for an S = 1 system with g = 2. These deviations from ideality reflect spin–orbit coupling. Compounds 1–5 exhibit Curie-like behavior until ∼30 K, after which temperature χmT decreases as expected due to zero-field splitting. Compound 6 exhibits TIP, resulting in a linear increase in χmT at higher temperatures. The anisotropic nature of these complexes is also supported by the M versus H plots at 1.8 K that do not saturate even up to 7 T (Fig. S1–S6†).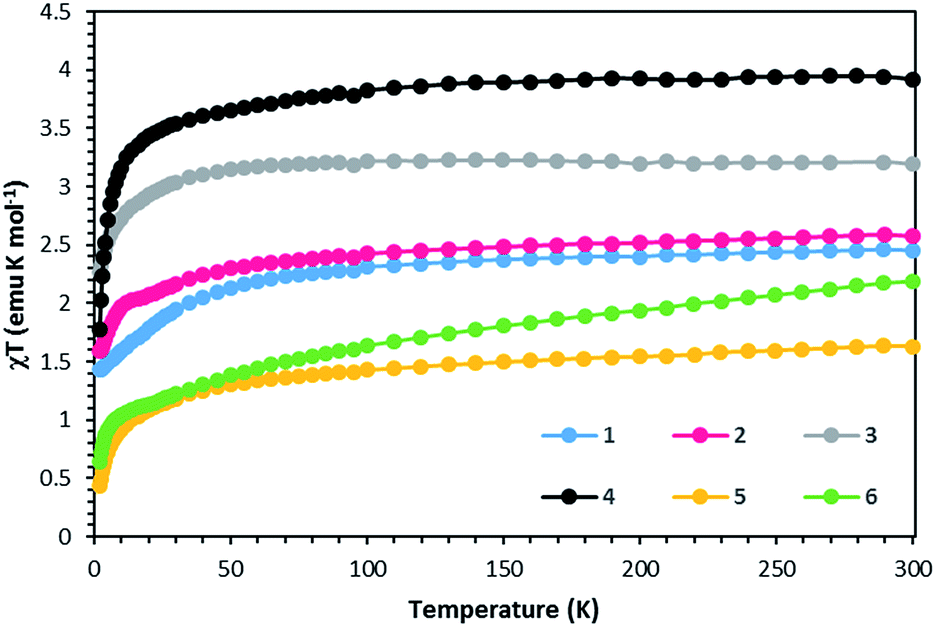 | ||
| Fig. 5 χT vs. T data for compounds 1–6 under a 1000 Oe DC field. Solid lines are guides for the eye. | ||
Reduced magnetization data were measured between 1.8 and 4 K and fit with the PHI program31 (Fig. S7–S17†). The results are summarized in Table 2, along with ab initio CASSCF and NEVPT2 calculation results. In each case, the experimental fittings lead to a smaller D value for the water containing complexes versus the anhydrous complexes. These findings are in accord with the longer M–N bond distances in the water complexes as well as the greater geometric distortion in the trigonal bipyramidal complexes. If one compares these results to the predictions in the paper of Ruiz et al.,22 they are in good agreement except for 4. In this case, a negative D value was predicted on the basis of electron count and geometry, but a small, positive D value was observed. In order to rationalize the observed zero field splitting parameters for complexes 1–6 and to probe the change in D values among the two geometries, we performed ab initio CASSCF and NEVPT2 calculations (see computational details in the ESI†).
| [Co(MST)] | [Co(MST)(OH2)] | [Fe(MST)] | [Fe(MST)(OH2)] | [Ni(MST)] | [Ni(MST)(OH2)] | ||
|---|---|---|---|---|---|---|---|
| PHI | g | 2.24 | 2.40 | 2.19 | 2.37 | 2.67 | 2.81 |
| D | 33 | 24 | −31 | 8.7 | −276 | −209 | |
| |E| | 0.2 | 0.001 | 4.7 | 2.4 | 2.1 | 1.8 | |
| CASSCF | g | 2.24 | 2.25 | 2.09 | 2.10 | 2.48 | 2.51 |
| D | 37.8 | 25.4 | −30.1 | 6.6 | −434.1 | −185.7 | |
| E | 0.7 | 0.1 | 0.15 | 0.23 | 0.6 | 0.007 | |
| NEVPT2 | g | 2.17 | 2.18 | 2.10 | 2.08 | 2.44 | 2.41 |
| D | 30.4 | 20.7 | −28.6 | 6.0 | −428.9 | −131.3 | |
| E | 0.6 | 0.05 | 0.16 | 0.14 | 0.001 | 0.007 |
The computed D, E and giso values using CASSCF and NEVPT2 methods are listed in Table 2. The CASSCF calculations follow the experimentally observed trend of the trigonal monopyramidal complexes 1, 3, and 5, namely higher magnitudes for the D value compared to the water coordinated complexes 2, 4, and 6. The transverse ZFS parameters (E) are close to zero, as expected for complexes with trigonal symmetry. The experimental giso and E values are universally higher than predicted by the computations, but still in agreement. The reduced magnetization data were simulated based on these calculations (Fig. S8–S18†). The deviation of the experimental data from computational data is expected given the increase in giso and transverse ZFS parameters.
In order to further assess the effect of water coordination on the magnetic behavior, the orientation of the Dxx, Dyy, and Dzz axes were computed for complexes 1–6, Fig. 6 and S19.† In the trigonal monopyramidal complexes 1, 3 and 5, the Dzz axis passes through the C3 axis of symmetry of the molecule along the MII–Naxial bonds. When the water molecule is coordinated in the other axial position, the Dzz axis deviates from the C3 axis of symmetry, explaining the significant reduction in the magnitude of the D values.
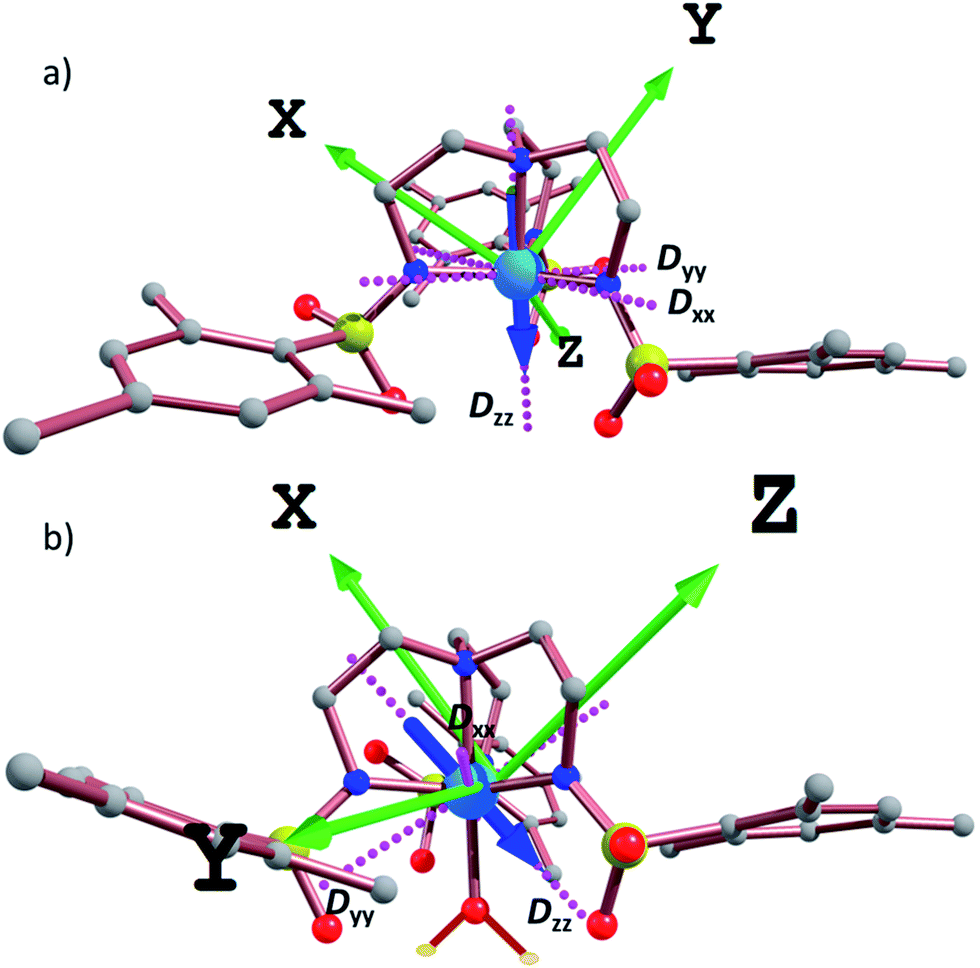 | ||
| Fig. 6 CASSCF computed Dxx, Dyy, and Dzz axes (pink dotted lines) for (a) 1 and (b) 2. The blue arrow emphasizes the direction and orientation of the Dzz axis. Green arrows indicate the molecule orientation axes. | ||
The CASSCF computed D values were validated by inclusion of dynamic correlations using the NEVPT2 method, which resulted in reduced D values. The dynamic correlation stabilizes the ground state, rather than the excited states, increasing the energy gap between orbitals resulting in lower D values. NEVPT2 computed D, E and g values follow the same trend as the CASSCF computed values, which offers additional support to the results.
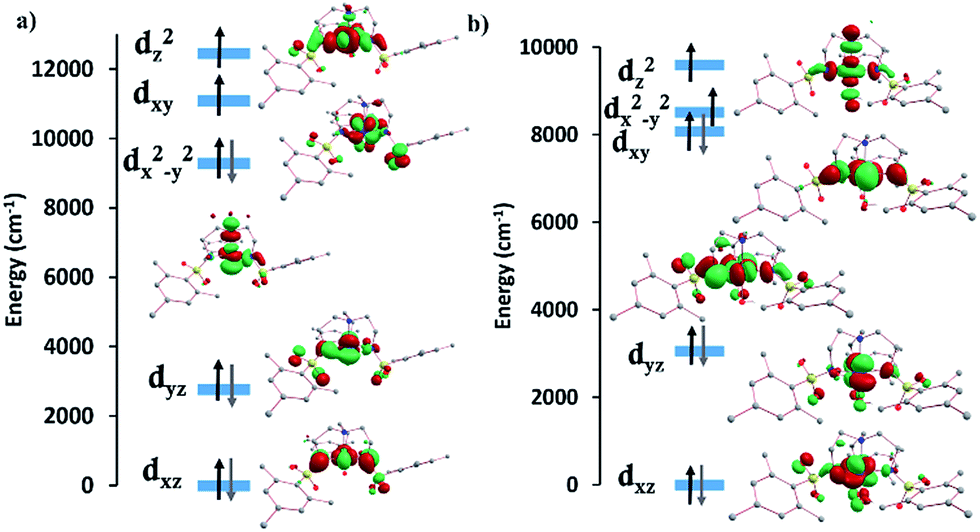
The computed crystal splitting of the d orbitals for complexes 1 and 2 (Fig. S26†) indicate that the first excitation should involve the dyz and dx2−y2/dxy orbitals with different |±ml| levels, resulting in the observed positive D value. In the case of 1, the energy gap between the ground and the first and second excited quartet states are relatively large (∼4800 cm−1), contributing the most to the total D value, whereas the other excited states only marginally affect the D value. In the case of 2, the third and fourth excited states contribute the most to the positive D value. A small, negative contribution from the first excited state is due to a decrease in energy gap between the ground and first excited state (∼3380 cm−1), attributed to the presence of a water molecule in the axial position. This small negative contribution is not sufficient to offset the total positive D value. The experimental D values of 33 cm−1 for 1 and 24 cm−1 for 2 are in agreement with the calculations, falling in between the CASSCF and NEVPT2 values of 37.8 and 30.4 cm−1, and 25.4 and 20.7 cm−1 respectively. These results lend credence to the ability of the calculated orbitals and excitations to accurately model the magnetic behavior of these systems. Moreover, a positive rather than negative D value resulted in better fits of the experimental data and was in agreement with the calculations for 1 and 2.
The d-orbital splittings for the FeII ion in complexes 3 and 4 are shown in Fig. S27.† In 3, the first excitation between the dxz and dyz levels (same |±ml| value) leads to the largest negative contribution to D (−36.0 cm−1) due to the low-lying first excited state (∼870 cm−1). The other three excitations cause a small positive contribution on D, resulting in a slightly smaller negative D value. For compound 4, both CASSCF and NEVPT2 calculations predict that the first excitation occurs unusually between the dxz and dxy levels (different |±ml| values) rather than dxz and dyz levels (same |±ml| values) resulting in a positive contribution to D. The magnitude of D decreases due to an increase in the first excited state energy (∼1300 cm−1). A small negative contribution to D from the second excitation (between the dxz and dyz levels) and positive D contributions from the third and fourth excitations lead to the overall positive D value for this compound. The fitted D values of −31 cm−1 for 3 and 8.7 cm−1 for 4 are slightly higher than the CASSCF and NEVPT2 values of −30.1 and −28.6 cm−1, and 6.6 and 6.0 cm−1 respectively. A positive D value results in a better fit of the experimental data for 4 which is in line with the calculations.
The d-orbital splitting for complexes 5 and 6 are depicted in Fig. 7. The enormous magnitude of D for both complexes arises from three predominant spin-conserved triplet excitations.32 Both the CASSCF and NEVPT2 methods predict that the first spin-free excitation between the dx2−y2 and dxy orbitals is lowest in energy for NiII complexes 5 and 6. A relatively large negative contribution to the D value from this excited state leads to a giant ZFS for these two complexes (Table 3). For 5, a very low-lying first excited state (below 80 cm−1) causes the largest negative contribution to D of −530 cm−1. The other excited states are much higher in energy from the ground state (above 5500 cm−1), resulting in a small positive contribution to D. Overall, this situation leads to a giant negative D value for compound 5. In the case of complex 6, the first excited state (∼250 cm−1) is approximately three times higher in energy than that of complex 5, thereby reducing the magnitude of D. As is the case for 5, the next three excited states are much higher in energy (above 6400 cm−1) and result in relatively small positive contributions to the D value. Although smaller than the corresponding value for 5, 6 still displays an unusually large axial ZFS parameter. The fitted value of D for 6 of −209 cm−1 is slightly higher than the calculated D values of −185.7 and −131.3 cm−1. The biggest discrepancy in all of these fits occurs with 5 which exhibits an experimentally fitted value of −276 cm−1versus the calculated values of −434.1 and −428.9 cm−1. Despite our best efforts to maintain a rigorously anhydrous atmosphere during handling, this complex is extraordinarily hygroscopic and we could not obtain a rigorously dehydrated sample. We attribute the differences in the experimental and calculated values to partial coordination of water, a hypothesis that is supported by an observed visible change from salmon to orange/tan before the sample could be sealed under vacuum. Given the accuracy of the other five complexes in terms of the calculations, we expect the actual D value to be much closer to the computed D values rather than the fitted D value.
 | ||
| Fig. 7 Ab initio computed crystal field splitting for compounds (a) 5 and (b) 6. | ||
| Compound | ES | Energy | D |
|---|---|---|---|
| 5 | First | 77.6 (77.7) | −530.8 (−500.0) |
| Second | 5671.8 (5775.8) | 34.3 (23.6) | |
| Third | 5763.7 (5775.8) | 13.1 (8.3) | |
| Fourth | 5987.5 (6002.5) | 15.4 (11.1) | |
| 6 | First | 244.3 (253.2) | −264.0 (−186.6) |
| Second | 6494.9 (6522.1) | 24.6 (17.2) | |
| Third | 7384.7 (7380.3) | 21.6 (15.3) | |
| Fourth | 9036.9 (9011.6) | 7.1 (4.8) |
AC magnetic studies
Dynamic AC measurements under varying fields were performed on complexes 1–6. No signal was observed for any of the complexes without an applied DC field. As a result, AC measurements under applied DC fields from 400–2000 Oe were measured and complexes 1–3 were found to exhibit slow magnetic relaxation. The field used for further studies was chosen as the one with the most obvious maximum in χ′′ signals at the lowest frequencies. Compound 1 exhibits a maximum around 40 Hz, and its water counterpart exhibits a maximum at a higher frequency of approximately 100 Hz, Fig. 8. Compound 3 displays the lowest frequency maximum at ∼10 Hz. Interestingly, the coordination of water in 4 results in complete quenching of slow magnetic relaxation, with no signals up to 2000 Oe, Fig. 8. Complexes 5 and 6 did not display slow relaxation at 1.8 K under applied fields up to 2000 Oe. Fittings of the Cole–Cole plots for 1–3 were performed to extract Ueff, τ, and α parameters based on a modified Debye function. The resulting Arrhenius plot was fit two ways: namely a barrier was extracted from the linear portion and the full temperature range was fit using eqn (1). To avoid over-parameterization, A was assumed to be 0.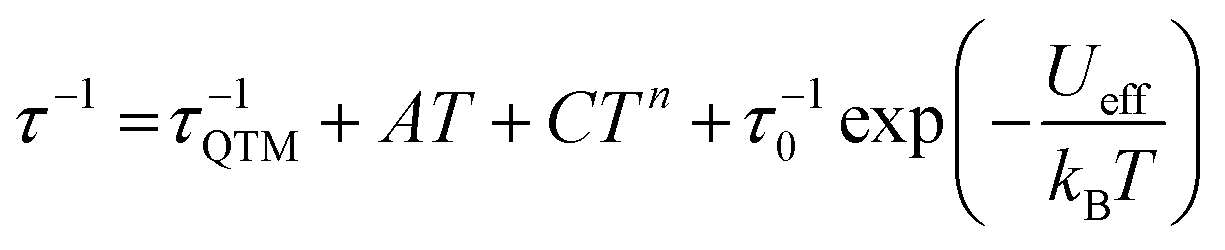 | (1) |
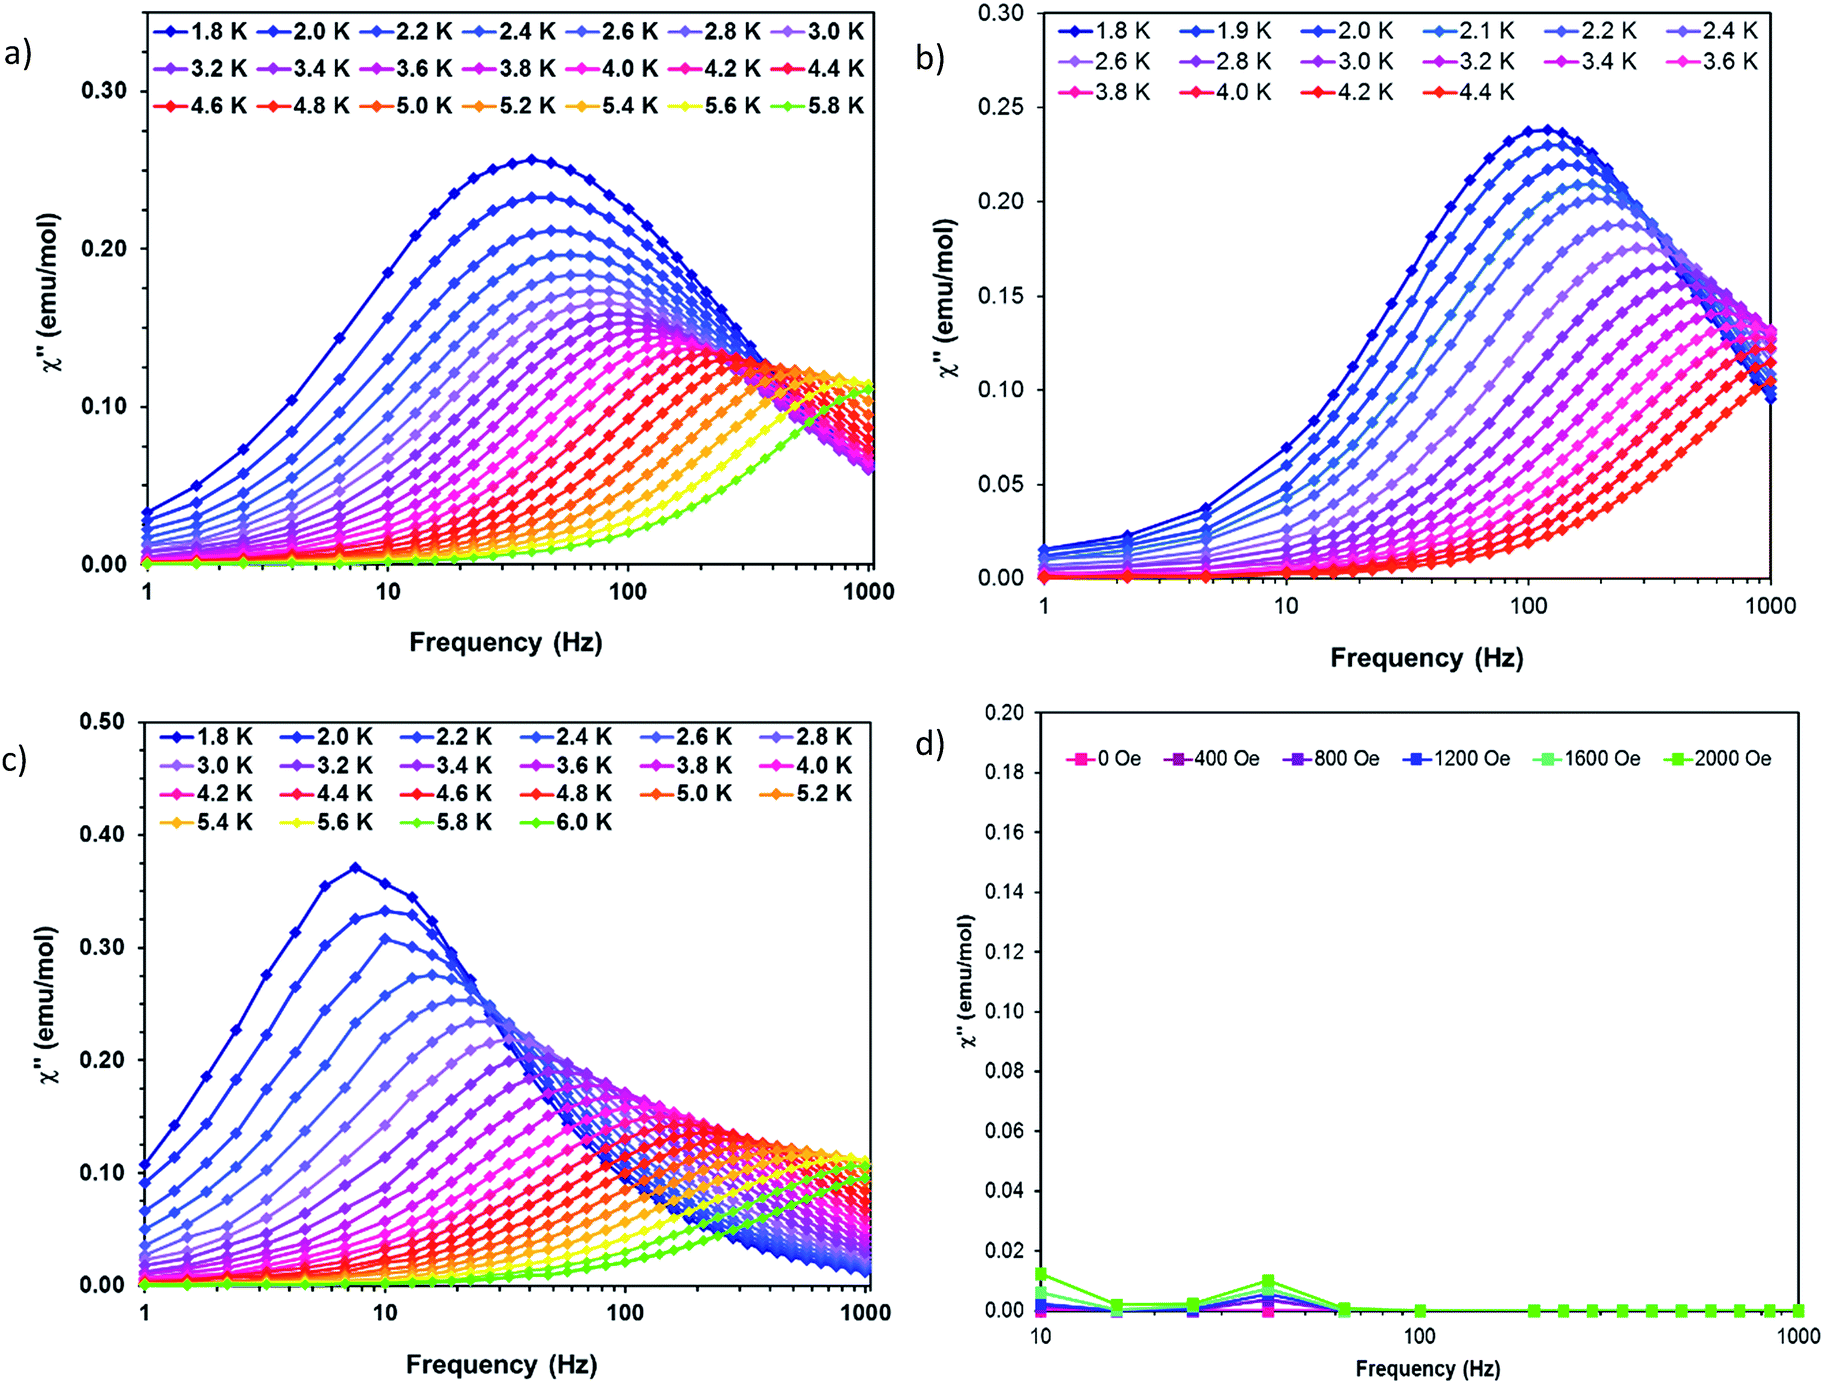 | ||
| Fig. 8 Out of phase susceptibility (χ′′) vs. frequency for (a) 1 (b) 2 (c) 3 and (d) 4. Solid lines are guides for the eye. | ||
Complex 1 was measured under an applied DC field of 1000 Oe. A maximum in χ′′ was observed up to 5.8 K. The low temperature regime is dominated by frequency independent quantum tunneling up to approximately 3 K, after which temperature the thermal regime becomes more prevalent. The data were subsequently fit using CC-fit33 which led to a maximum α value of 0.27, indicating a moderately wide range of relaxations times. A fit of all temperatures in the Arrhenius plot was conducted using eqn (1), Fig. 9, which resulted in a barrier of Ueff/kB = 45 K and τ0 = 3.1 × 10⁻⁹ s. Extracted Raman parameters of C = 0.014 s−1 and n = 7.3 are in agreement with the expected range for a Kramers ion.34 The τ−1 value for quantum tunneling was fit to 0.003 s.
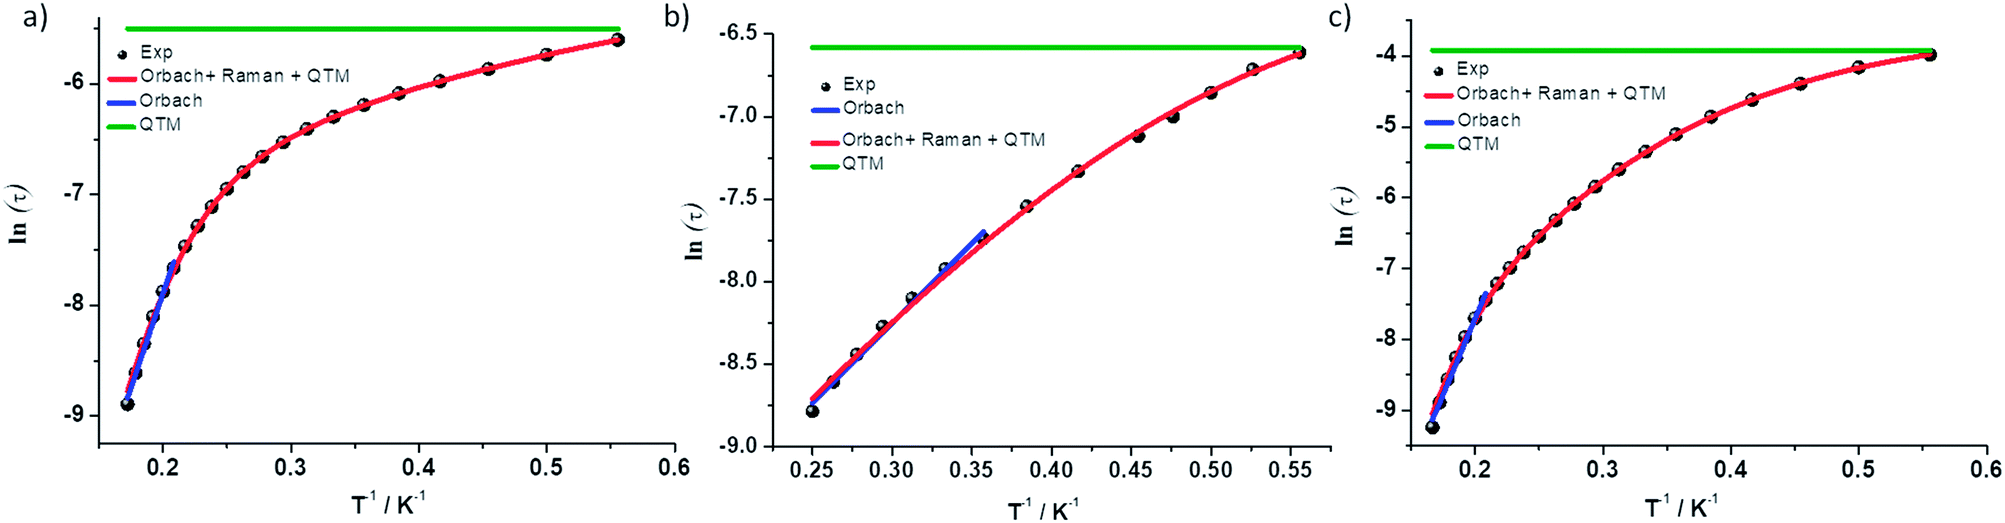 | ||
| Fig. 9 ln(τ) vs. 1/T for complexes (a) 1 (b) 2 and (c) 3. Black dots are experimental data and colored lines are fits as labelled. | ||
The water complex, 2, was also measured under an applied DC field of 1000 Oe. A maximum of χ′′ could be observed up to 3.8 K. Interestingly, the low temperature range is no longer dominated by quantum tunneling, but rather by thermal relaxation. The α values are less than 0.17, indicating a more narrow range of relaxation times compared to 1. A fit of all temperatures in the Arrhenius plot was conducted using eqn (1), Fig. 9, to give Ueff/kB = 9.9 K and τ0 = 1.5 × 10⁻⁵ s. Extracted Raman parameters of C = 0.008 s−1 and n = 7.2 are in agreement with the expected range for a Kramers ion. The τ−1 value for quantum tunneling was fit to be 0.0014 s.
Complex 3 also displays SMM behavior under an applied DC field, with the optimum field being 1200 Oe. A maximum in χ′′ can be observed up to 5.6 K. The α values vary from 0.14 to 0.16, indicating a small range of relaxation times. A fit of all temperatures in the Arrhenius plot was conducted using eqn (1), Fig. 9, resulting in a barrier of Ueff/kB = 63.9 K and τ0 = 1.98 × 10⁻⁸ s. Extracted Raman parameters of C = 1.41 s−1 and n = 4.4 are in agreement with the expected range for a non-Kramers ion. The τ−1 for quantum tunneling is 0.0012 s.
The barriers of both 1 and 2 are lower than expected given the 2|D| energy gaps between the mS 1/2 and mS 3/2 microstates which are 66 and 48 cm−1, respectively. We attribute this situation in 1 to the quantum tunneling and Raman relaxations being large contributors rather than the Orbach process. The same conclusion is reached for complexes 3 and 4, for which the expected barrier height would be 4|D|, or 124 and 34 cm−1 respectively. No slow magnetic relaxation is observed in 5 and 6 due to significant quantum tunneling, although the barrier could be as high as 434 cm−1, given that the energy between the mS = 0 and mS = 1 microstates is |D|. This finding is not entirely unexpected as, to the best of our knowledge, only two divalent nickel complexes exhibiting slow magnetic relaxation have been reported, and a large applied field of 2000 Oe was necessary to observe that behavior.21,35
Structural, magnetic, and computational correlations
Detailed crystallographic, computational, and magnetic studies were undertaken in order to understand the strong variance in magnetic behavior that coordination of a single water molecule exerts on trigonal monopyramidal complexes. Generally, the original species all exhibit slow magnetic relaxation at higher temperatures with higher D values than their trigonal bipyramidal water adducts.Comparisons of crystal structures revealed a few trends across the 3 pairs of compounds. The trigonal monopyramidal complexes are all much closer to ideal geometry than their trigonal bipyramidal counterparts. The results of our studies lend credence to the requirement of strict geometric control for superior magnetic behavior. Compounds 1, 3, and 5 exhibit M⋯M separations that are larger than their partners 2, 4, and 6 respectively (Table S3†); the variation across the anhydrous versus water adduct pairs is 0.029, 0.161, and 0.067 for cobalt, iron, and nickel, respectively. These parameters are in accord with the magnetic behaviour, but are unlikely to be a major contributing factor. For example, the distances observed for the cobalt complexes are larger than the ∼8 Å at which dipolar relaxations are expected to be suppressed. Therefore, it appears that the geometric distortions exert greater control over the observed magnetic properties.
The computational results support this hypothesis. In each case, the trigonal monopyramidal geometries exhibit lower excitations than their trigonal bipyramidal pair which follows the observed trend in the AC susceptibility studies. The increased distortion in 2 results in a larger energy gap between the d-orbitals, causing a smaller D value. Computations also explain why no slow relaxation is observed for 4 even under an applied field. In this case, rather than the expected excitation between the dxz and dyz orbitals, the excitation takes place between the dxz and dxy orbitals resulting in a positive D value. The decrease in magnitude and change in sign of D completely quenches slow relaxation.
It must be noted that this work does not imply that TMP geometry is inherently better for SMM behavior than TBP geometry. The TMP complexes are closer to ideal geometry than the TBP complexes across the series, which corresponds to improved magnetic properties. While 1 performs better, to the best of our knowledge, than any of the reported barriers for divalent cobalt trigonal monopyramidal and bipyramidal SMMs, with only 8 complexes available for comparison (6 TBP and 2 TMP), a concrete conclusion cannot be drawn.22–24,36,37 [Co(TPMA)(CH3CN)](BF4)2 (TPMA = tris(2-pyridylmethyl)amine) is the only other TBP compound reported to have a positive D value.24 In both cases, the positive sign of D is largely due to contributions from the third and fourth excited states.
No reports of a divalent iron TBP complex exhibiting slow magnetic relaxation have appeared in the literature and the only TMP complexes prior to this work is the tpaR series by Long, et al.13,14 Compound 3 exhibits a barrier only slightly smaller than these molecules which range from 36 to 93.5 K. In each case, an applied field is necessary to observe slow magnetic relaxation. The shape values for these complexes are all similar to that of 3, with no observable trend between the shape value and barrier height. It is important to note, however, that the only complex with crystallographically imposed trigonal symmetry displays the highest barrier among the previously reported complexes as well as the one in this work. Theoretical analysis of the series by Long et al.13,14 emphasized the importance of σ-donating and withdrawing substituents on the magnetic behavior in that there is a correlation between increased σ donation and an increase in the D value.38 These considerations must also be taken into account.
There is only one reported divalent nickel complex in a trigonal bipyramidal geometry that exhibits slow relaxation, viz., [Ni(MDABCO)2Cl3]ClO4 with a D value of −535 cm−1, which is close to the theoretical maximum of 668 cm−1, given by the one electron spin–orbit coupling parameter for a Ni(II) free ion.21,39 The SHAPE value of 0.13 is much closer to ideal TBP geometry than is 6, which is in agreement with the magnetic behavior. The structure of 5 is much closer to ideal geometry with a shape value of 0.18, which more closely aligns with [Ni(MDABCO)2Cl3]ClO4. Both 5 and 6 exhibit equatorial bond angles deviating from the ideal 120° more so than [Ni(MDABCO)2Cl3]ClO4. The slightly lower D value of −434 cm−1 for 5 and absence of slow magnetic relaxation could possibly be attributed to this slightly greater deviation from ideal geometry. These results are consistent with theoretical calculations and high pressure studies on TBP Ni(II) complexes underscoring the importance of equatorial bond angles as close to 120° as possible for SMM behavior to be observed.40,41
Conclusions
Results of the syntheses and characterization of three pairs of complexes in this work underscore the importance of ideal geometries. A general trend of trigonal monopyramidal geometries performing with SMM behavior that is superior to the trigonal bipyramidal geometries was observed. The drastic effects of a single coordinated water molecule emphasizes the subtle nature of SMM behavior in mononuclear complexes. The new data add valuable information to the growing knowledge base of mononuclear transition metal SMMs. Our future work focuses on directly addressing the effects of different electron donating and withdrawing groups on the magnetic behavior of both trigonal monopyramidal and bipyramidal complexes and the consequence of minor distortions and changes in geometry.Conflicts of interest
There are no conflicts to declare.Acknowledgements
This work was supported by the Department of Energy, Basic Energy Sciences, Material Sciences Division under grant number DE-FG02-02ER45999. We also acknowledge the Robert A. Welch Foundation (A-1449) for financial support.Notes and references
- D. D. Awschalom, M. E. Flatte and N. Samarth, Sci. Am., 2002, 286, 67–73 CrossRef CAS.
- M. Mannini, F. Pineider, P. Sainctavit, C. Danieli, E. Otero, C. Sciancalepore, A. M. Talarico, M.-A. Arrio, A. Cornia, D. Gatteschi and R. Sessoli, Nat. Mater., 2009, 8, 194 CrossRef CAS PubMed.
- L. Bogani and W. Wernsdorfer, Nat. Mater., 2008, 7, 179 CrossRef CAS PubMed.
- J. M. Frost, K. L. M. Harriman and M. Murugesu, Chem. Sci., 2016, 7, 2470–2491 RSC.
- R. Sessoli, D. Gatteschi, A. Caneschi and M. A. Novak, Nature, 1993, 365, 141–143 CrossRef CAS.
- A. M. Ako, I. J. Hewitt, V. Mereacre, R. Clérac, W. Wernsdorfer, C. E. Anson and A. K. Powell, Angew. Chem., 2006, 118, 5048–5051 CrossRef.
- O. Waldmann, Inorg. Chem., 2007, 46, 10035–10037 CrossRef CAS PubMed.
- E. Ruiz, J. Cirera, J. Cano, S. Alvarez, C. Loose and J. Kortus, Chem. Commun., 2008, 1, 52–54 RSC.
- F. Min and T. Ming-Liang, Chem.–Eur. J., 2018, 24, 7574–7594 CrossRef PubMed.
- Y.-C. Chen, J.-L. Liu, L. Ungur, J. Liu, Q.-W. Li, L.-F. Wang, Z.-P. Ni, L. F. Chibotaru, X.-M. Chen and M.-L. Tong, J. Am. Chem. Soc., 2016, 138, 2829–2837 CrossRef CAS PubMed.
- F. S. Guo, B. M. Day, Y. C. Chen, M. L. Tong, A. Mansikkamäki and R. A. Layfield, Angew. Chem., Int. Ed., 2017, 56, 11445–11449 CrossRef CAS PubMed.
- C. A. P. Goodwin, F. Ortu, D. Reta, N. F. Chilton and D. P. Mills, Nature, 2017, 548, 439 CrossRef CAS PubMed.
- D. E. Freedman, W. H. Harman, T. D. Harris, G. J. Long, C. J. Chang and J. R. Long, J. Am. Chem. Soc., 2010, 132, 1224–1225 CrossRef CAS PubMed.
- W. H. Harman, T. D. Harris, D. E. Freedman, H. Fong, A. Chang, J. D. Rinehart, A. Ozarowski, M. T. Sougrati, F. Grandjean, G. J. Long, J. R. Long and C. J. Chang, J. Am. Chem. Soc., 2010, 132, 18115–18126 CrossRef CAS PubMed.
- J. M. Zadrozny, M. Atanasov, A. M. Bryan, C.-Y. Lin, B. D. Rekken, P. P. Power, F. Neese and J. R. Long, Chem. Sci., 2013, 4, 125–138 RSC.
- J. M. Zadrozny, D. J. Xiao, M. Atanasov, G. J. Long, F. Grandjean, F. Neese and J. R. Long, Nat. Chem., 2013, 5, 577 CrossRef CAS PubMed.
- X.-N. Yao, J.-Z. Du, Y.-Q. Zhang, X.-B. Leng, M.-W. Yang, S.-D. Jiang, Z.-X. Wang, Z.-W. Ouyang, L. Deng, B.-W. Wang and S. Gao, J. Am. Chem. Soc., 2017, 139, 373–380 CrossRef CAS PubMed.
- P. E. Kazin, M. A. Zykin, L. A. Trusov, A. A. Eliseev, O. V. Magdysyuk, R. E. Dinnebier, R. K. Kremer, C. Felser and M. Jansen, Chem. Commun., 2017, 53, 5416–5419 RSC.
- P. E. Kazin, M. A. Zykin, W. Schnelle, Y. V. Zubavichus, K. A. Babeshkin, V. A. Tafeenko, C. Felser and M. Jansen, Inorg. Chem., 2017, 56, 1232–1240 CrossRef CAS PubMed.
- Y. Rechkemmer, F. D. Breitgoff, M. van der Meer, M. Atanasov, M. Hakl, M. Orlita, P. Neugebauer, F. Neese, B. Sarkar and J. van Slageren, Nat. Commun., 2016, 7, 10467 CrossRef CAS PubMed.
- K. E. R. Marriott, L. Bhaskaran, C. Wilson, M. Medarde, S. T. Ochsenbein, S. Hill and M. Murrie, Chem. Sci., 2015, 6, 6823–6828 RSC.
- S. Gomez-Coca, E. Cremades, N. Aliaga-Alcalde and E. Ruiz, J. Am. Chem. Soc., 2013, 135, 7010–7018 CrossRef CAS PubMed.
- D. Pinkowicz, F. J. Birk, M. Magott, K. Schulte and K. R. Dunbar, Chem.–Eur. J., 2017, 23, 3548–3552 CrossRef CAS PubMed.
- T. J. Woods, M. F. Ballesteros-Rivas, S. Gómez-Coca, E. Ruiz and K. R. Dunbar, J. Am. Chem. Soc., 2016, 138, 16407–16416 CrossRef CAS PubMed.
- D. C. Lacy, Y. J. Park, J. W. Ziller, J. Yano and A. S. Borovik, J. Am. Chem. Soc., 2012, 134, 17526–17535 CrossRef CAS PubMed.
- Y. J. Park, S. A. Cook, N. S. Sickerman, Y. Sano, J. W. Ziller and A. S. Borovik, Chem. Sci., 2013, 4, 717–726 RSC.
- S. A. Cook, J. W. Ziller and A. S. Borovik, Inorg. Chem., 2014, 53, 11029–11035 CrossRef CAS PubMed.
- N. Lau, J. W. Ziller and A. S. Borovik, Polyhedron, 2015, 85, 777–782 CrossRef CAS PubMed.
- S. Alvarez, P. Alemany, D. Casanova, J. Cirera, M. Llunell and D. Avnir, Coord. Chem. Rev., 2005, 249, 1693–1708 CrossRef CAS.
- M. Llunell, D. Casanova, J. Cirera, P. Alemany and S. Alvarez, Shape, Barcelona, Spain, 2010 Search PubMed.
- N. F. Chilton, CC-FIT Program, The University of Manchester, Manchester, UK, 2014, http://www.nfchilton.com/cc-fit.html Search PubMed.
- S. K. Singh, T. Gupta, P. Badkur and G. Rajaraman, Chem.–Eur. J., 2014, 20, 10305–10313 CrossRef CAS PubMed.
- N. Chilton and C. C. -FIT, Manchester, U.K., 2014, http://www.nfchilton.com/cc-fit.html.
- A. Abragam and B. Bleaney, Electron Paramagnetic Resonance of Transition Ions, University Press, Oxford, 1970 Search PubMed.
- J. Miklovic, D. Valigura, R. Boca and J. Titis, Dalton Trans., 2015, 44, 12484–12487 RSC.
- D. M. Pinero Cruz, D. N. Woodruff, I.-R. Jeon, I. Bhowmick, M. Secu, E. A. Hillard, P. Dechambenoit and R. Clerac, New J. Chem., 2014, 38, 3443–3448 RSC.
- R. Ruamps, L. J. Batchelor, R. Guillot, G. Zakhia, A.-L. Barra, W. Wernsdorfer, N. Guihery and T. Mallah, Chem. Sci., 2014, 5, 3418–3424 RSC.
- M. Atanasov, D. Ganyushin, D. A. Pantazis, K. Sivalingam and F. Neese, Inorg. Chem., 2011, 50, 7460–7477 CrossRef CAS PubMed.
- J. Bendix, M. Brorson and C. E. Schaffer, Inorg. Chem., 1993, 32, 2838–2849 CrossRef CAS.
- M. Gruden-Pavlović, M. Perić, M. Zlatar and P. García-Fernández, Chem. Sci., 2014, 5, 1453–1462 RSC.
- G. A. Craig, A. Sarkar, C. H. Woodall, M. A. Hay, K. E. R. Marriott, K. V. Kamenev, S. A. Moggach, E. K. Brechin, S. Parsons, G. Rajaraman and M. Murrie, Chem. Sci., 2018, 9, 1551–1559 RSC.
Footnote |
| † Electronic supplementary information (ESI) available: Detailed synthetic procedures, crystallographic details, magnetic details, and computational details and methods. CCDC 1851168–1851173. For ESI and crystallographic data in CIF or other electronic format see DOI: 10.1039/c8sc02820f |
| This journal is © The Royal Society of Chemistry 2018 |