
 Open Access Article
 This Open Access Article is licensed under a Creative Commons Attribution-Non Commercial 3.0 Unported Licence
Conformation of intrazeolitic choline ions and the framework topology of zeolite hosts†
Juna
Bae
 and
Suk Bong
Hong
*
and
Suk Bong
Hong
*
Center for Ordered Nanoporous Materials Synthesis, Division of Environmental Science and Engineering, POSTECH, Pohang 37673, Korea. E-mail: sbhong@postech.ac.kr
First published on 20th August 2018
Abstract
The host–guest interactions in as-made zeolites Y, UZM-4, UZM-22, offretite, ferrierite, phillipsite, EU-12 and levyne, all of which were synthesized using choline as an organic structure-directing agent, have been investigated by a combination of different experimental techniques, including Raman, 1H-13C CP MAS NMR and variable-temperature IR spectroscopies, together with theoretical calculations. The conformation of this asymmetric quaternary ammonium cation was shown to differ significantly according to the pore topology of the zeolite host and the intrazeolitic location of the organic guest molecule. Theoretical calculations using the pure-silica zeolite model reveal that among its three representative conformers (i.e., gauche, trans and trans′ forms), the conformer, which was experimentally found to dominantly or exclusively exist in zeolite structures studied, always has a lower interaction energy with the surrounding zeolite framework. Our work provides the first example in which the conformation of organic structure-directing agents plays an important kinetic role in governing the phase selectivity during zeolite nucleation.
Introduction
Since the seminal work by Barrer and Denny in 1961,1 both structural and compositional territories of zeolites and molecular sieves have greatly been expanded by the use of a wide variety of amines and alkylammonium ions as organic structure-directing agents (OSDAs) in their synthesis, with or without the aid of inorganic structure-directing agents (ISDAs) such as alkali metal cations, hydroxide or fluoride anions and heteroatom framework elements.2–5 The molecular size and shape, hydrophobicity/hydrophilicity and rigidity of the OSDAs employed have been known to be the key factors affecting the framework topology and composition of this industrially important class of microporous materials. With the exception of rigid polycyclic species like adamantane, on the other hand, most organic molecules possess a high degree of conformational diversity, which must also be the case of OSDAs at zeolite crystallization temperatures. Because OSDAs usually end up confined in a narrow range of conformations, it is not difficult to conjecture that the zeolite pore architecture can be altered according to the type of their conformations available under synthesis conditions. However, for all its major importance in better understanding the zeolite structure-directing phenomenon, only a few studies have examined the relationship between the conformation of OSDAs, especially of those with moieties longer than the ethyl group, and the crystallized zeolite structure.6–8Although rather simple, the choline ion (Ch+, (2-hydroxyethyl)trimethylammonium) is known to direct the synthesis of at least 12 different structure types of zeolites when used in combination with various alkali metal and/or alkaline earth metal cations.2,9–12 It should be noted that despite the similarity in size, the structure-directing effects of the Ch+ ion are considerably different from those of geometrically similar tetramethylammonium (TMA+) and tetraethyl-ammonium (TEA+) ions, the two most widely studied OSDAs for zeolite syntheses.2 For example, Ch+ gives large-pore zeolites UZM-4 (framework type BPH) and UZM-22 (MEI) in the presence of Li+, Sr2+, or both of them, which have not been previously obtained using TMA+ or TEA+.2,9 There are four internal bonds about which rotation can occur in its backbone (N–C–C–O), allowing this OH group-containing organic cation to have a large number of possible molecular conformations. When only the rotation with respect to the C–C bond is considered, Ch+ can adopt two groups of conformations represented by the gauche and trans forms, in a broad sense. It has been repeatedly shown to exist predominantly as a gauche conformer in the solid, liquid and gas phases, mainly due to the stabilization by non-specific, electrostatic interactions between the electronegative oxygen atom of the OH group and the positive charge distributed over the ammonium head [(CH3)3N+CH2] group.13–17
As shown in Fig. 1, on the other hand, the OH group in the trans form can be oriented in two directions without causing severe steric hindrance with the ammonium head group, unlike the gauche conformer. According to the theoretical work by Ashworth et al.,17 these two groups of Ch+ conformations, which have been tentatively designated as trans and trans′ forms in the present study, are higher in energy by 18 and 23 kJ mol−1 than gauche Ch+ in the gas phase. Clearly, a solid understanding of the host–guest interactions in zeolites containing OSDAs as guest molecules, which has long been one of our main research interests,6,18,19 is the first step in controlling the phase selectivity of crystallization. With this in mind, we have investigated such interactions occurring within a series of as-made zeolites with different framework topologies (i.e., Y (FAU), UZM-4, UZM-22, offretite (OFF), ferrierite (FER), phillipsite (PHI), EU-12 (ETL) and levyne (LEV)) synthesized using Ch+ as an OSDA. Here we present their Raman, 1H-13C CP MAS NMR and variable-temperature IR spectra in order to check whether the conformation of OSDAs is closely related to the structure type of the crystallized zeolite host. The experimental results are correlated with the relative energies of three representative Ch+ conformers in each zeolite, as well as their total stabilization energies, that have been calculated using the mixed quantum-mechanical and semi-empirical ONIOM method.
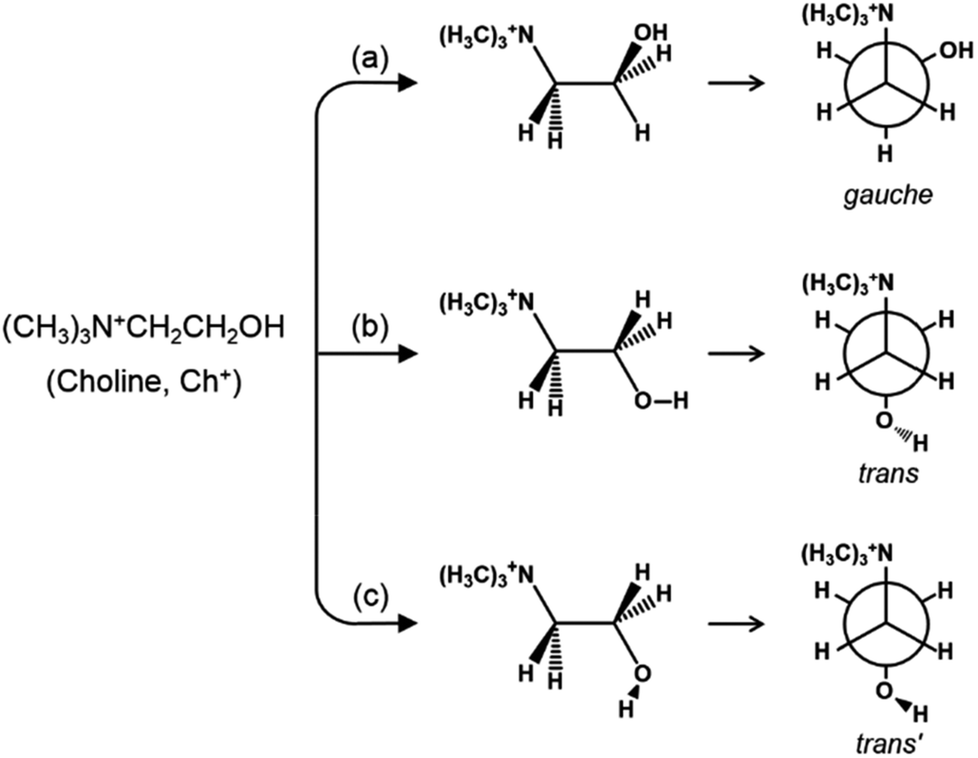 | ||
| Fig. 1 The structures and Newman projections of the three representative groups of Ch+ conformations: (a) gauche, (b) trans and (c) trans′ conformers. | ||
Experimental section
Zeolite synthesis
The reagents used included the chloride or hydroxide of Li+, Na+, K+ and Rb+, as well as of Ch+, strontium nitrate (Sr(NO3)2, 99%, Aldrich), aluminum hydroxide (Al(OH)3·1.0H2O, Aldrich) and colloidal silica (Ludox AS-40, Aldrich). In the case of the synthesis of Y, UZM-4, UZM-22, offretite and ferrierite, Ch+-containing aluminosilicate gels were heated overnight at 95 °C prior to adding alkali or alkali earth metal cations. After being stirred at room temperature for 1 day, the final synthesis mixture was charged into Teflon-lined 23 mL autoclaves and heated under rotation (60 rpm) at 100–150 °C for 7 or 14 days. The synthesis conditions for zeolites studied here are summarized in Table S1, ESI.† Levyne was synthesized via the so-called interzeolite conversion method under static conditions, where H–Y with Si/Al = 15 (Zeolyst) was used as both Al and Si sources.12The solid products were recovered by filtration or centrifugation, washed repeatedly with distilled water and dried overnight at room temperature. To check whether the Ch+ ions occluded in each zeolite product could be ion-exchanged, as-made zeolites were exchanged up to seven times in 2.0 M KNO3 solutions (1 g solid per 100 mL solution) at 80 °C for 8 h. Also, Na–Y with Si/Al = 2.6 (Tosoh) was exchanged four times in 1.0 M ChCl solutions (1 g solid per 100 mL solution) at 80 °C for 8 h. Here we refer to the repeatedly K+ ion-exchanged as-made Y and Ch+ ion-exchanged Na–Y as K–Y and Ch–Y, respectively.
Analytical methods
Powder X-ray diffraction (XRD) patterns were recorded on a PANalytical X'Pert diffractometer (Cu Kα radiation) with an X'Celerator detector. Elemental analysis was performed on a Jarrell-Ash Polyscan 61E inductively coupled plasma spectrometer in combination with a Perkin-Elmer 5000 atomic absorption spectrophotometer. The C, H and N contents of the samples were determined using a Vario EL III elemental organic analyzer. Thermogravimetric analyses (TGA) were carried out on an SII EXSTAR 6000 thermal analyzer, where the weight losses related to the combustion of OSDAs were further confirmed by differential thermal analyses (DTA) using the same analyzer. The crystal morphology and average size were determined using a JEOL JSM-6510 scanning electron microscope (SEM).The 1H-13C CP MAS NMR spectra were recorded on a Varian Inova 300 spectrometer at a spinning rate of 6.0 kHz and a 13C frequency of 75.428 MHz with a π/2 rad pulse length of 7.0 μs, a contact time of 2.5 ms, a recycle delay of 3.0 s and an acquisition of ca. 5000 pulse transients. The 1H MAS NMR spectra were recorded on the same spectrometer at a 1H frequency of 299.945 MHz with a π/2 rad pulse length of 3.0 μs, a recycle delay of 2.0 s and an acquisition of ca. 100 pulse transients. The 13C and 1H chemical shifts are reported relative to TMS.
The variable-temperature IR spectra in the CH and OH stretching regions of the occluded Ch+ ions were measured on a Nicolet 6700 FT-IR spectrometer using self-supporting zeolite wafers of approximately 13 mg (1.3 cm diameter). Prior to IR experiments, the zeolite wafers were dehydrated under vacuum (10−4 Pa) at 180 or 200 °C for 6 h inside a home-built IR cell with CaF2 windows. Then, the IR spectra were recorded under vacuum from room temperature to 450 °C at a temperature interval of 50 °C. Typically, 256 scans were accumulated. The Raman spectra were measured at room temperature on a Bruker FRA106/S FT-Raman spectrometer equipped with a Nd:YAG laser operating at 1064 nm. A 5 mm NMR tube was used as the sample holder for both the solid powder and aqueous ChCl solution. The sample was exposed to a laser power of 100–250 mW at a spectral resolution of 2 cm−1. Typically, ca. 2000 scans were accumulated. Gaussian curve-fitting of the Raman spectra obtained was performed using the PeakFit curve-fitting program to determine the percentage ratio between the gauche and trans Ch+ conformers in each sample by comparing the intensity of the Raman band at 710–715 cm−1 with that of the bands at 750–780 cm−1 (Fig. S1, ESI†).
Computational methods
The 48T and 96T cluster models were extracted from the crystallographic data on zeolite Y, which are available from the Structure Commission of the International Zeolite Association (IZA-SC),20 and employed to calculate the relative energies of gauche, trans and trans′ Ch+ conformers embedded in the 14-hedral ([4668]) sod cage and 26-hedral ([41864124]) supercage, respectively. The same energy calculations were also performed on these three conformers in the 78T ferrierite channel intersection, 76T ferrierite 16-hedral ([586682]) fer cage, 64T phillipsite, 88T EU-12 and 60T levyne models derived from the IZA-SC database. All zeolite models were treated as pure-silica frameworks so that the electrostatic (coulombic) interactions between the OSDA and the zeolite framework were not included in the calculations. OSDAs were fixed in their specified conformations and allowed to settle to their most energetically favorable positions. The terminal Si atoms at all cluster edges were capped with H atoms at a Si–H bond distance of 1.47 Å oriented along the direction of the corresponding Si–O bond.The ONIOM (ωB97XD/6-31G(d,p):MNDO) method was applied to optimize the geometries of OSDA molecules within various zeolite structures using the Gaussian 09 program package.21 During the geometric optimization, the 24, 48, 20, 20, 24, 24 and 30 tetrahedral atoms (T-atoms) surrounding each Ch+ conformer within the Y sod cage, Y supercage, ferrierite channel intersection, ferrierite fer cage, phillipsite, EU-12 and levyne, respectively, as well as Ch+ conformer itself, were treated at the high ωB97XD level. The rest of the T-atoms in each theoretical model were treated at the low MNDO level, while being kept fixed at their crystallographic locations. To maintain the specific conformation (i.e., the gauche, trans, or trans′ form) of Ch+, the N–C–C–O and C–C–O–H dihedral angles were constrained to 60 and 180°, 180 and 180° and 180 and 90°, respectively. The single-point energy calculations were further refined at the ωB97XD/6-31G(d,p) level using the optimized structures.
For a given Ch+ conformer in a given ZEO framework, the relative energy to its gauche conformer is defined as
| Erel = EOSDA/ZEO − Egauche/ZEO | (1) |
| Edef = ΔEdef(ZEO) + ΔEdef(OSDA) | (2) |
| ΔEtot = Edef + ΔEint | (3) |
| ΔEint = EOSDA/ZEO − Ec(ZEO) − Ec(OSDA) | (4) |
| ΔEdef(ZEO) = Ec(ZEO) − E(ZEO) | (5) |
| ΔEdef(OSDA) = Ec(OSDA) − E(OSDA) | (6) |
Results and discussion
Comparison of the powder XRD patterns of the eight zeolites with different framework topologies synthesized using Ch+ as an OSDA with those in the literature20 shows that all of them are phase pure (Fig. S2, ESI†). As previously reported,10 however, the XRD pattern of ferrierite was fairly broader than that of the typical corresponding zeolite, mainly due to its nanocrystallinity, which may also be the case for offretite (Fig. S3, ESI†). The chemical composition data in Table 1 indicate that the C/N ratio of occluded organic species is always close to that (5) of Ch+ ions. This suggests that most of them remain intact upon encapsulation into the pores of zeolites synthesized here. From TGA/DTA experiments, no noticeable decrease in organic content was observed for small-pore (phillipsite, EU-12 and levyne) and medium-pore (ferrierite) zeolites, even after repeated K+ ion exchange. As shown in Fig. S4 (ESI†), however, there is a significant decrease in organic content for all large-pore zeolites (Y, UZM-4, UZM-22 and offretite). It thus appears that the kinetic diameter of Ch+ ions may be between 5.4 Å, the longest dimension of elliptical 10-ring channels in ferrierite and 6.3 Å, the diameter of 12-ring channels in UZM-4, which is the smallest among the four large-pore zeolites studied.20| Zeolite | % N | % C | % H | % ∑a | C/N | Unit cell compositionb | Si/Al | Crystal shape and sizec (μm) | % gauche Ch+d |
|---|---|---|---|---|---|---|---|---|---|
| a The total organic contents in wt%. The values given in parentheses are the exothermic weight losses by TGA/DTA at 200–800 °C for Y and at 250–800 °C for the other zeolites. b H+ or OH− has been introduced to make the as-made zeolites electrically neutral. The water content was calculated from the endothermic weight loss by TGA/DTA up to 200 °C for Y and to 250 °C for the other zeolites (Fig. S7, ESI). c Determined by SEM. d The percentage of the gauche conformer of Ch+ ions in each zeolite was determined by dividing the area of its Raman band appearing at 713–715 cm−1 by the areas of the Raman band at 750–772 cm−1 due to the trans conformer and of the band at 713–715 cm−1 (Fig. 2). | |||||||||
| ChCl salt | 100 | ||||||||
| ChCl in H2O | 85 | ||||||||
| Y | 2.22 | 9.54 | 3.40 | 15.16 (17.3) | 4.97 | |Ch25.4Na34.8H4.5(H2O)117.6| [Al64.7Si127.3O384] | 2.0 | Polyhedrons, 1.0 × 1.5 | 81 |
| K–Y | 0.22 | 0.96 | 0.18 | 1.36 (1.77) | 5.09 | |Ch3.0Na2.2K56.7H2.7(H2O)204.0| [Al64.7Si127.3O384] | 2.0 | Polyhedrons, 1.0 × 1.5 | 0 |
| Ch–Y | 1.46 | 6.35 | 2.25 | 10.06 (13.3) | 5.07 | |Ch21.1Na34.3OH0.66(H2O)116.5| [Al54.8Si137.2O384] | 2.6 | Polyhedrons, 0.7 × 1.0 | 100 |
| UZM-4 | 2.25 | 9.76 | 3.81 | 15.82 (20.0) | 5.01 | |Ch4.5Li1.2Na1.9OH0.6(H2O)13.1| [Al7.0Si21.0O56] | 3.0 | Spheres, 0.02 | 93 |
| UZM-22 | 3.10 | 13.51 | 3.51 | 20.12 (24.0) | 5.05 | |Ch5.4Li0.1Sr0.3OH0.3(H2O)6.1| [Al5.9Si28.1O68] | 4.8 | Grains, 0.1 × 0.2 | 90 |
| Offretite | 2.43 | 10.52 | 3.39 | 16.34 (17.8) | 5.01 | |Ch2.0K0.6Sr0.5OH0.3(H2O)5.0| [Al3.8Si14.1O36] | 3.7 | Spheres, 0.05 | 92 |
| Ferrierite | 2.30 | 9.83 | 2.48 | 14.61 (16.2) | 4.94 | |Ch3.0Na0.6OH0.3(H2O)5.3| [Al3.3Si32.7O72] | 9.9 | Needles, 0.01 × 0.1 | 13 |
| Phillipsite | 1.09 | 3.97 | 1.83 | 6.89 (6.64) | 4.24 | |Ch1.7Na0.1Rb4.0OH0.2(H2O)11.4| [Al5.5Si26.5O64] | 4.8 | Rhombohedrons, 3.0 | 0 |
| EU-12 | 1.08 | 4.48 | 1.51 | 7.08 (7.67) | 4.82 | |Ch3.9Na0.2Rb4.7OH1.6(H2O)8.4| [Al7.2Si64.8O144] | 9.0 | Needles, 0.1 × 1.0 | 0 |
| Levyne | 2.23 | 9.62 | 2.89 | 14.74 (17.3) | 4.99 | |Ch6.1Na1.9OH2.3(H2O)12.5| [Al5.7Si48.3O108] | 8.5 | Circular platelets, 0.2 × 0.3 | 100 |
Fig. 2 shows the Raman spectra in the 600–3100 cm−1 region of Y, K–Y, Ch–Y, UZM-4, UZM-22, offretite, ferrierite, phillipsite, EU-12 and levyne, all of which contain Ch+ as a guest molecule. Akutsu was the first to recognize that the symmetric stretching vibration of four C–N bonds in Ch+ could be related to the N–C–C–O dihedral angle in this organic cation from the comparison of the Raman spectra of a series of Ch+ ions selectively deuterated at different positions.22 He was able to assign two Raman band appearing around 720 and 770 cm−1 to the symmetric C–N stretching mode (νs(C–N)) of gauche and trans Ch+ conformers, respectively, based on the crystallographically determined conformations of various Ch+-containing salts. The spectrum of ChCl in aqueous solution, which exhibits a weak band at 765 cm−1 due to the νs(C–N) mode of trans Ch+, together with a much stronger band at 715 cm−1 assigned to the same vibration mode of gauche Ch+,22,23 is also compared in Fig. 2. It can be seen that the relative intensities of the C–H stretching bands at 2800–3100 cm−1 and the CH2 bending band around 1450 cm−1, as well as the νs(C–N) and νas(C–N) bands at 850–960 cm−1, in the spectra of these eight zeolites are generally similar to one another, whereas the opposite holds for the νs(C–N) bands appearing at 713–715 cm−1 and 750–772 cm−1. This indicates that the Ch+ ions exist intact within the void space of each material, but the intrazeolitic distribution of gauche and trans conformers varies notably with the zeolite pore structure.
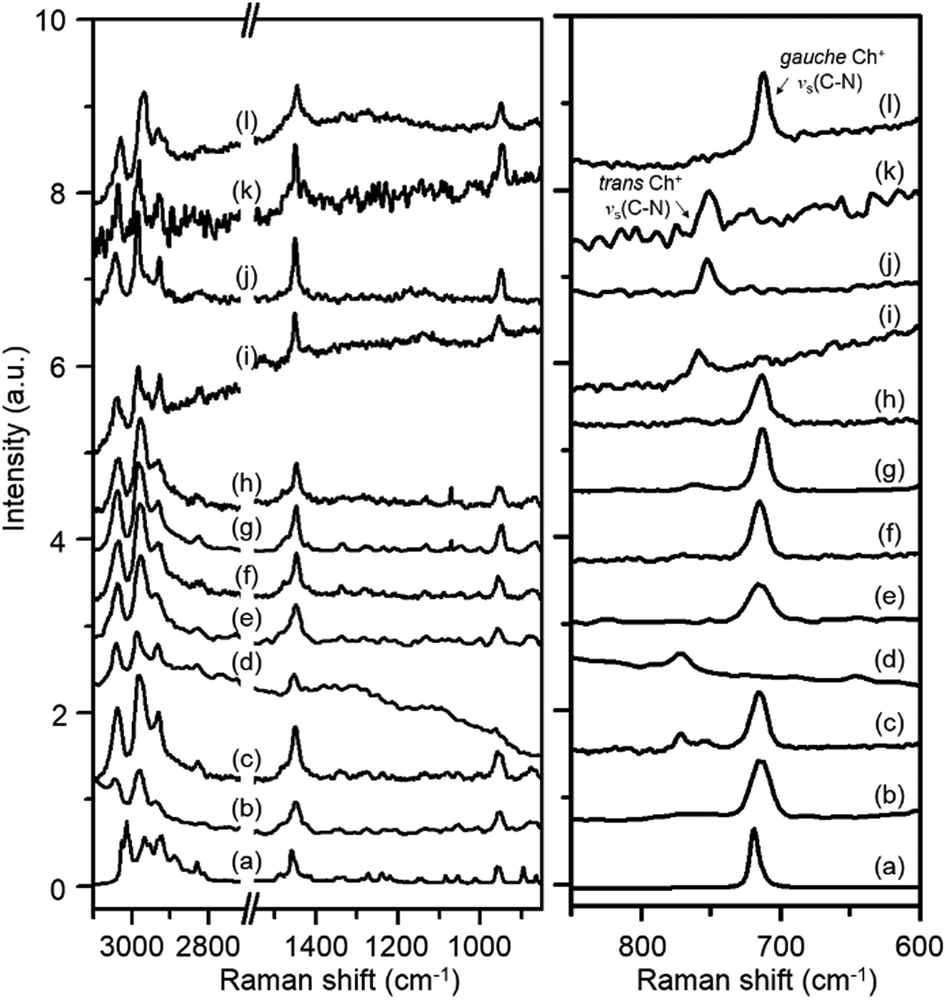 | ||
| Fig. 2 Raman spectra of ChCl in (a) solid and (b) 0.5 M aqueous solution states, and as-made (c) Y, (d) K–Y, (e) Ch–Y, (f) UZM-4, (g) UZM-22, (h) offretite, (i) ferrierite, (j) phillipsite, (k) EU-12 and (l) levyne prepared using Ch+ as an OSDA. | ||
Table 1 lists the gauche conformer percentages of Ch+ ions in the series of as-made zeolites with different framework structures determined by comparing the integrated intensities of their νs(C–N) bands. Like the case of ChCl in aqueous solution, the majority, but not all, of OSDAs in Y, UZM-4, UZM-22 and offretite were found to have a gauche conformation. It is worth noting that the Raman spectrum of Y gives two weak bands at 754 and 772 cm−1, as well as one stronger band at 715 cm−1, showing the existence of two environments for trans Ch+. An unexpected finding is that the Raman spectrum of levyne shows the most prominent Raman band at 713 cm−1 from gauche Ch+, with no detectable bands in the region higher than 750 cm−1 (Fig. 2), although its 17-hedral ([496583]) lev cage is considerably smaller than the 26-hedral ([41864124]) supercage in Y. From elemental analysis, each lev cage in as-made levyne was calculated to contain one Ch+ ion on average (Table 1). Clearly, the crystallographic dimensions (8.0 × 8.0 × 7.0 Å) of this cage20 would be large enough to accommodate one Ch+ ion with little hindrance, but not two cations. Given its 8-ring window size (3.6 × 4.8 Å), therefore, it is not difficult to conclude that the Ch+ ions in levyne are entirely isolated from one another and thus exist as the more stable gauche conformer.
The most interesting observation from Table 1 and Fig. 2 is that when as-made Y was repeatedly exchanged in 2.0 M KNO3 solutions, the resulting solid (i.e., K–Y) shows only one small νs(C–N) band at 772 cm−1: the two bands at 715 and 754 cm−1 are not observed anymore. This clearly shows that the remaining Ch+ ions in K–Y are located within non-exchangeable sites (i.e., 14-hedral ([4668]) sod cages) and are present only as a trans conformer. From comparison with the Raman spectrum of the parent Y zeolite, we were also aware that a non-negligible part (11%) of OSDA molecules within the large supercages in as-made Y, which can be easily removed by K+ ion exchange, exists as a trans conformer. However, the Raman spectrum of Ch–Y, where an average of ca. 2.6 Ch+ ions were exchanged into its supercages (according to TGA/DTA analysis), with no organic cations within the sod cages, exhibits only one strong νs(C–N) band at 715 cm−1, indicating the absence of any trans Ch+. Therefore, the guest–guest interactions within the supercages in the parent Y appear to be considerably different from those in Ch–Y. It is interesting to note here that the νs(C–N) band position (754 cm−1) of trans Ch+ within the supercages is lower by ca. 20 cm−1 than that (772 cm−1) of trans Ch+ within the much smaller sod cages. This led us to conclude that the νs(C–N) band position of Ch+ is highly sensitive to the size of the zeolite cage within which the cation is located, as well as to the type of its molecular conformation.
One may speculate that Ch+ is too large to be accommodated within the sod cages of zeolite Y without causing severe geometric constraints. If this is the case, then the reason K–Y shows a νs(C–N) band at 772 cm−1 would be a result of the presence of TMA+ within the sod cages that could be produced by Ch+ decomposition during the synthesis of this cage-based large-pore zeolite. In fact, the Raman spectrum of Y crystallized using TMA+ as an OSDA is reported to exhibit a νs(C–N) band at essentially the same position (773 cm−1).24 However, since the crystallization temperature (115 °C) of our Y is lower than the decomposition temperature (ca. 135 °C) of Ch+,12 it is most likely that the occluded species within its sod cages is not TMA+ but Ch+. Further evidence for this will be given below. On the other hand, the majority (87%) of organic cations in ferrierite are characterized by a trans conformation. As shown in Fig. 2, however, there is only one νs(C–N) band around 750 cm−1 in the Raman spectra of phillipsite and EU-12, implying the sole presence of trans Ch+ ions. This can be rationalized by considering the narrow feature of their 8-ring channels, in contrast to our recent study on the structure of as-made EU-12:11 it is still not easy to accurately determine the conformation of flexible OSDAs like Ch+ in zeolites using the Rietveld refinement of powder XRD data.
The 1H-13C CP MAS NMR spectra of the eight zeolites synthesized using Ch+ and K–Y, together with the liquid 13C NMR spectrum in D2O solution of ChCl, can be found in Fig. S5 (ESI†). Differences in the number and relative intensity of the observed 13C resonances reveal that Ch+ experiences a chemical environment that is different in each zeolite. It is also remarkable that the resonance of the methylene carbon bonded to the nitrogen in this asymmetric guest species appearing at 67–69 ppm is very weak or hardly detectable in the spectra of K–Y, phillipsite and EU-12. Recall that all Ch+ ions occluded in these three zeolites adopt a trans conformation as evidenced by Raman results (Fig. 2). However, the methylene carbon resonance was found to be clearly visible in the 1H-13C CP MAS NMR spectra of zeolites with high percentages of gauche Ch+ and, particularly, of levyne where the OSDA molecules are all in the gauche conformation (Table 1). Therefore, one may speculate that the methylene carbon in trans Ch+ is less mobile than that in gauche Ch+, because the intrazeolitic environments of the former conformer, such as sod cages and EU-12 8-ring channels, are spatially highly restricted. However, this situation should also be the case of the other two types of carbon atoms (i.e., the methyl carbons and the methylene carbon bonded to the oxygen) in Ch+. If so, the protons of the methylene carbon bonded to the nitrogen appear to have a lower 1H-13C cross-polarization efficiency.
Fig. 3 shows the variable-temperature IR spectra in the CH and OH stretching regions of zeolites studied in this work. Comparison of their room temperature spectra with the spectrum of ChCl again confirms that the Ch+ ions remain intact upon occlusion in the pores of each zeolite, which is also the case of the cations in K–Y. We also note that the position of the OH stretching vibration band(s) from intrazeolitic Ch+ ions is always blue-shifted compared with that (ca. 3260 cm−1) of the OH stretching band from ChCl. Thus, although all zeolite synthesis mixtures employed here included some amount of Cl− anions (Table S1, ESI†), we can exclude the possibility of intermolecular hydrogen bonding between the Ch+ OH group and the Cl− ion (O–H⋯Cl−) in any of our zeolites. We can also ignore the contribution of hydrogen-bonded SiOH groups, if present, to the OH stretching vibration band(s) appearing around 3300–3600 cm−1. This is because none of the 1H MAS NMR spectra of zeolites studied here gave any noticeable resonances due to the hydrogen-bonded SiOH groups25,26 in the chemical shift region above 10 ppm (Fig. S6, ESI†).
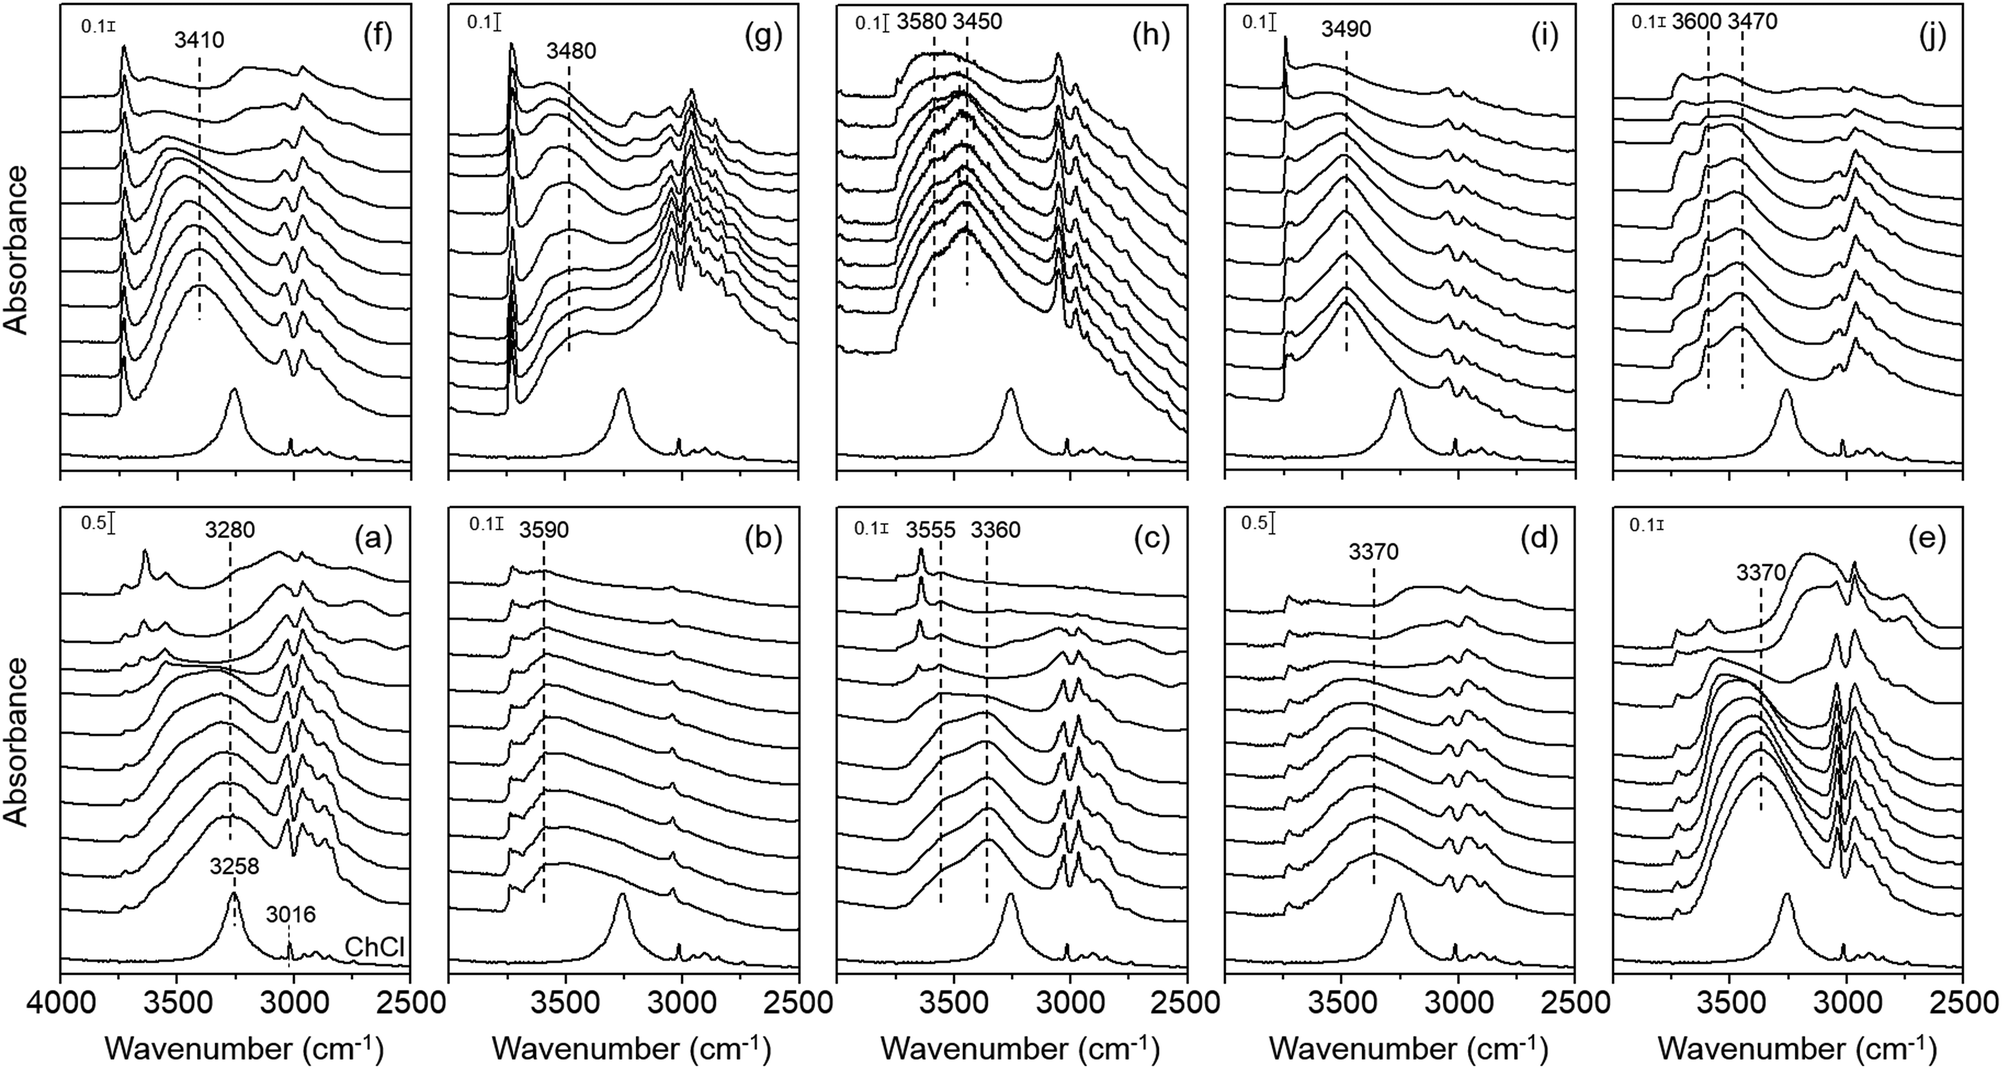 | ||
| Fig. 3 IR spectra in the 2500–4000 cm−1 region of as-made (a) Y, (b) K–Y, (c) Ch–Y, (d) UZM-4, (e) UZM-22, (f) offretite, (g) ferrierite, (h) phillipsite, (i) EU-12 and (j) levyne recorded at temperatures ranging from room temperature (bottom) to 450 °C (top) at intervals of 50 °C. The bottom trace in each panel is the spectrum of ChCl recorded at room temperature. | ||
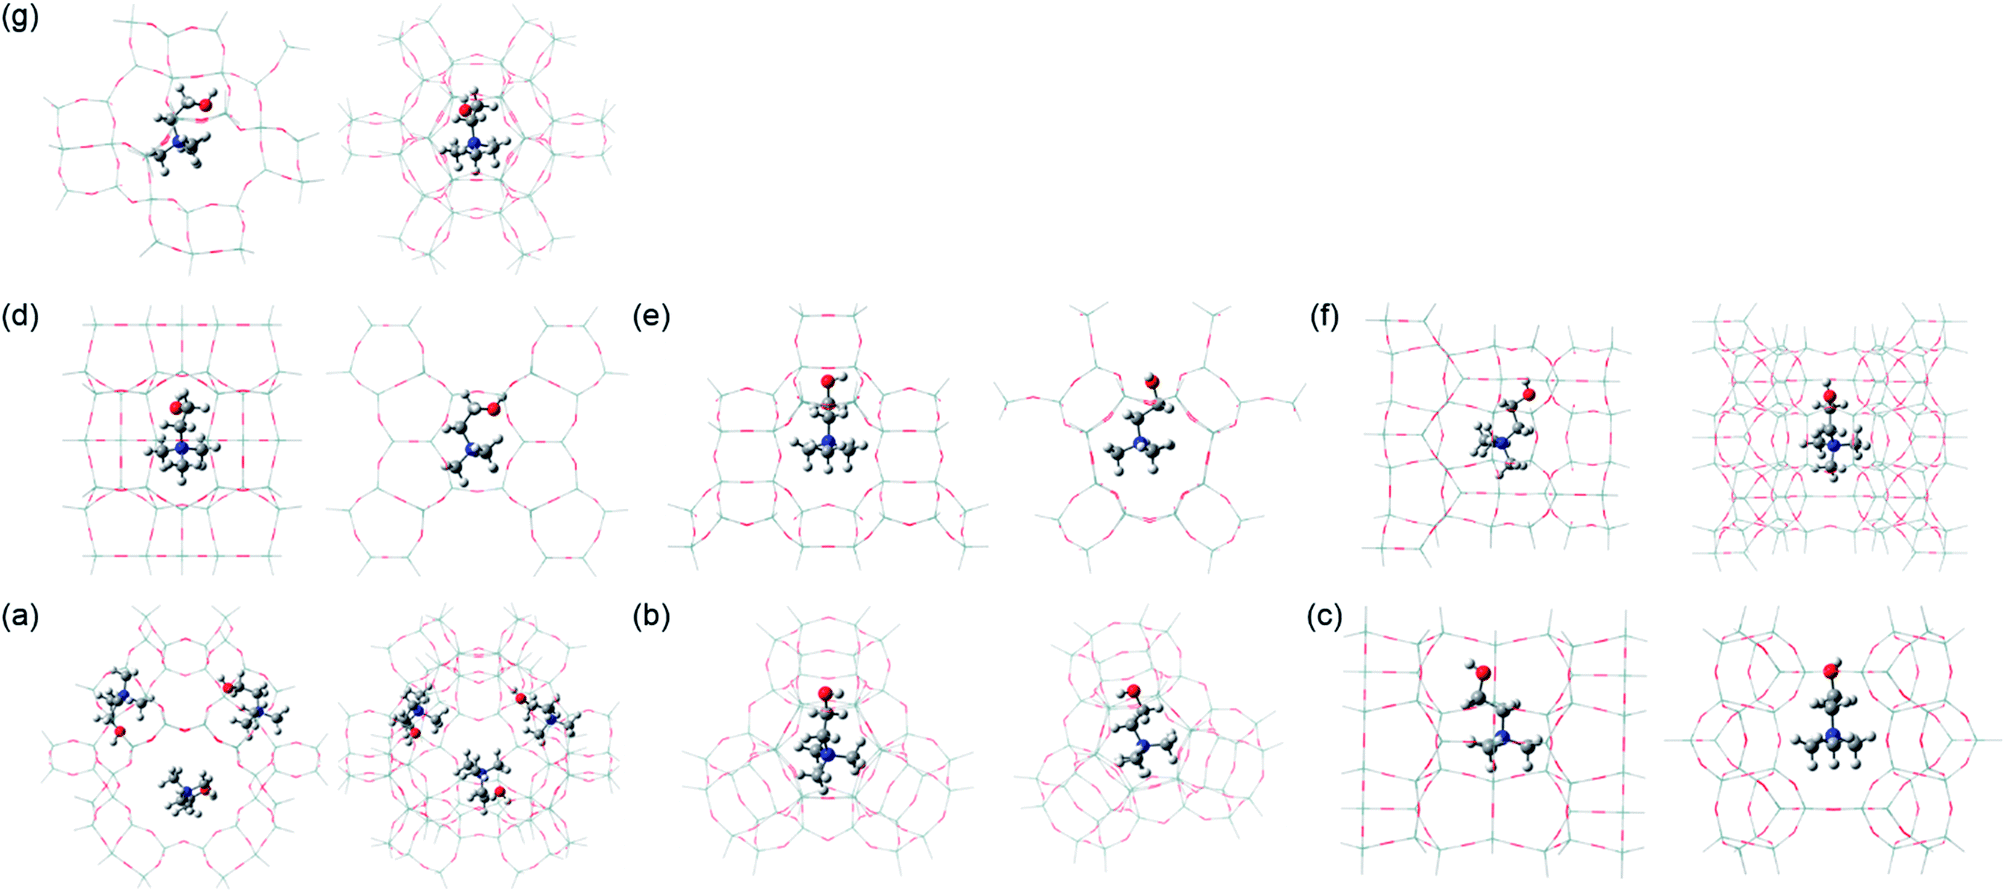 | ||
| Fig. 4 Side (left) and top (right) views of the structures of the most stable Ch+ conformer embedded in zeolites with different framework topologies: (a) gauche Ch+ in the Y supercage, (b) trans′ Ch+ in the Y sod cage, (c) trans Ch+ in the ferrierite channel intersection, (d) gauche Ch+ in the ferrierite fer cage, (e) trans′ Ch+ in phillipsite, (f) trans Ch+ in EU-12 and (g) gauche Ch+ in levyne. Notice that the Y supercage model contains three Ch+ ions, whereas the other six cluster models have one Ch+ ion. All the structures were optimized at the ONIOM (ωB97XD/6-31G(d,p):MNDO) level of theory. To clearly display the conformation of Ch+, the T-atoms in each theoretical model treated at the high ωB97XD level, as well as those treated at the low MNDO level, are represented as wire-frame models. Si, dark cyan; O, red; H, white; C, gray; N, blue. | ||
An interesting observation from Fig. 3 is that the extent of the blue shift in the OH stretching band differs markedly according to not only the structure type of zeolites containing Ch+ ions, but also the intrazeolitic location of this OH group-containing guest species. For example, the room-temperature IR spectrum of K–Y exhibits a broad OH stretching band around 3590 cm−1 which is much higher than the position (ca. 3280 cm−1) of the OH stretching band in the spectrum of Y. Because its Ch+ ions are all located as a trans conformer within the sod cages (Fig. 2), the OH group cannot form intramolecular hydrogen bonding and should thus be in a state similar to that in the free Ch+ ion. In fact, the OH stretching band of alcohols, such as ethanol and propanol, in the gas phase or in non-polar solvents typically occurs in the 3580–3670 cm−1 region.27
Fig. 3 also shows that the room-temperature IR spectra of OSDA molecules in the other three large-pore but channel-based zeolites UZM-4, UZM-22 and offretite, most of which have a gauche conformation, present an OH stretching band around 3370, 3370 and 3410 cm−1, respectively. While these band positions are still lower than the position (ca. 3590 cm−1) of the OH stretching band found in the spectrum of K–Y, they are rather higher than that (3280 cm−1) of the corresponding band from Y. More interestingly, with increasing IR measurement temperature, all the OH stretching bands from UZM-4, UZM-22 and offretite are shifted to a higher wavenumber region. As shown in Fig. 3, however, the highest position of their OH stretching band (ca. 3550 cm−1) was observed at 300 °C. Clearly, if the Ch+ ions in these large-pore zeolites have intramolecular hydrogen bonding between the protons of the CH3 group and the oxygen of the OH group (C–H⋯O–H), their free form would then be generated at elevated temperatures, giving a fairly narrower OH stretching band at 3590 cm−1 or higher, due to the weak nature of intramolecular hydrogen bonding and the higher mobility of free OH groups. Therefore, no intramolecular hydrogen bonding appears to exist within the Ch+ ions in UZM-22, as well as in UZM-4 and offretite.
Another interesting but unexpected result from Fig. 3 is that the room-temperature IR spectrum in the OH region of as-made levyne shows two bands around 3470 and 3600 cm−1, although each of its Ch+ cations is completely isolated as a gauche conformer within the lev cage (Table 1 and Fig. 2). We note here that the position (ca. 3600 cm−1) of a narrower OH stretching band is marginally higher than that (ca. 3590 cm−1) observed for K–Y. The fact that no noticeable changes in the position and width of this band are caused by an increase in IR measurement temperature up to 300 °C suggests its free nature. A similar temperature independence can be observed for the other broad band appearing around 3470 cm−1. Assuming that the Al atoms are randomly distributed in the framework, our levyne was calculated to possess approximately one Al atom per lev cage, matching the number of Ch+ ions per cage. This allowed us to assign a broad band around 3470 cm−1 to the OH group of OSDAs involved in intermolecular electrostatic interactions with the negatively charged zeolite framework. Since as-made levyne also has ca. 0.3 Na+ ions per cage (Table 1), however, about one of the three Ch+ ions does not necessarily compensate for the framework negative charge created by Al substitution. Therefore, we assign the relatively narrower band around 3600 cm−1 to the OH group of Ch+ ions not involved in electrostatic interactions. Fig. 3 also shows that unlike that of Y, the room-temperature IR spectrum of Ch–Y is characterized by two OH stretching bands around 3360 and 3560 cm−1, where the intensity of the high-wavenumber band is quite weaker. Because a combination of elemental and thermal analyses on Ch–Y indicates that the sum (55.4) of the numbers per unit cell of Ch+ and Na+ ions is almost the same as the number (54.8) per unit cell of framework Al atoms, the Ch+ ions within the supercages in Ch–Y may counterbalance the framework negative charge. Therefore, it is clear that the nature of guest–guest interactions within the supercages is different for Y and Ch–Y, although the origin of the weak high-wavenumber band from Ch–Y remains unknown.
The room-temperature IR spectrum of the channel-based medium-pore zeolite ferrierite, where the Ch+ ions are present predominantly as a trans conformer, gives one band around 3480 cm−1. This band continuously shifts to ca. 3570 cm−1 with increasing the measurement temperature to 400 °C. In contrast, the spectrum of the channel-based small-pore zeolite phillipsite shows two OH stretching bands around 3450 and 3580 cm−1, the positions of which are almost insensitive to the IR measurement temperature. Thus, while a similar interpretation to that applied to the spectrum of levyne can be made to the OH stretching bands from phillipsite, the room-temperature IR spectrum of EU-12 containing trans Ch+ ions only is characterized by one broad band around 3490 cm−1. Since this band position is similar to the value (ca. 3470 cm−1) of the lower-wavenumber OH stretching band observed for the room temperature IR spectrum of levyne, it appears that the position of the OH stretching vibration mode of intrazeolitic Ch+ ions is influenced by the interactions with the zeolite host rather than by the type of conformation.
The most important finding from Fig. 3 is that although IR measurements were performed at 150 °C, there are no noticeable changes in the number, position and shape of the OH stretching band of Ch+ ions in each zeolite. Given that all zeolites studied here were synthesized at 100–150 °C (Table S1, ESI†), therefore, their host–guest interactions were maintained in a manner different from one another even at the crystallization temperature. However, the thermal energy at 150 °C is only 3.5 kJ mol−1 that is fairly lower than the difference (≥18 kJ mol−1) between the gas-phase energy levels of gauche Ch+ and its trans or trans′ form.17 This implies that the interchange of the former conformer to the latter one is thermodynamically unfavorable to take place under zeolite synthesis conditions employed here. If such is the case, Ch+ would exist most commonly as the gauche conformer at the nucleation stage, thus being entrapped as the same or similar form within the void space of the developing zeolite host structure. As characterized by Raman spectroscopy, however, the OSDA molecules in ferrierite, phillipsite and EU-12 are predominantly or exclusively in the trans conformation, suggesting that the conformation of Ch+ is a critical phase selectivity factor in zeolite syntheses. In this respect, its conformation may have an important kinetic role as an OSDA, but not as a pore-filling agent.
To gain insights into the structure-directing effects of Ch+ conformation on the phase selectivity of the crystallization, we performed relative energy calculations on its gauche, trans and trans′ conformers embedded in five different representative zeolite structures, but in seven different OSDA locations (i.e., 96T Y supercage, 48T Y sod cage, 78T ferrierite channel intersection, 76T ferrierite fer cage, 64T phillipsite, 88T EU-12, and 60T levyne models). Here we did not carry out energy calculations on the Ch+ conformers in UZM-4, UZM-22 and offretite, owing to the lack of information on the reliable OSDA locations in these channel-based large-pore zeolites. According to the TGA/DTA results, each supercage in Ch–Y with Si/Al = 2.6 contains ca. 2.6 Ch+ ions on average. Thus, we assumed that the Y supercage can accommodate up to three Ch+ ions. We first calculated the energies of trans and trans′ Ch+ ions relative to the gauche conformer in the free state, using their optimized geometries. The energies calculated relative to the ‘free’ gauche conformer were 23 and 27 kJ mol−1, respectively. These values are a little higher than those (18 and 23 kJ mol−1, respectively) reported by Ashworth et al.,17 which can be attributed to differences in the method by which the respective sets of energies have been calculated. But note that they are still significantly greater than the thermal energy (3.5 kJ mol−1) at 150 °C. When the optimized structures of three representative Ch+ conformers were introduced into each theoretical model described above, on the other hand, their N–C–C–O and C–C–O–H dihedral angles were found to slightly deviate from the torsion angles of free gauche (60 and 180°), trans (180 and 180°) and trans′ (180 and 90°) conformations, probably due to the steric hindrance between the ammonium head and OH groups in Ch+, as well as that with the zeolite framework.
Table 2 lists the relative energies of the three different Ch+ conformers in various zeolite models. It is clear that the energetically preferred conformation differs according to the structure type of zeolite hosts. For example, gauche Ch+ is more stable in the Y supercage and levyne by ca. 60 and 28 kJ mol−1 than the trans conformer, respectively. With increasing the number of Ch+ ions in the Y supercage to three, in addition, the difference in the relative energies of gauche and trans or trans′ Ch+ increases. When Ch+ is embedded in the Y sod cage, ferrierite channel intersection and phillipsite, however, trans or trans′ Ch+ has a lower relative energy (−7.2, −7.5 and −18.4 kJ mol−1, respectively) than gauche Ch+, which correlates well with the Raman results in Fig. 2. An unexpected result from Table 2 is that gauche Ch+ is considerably more stable (>30 and > 15 kJ mol−1, respectively) in the ferrierite fer cage and EU-12 than trans or trans′ Ch+, although the OSDA molecules dominantly or exclusively present in these zeolites were characterized to adopt a trans conformation (Fig. 2). Moreover, the relative energy difference (11.7 kJ mol−1) between the trans and trans′ Ch+ conformers in the Y sod cage was calculated to be larger than that (7.2 kJ mol−1) between the gauche and trans′ Ch+ conformers in the same small cage, which is opposite to the trend found in the other zeolite models. These results inspired us to focus on the total stabilization energies of the three different Ch+ conformers in each zeolite structure.
| Cluster model | Ch+/clustera | Ch+ conformation | E rel (kJ mol−1) | ΔEdef(ZEO)c (kJ mol−1) | ΔEdef(OSDA)d (kJ mol−1) | E def (kJ mol−1) | ΔEintf (kJ mol−1) | ΔEtotg (kJ mol−1) |
|---|---|---|---|---|---|---|---|---|
| a The number of Ch+ ions occluded in a given cluster model. The structures of the most stable Ch+ conformer in each cluster model can be found in Fig. 4. b E rel = EOSDA/ZEO − Egauche/ZEO. c ΔEdef(ZEO) = Ec(ZEO) − E(ZEO). d ΔEdef(OSDA) = Ec(OSDA) − E(OSDA). e E def = ΔEdef(ZEO) + ΔEdef(OSDA). f ΔEint = EOSDA/ZEO − Ec(ZEO) − Ec(OSDA). g ΔEtot = Edef + ΔEint. | ||||||||
| Y supercage | 1 | gauche | 0 | 14.3 | 2.6 | 16.9 | −172.1 | −155.2 |
| trans | 23.8 | 15.8 | 1.9 | 17.7 | −172.1 | −154.4 | ||
| trans′ | 15.6 | 18.9 | 1.9 | 20.8 | −187.1 | −166.3 | ||
| 2 | gauche | 0 | 37.6 | 7.1 | 44.7 | −380.7 | −336.0 | |
| trans | 22.1 | 35.6 | 2.2 | 37.9 | −379.5 | −341.6 | ||
| trans′ | 19.5 | 36.2 | 1.7 | 37.9 | −366.6 | −328.7 | ||
| 3 | gauche | 0 | 52.5 | 3.4 | 55.8 | −564.7 | −508.9 | |
| trans | 60.2 | 56.1 | 3.7 | 59.8 | −551.1 | −491.3 | ||
| trans′ | 95.4 | 54.3 | 1.8 | 56.1 | −544.5 | −488.3 | ||
| Y sod cage | 1 | gauche | 0 | 53.0 | 66.1 | 119.1 | −108.8 | 10.2 |
| trans | 4.5 | 62.5 | 37.6 | 100.1 | −108.4 | −8.3 | ||
| trans′ | −7.2 | 63.6 | 34.4 | 98.0 | −121.7 | −23.7 | ||
| Ferrierite channel intersection | 1 | gauche | 0 | 21.9 | 10.0 | 31.9 | −246.7 | −214.8 |
| trans | −7.5 | 19.8 | 3.4 | 23.2 | −264.5 | −241.3 | ||
| trans′ | 0.9 | 21.0 | 5.8 | 26.8 | −267.5 | −240.6 | ||
| Ferrierite fer cage | 1 | gauche | 0 | 17.8 | 3.0 | 20.7 | −250.4 | −229.7 |
| trans | 32.2 | 19.4 | 5.3 | 24.7 | −245.2 | −220.5 | ||
| trans′ | 30.8 | 21.2 | 5.2 | 26.4 | −252.1 | −225.7 | ||
| Phillipsite | 1 | gauche | 0 | 20.1 | 13.3 | 33.5 | −209.0 | −175.6 |
| trans | −18.1 | 22.1 | 2.6 | 24.7 | −241.4 | −216.7 | ||
| trans′ | −18.4 | 22.6 | 2.9 | 25.5 | −246.2 | −220.7 | ||
| EU-12 | 1 | gauche | 0 | 18.7 | 1.4 | 20.1 | −278.3 | −258.2 |
| trans | 15.9 | 21.6 | 2.4 | 24.0 | −289.3 | −265.3 | ||
| trans′ | 25.8 | 23.9 | 4.2 | 28.1 | −287.2 | −259.1 | ||
| Levyne | 1 | gauche | 0 | 18.4 | 1.3 | 19.7 | −214.5 | −194.8 |
| trans | 28.4 | 19.9 | 0.7 | 20.5 | −209.9 | −189.4 | ||
| trans′ | 34.4 | 21.1 | 1.3 | 22.4 | −209.5 | −187.1 | ||
As shown in Table 2, the conformer with the lowest total stabilization energy in a given zeolite model was found to be always identical to that experimentally identified to dominantly or exclusively exist in the corresponding zeolite, which is now also the case for Ch+ in EU-12. The total stabilization energy of the trans conformer in this channel-based zeolite is lower by 7.1 kJ mol−1 than that of the gauche one, because the intermolecular interaction energy of trans Ch+ with the EU-12 framework is lower by 11.0 kJ mol−1 than that of gauche Ch+ and thus offsets the difference (3.9 kJ mol−1) in their total deformation energies. A similar trend was observed for the gauche and trans Ch+ ions in the Y sod cage, mainly due to the large difference in the deformation energies of the two conformers. When Ch+ is embedded in the ferrierite fer cage, on the other hand, the difference in the total stabilization energy was calculated to be only 4.0 kJ mol−1, regardless of its conformation type. Thus, the gauche conformer which was experimentally confirmed to exist in ferrierite (Table 1) appears to be mainly located within the fer cage. Table 2 also shows that the difference (15.4 vs. <6.2 kJ mol−1) in the total stabilization energies of trans and trans′ Ch+ conformers is still larger in the Y sod cage than in the other six zeolite models. It should be noted here that the intermolecular interaction energy (−121.7 vs. −108.4 kJ mol−1) of trans′ Ch+ with the Y sod cage is much lower than that of trans Ch+, although a similar strain was imposed on both Ch+ conformers. This strongly suggests that even small differences in the OSDA conformation can greatly affect the phase selectivity of the crystallization. All these calculation results led us to believe that the Ch+ ions encapsulated within the inorganic-organic structures should self-assemble during zeolite nucleation and already adopt a very narrow range of conformations similar to that which they have in the zeolite product.
It has been repeatedly shown that OSDAs with a high degree of flexibility, as well as rigid and bulky OSDAs, direct the synthesis of a number of different zeolite structures, depending on the type and concentration of ISDAs such as alkali metal cations, OH− or F− anions and/or heteroatoms other than Si in the synthesis mixture, as well as on the crystallization time and temperature.4,18,19 Since the type and concentration of ISDAs, as well as the water concentration, in Ch+-containing zeolite synthesis mixtures used here are different from one another (Table S1, ESI†), the most abundant type of Ch+ conformations under synthesis conditions may be different from one another. The fact that the relative energies of various Ch+ conformers within various zeolite structures calculated from a thermodynamic point of view are not always consistent with the experimental results suggests the ‘instantaneous capture’ of specific types of OSDA conformations under zeolite synthesis conditions. This may play an important ‘kinetic’ role in determining the structure type of zeolites during the nucleation process, because the absolute value range (7–60 kJ mol−1) of differences in the relative energies of intrazeolitc Ch+ conformers (Table 2) is significantly larger than the thermal energy (≤3.5 kJ mol−1) available at the synthesis temperatures of zeolites studied here.
Finally, to examine the effects of OSDA hydrophobicity (OH vs. CH3) on the phase selectivity of the crystallization, we replaced Ch+ ions in some synthesis mixtures with the equimolar amount of propyltrimethylammonium (PTMA+) ions, whose shape and size are quite similar to those of Ch+ ions, and carried out zeolite syntheses while keeping the other synthesis parameters constant. When we used PTMA+ under the conditions where the formation of levyne, EU-12 and phillipsite proved to be highly reproducible, the phases we obtained were analcime, mordenite and a mixture of phillipsite and mordenite, respectively. Therefore, it appears that OSDA hydrophobicity can have a great influence on the phase selectivity, as well as on the rate of crystallization,28 although further study is necessary to more precisely understand this effect.
Conclusions
The relationship between the conformation of Ch+ ions used as an OSDA in zeolite synthesis and the framework structure of the series of resulting zeolite hosts (i.e., Y, UZM-4, UZM-22, offretite, ferrierite, phillipsite, EU-12 and levyne) has been studied by elemental and thermal analyses, Raman, 1H-13C CP MAS NMR, variable-temperature IR and theoretical calculations. The overall experimental results of this study reveal that the conformation of Ch+ varies not only with the structure type of zeolite hosts but also with the intrazeolitic location. The pure-silica model-based theoretical calculations on the gauche, trans and trans′ conformers of this asymmetric OSDA in various zeolite structures show that a specific Ch+ conformer, which was experimentally identified to be dominantly or exclusively present in a given zeolite, gives a lower intermolecular interaction energy, one of the main driving forces for self-assembly processes like zeolite crystallization. Therefore, particular types of OSDA conformations may be kinetically captured or “frozen out” under zeolite synthesis conditions, acting as a phase selectivity factor during zeolite nucleation and thus to play a structure-directing role rather than a pore-filling one. This explains why the use of flexible OSDAs in zeolite synthesis has been of major importance and needs to continue in the search for zeolitic materials with unprecedented framework structures.Conflicts of interest
There are no conflicts to declare.Acknowledgements
This work was supported by the National Creative Research Initiative Program (2012R1A3A2048833) through the National Research Foundation of Korea.Notes and references
- R. M. Barrer and P. J. Denny, J. Chem. Soc., 1961, 971 RSC.
- R. Szostak, Handbook of Molecular Sieves, Van Nostrand Reinhold, New York, 1992 Search PubMed.
- M. A. Camblor and S. B. Hong, in Porous Materials, ed. D. W. Bruce, D. O'Hare and R. I. Walton, Wiley, Chichester, 2011, p. 265 Search PubMed.
- M. Moliner, F. Rey and A. Corma, Angew. Chem., Int. Ed., 2013, 52, 13880 CrossRef PubMed.
- J. Li, A. Corma and J. Yu, Chem. Soc. Rev., 2015, 44, 7112 RSC.
- S. B. Hong, M. A. Camblor and M. E. Davis, J. Am. Chem. Soc., 1997, 119, 761 CrossRef.
- M. G. O'Brien, A. M. Beale, C. R. A. Catlow and B. M. Weckhuysen, J. Am. Chem. Soc., 2006, 128, 11744 CrossRef PubMed.
- J. E. Schmidt, D. Fu, M. W. Deem and B. M. Weckhuysen, Angew. Chem., Int. Ed., 2016, 55, 16044 CrossRef PubMed.
- M. A. Miller, J. G. Moscoso, S. C. Koster, M. G. Gatter and G. J. Lewis, Stud. Surf. Sci. Catal., 2007, 170, 347 CrossRef.
- Y. Lee, M. B. Park, P. S. Kim, A. Vicente, C. Fernandez, I.-S. Nam and S. B. Hong, ACS Catal., 2013, 3, 617 CrossRef.
- J. Bae, J. Cho, J. H. Lee, S. M. Seo and S. B. Hong, Angew. Chem., Int. Ed., 2016, 55, 7369 CrossRef PubMed.
- T. Inoue, M. Itakura, H. Jon, Y. Oumi, A. Takahashi, T. Fujitani and T. Sano, Microporous Mesoporous Mater., 2009, 122, 149 CrossRef.
- J. Hjortás and H. Sørum, Acta Crystallogr., 1971, B27, 1320 CrossRef.
- P. Partington, J. Feeney and A. S. V. Burgen, Mol. Pharmacol., 1972, 8, 269 Search PubMed.
- Y. Terui, M. Ueyama, S. Satoh and K. Tori, Tetrahedron, 1974, 30, 1465 CrossRef.
- L. Tanzi, P. Benassi, M. Nardone and F. Ramondo, J. Phys. Chem. A, 2014, 118, 12229 CrossRef PubMed.
- C. R. Ashworth, R. P. Matthews, T. Welton and P. A. Hunt, Phys. Chem. Chem. Phys., 2016, 18, 18145 RSC.
- B. Han, S.-H. Lee, C.-H. Shin, P. A. Cox and S. B. Hong, Chem. Mater., 2005, 17, 477 CrossRef.
- B. Han, C.-H. Shin, P. A. Cox and S. B. Hong, J. Phys. Chem. B, 2006, 110, 8188 CrossRef PubMed.
- C. Baerlocher and L. B. McCusker, Database of Zeolite Structures, http://www.iza-structure.org/databases/, accessed July 18, 2018 Search PubMed.
- M. J. Frisch, et al., Gaussian 09, Revision C.01, Gaussian, Inc., Wallingford, CT, 2010 Search PubMed.
- H. Akutsu, Biochemistry, 1981, 20, 7359 CrossRef PubMed.
- H. Akutsu, Y. Suezaki, W. Yoshikawa and Y. Kyogoku, Biochim. Biophys. Acta, 1986, 854, 213 CrossRef.
- S. B. Hong, Microporous Mater., 1995, 4, 309 CrossRef.
- H. Koller, R. F. Lobo, S. L. Burkett and M. E. Davis, J. Phys. Chem., 1995, 99, 12588 CrossRef.
- D. C. Apperley, M. J. Hudson, M. T. J. Keene and J. A. Knowles, J. Mater. Chem., 1995, 5, 577 RSC.
- G. Socrates, Infrared and Raman Characteristic Group Frequencies: Tables and Charts, J. Wiley and Sons, Chichester, 2001 Search PubMed.
- A. A. V. Goretsky, L. W. Berk, S. I. Zones and M. E. Davis, Microporous Mesoporous Mater., 1999, 28, 387 CrossRef.
Footnote |
| † Electronic supplementary information (ESI) available: Gel composition data, powder XRD, SEM and TGA/DTA data, Raman and multinuclear MAS NMR spectra. See DOI: 10.1039/c8sc02581a |
| This journal is © The Royal Society of Chemistry 2018 |